Exposing the Core (part 2)

The release date of the upcoming 0.9.3 version is drawing nearer. Several format classes have already been exposed to Python and in this post I’m going to show you some code snippets. Since it’s impossible to demonstrate all format classes (12 have already been exposed) and all their methods (a single class may contain dozens of methods), the purpose of the snippets below is only to give the reader an idea of what can be achieved.

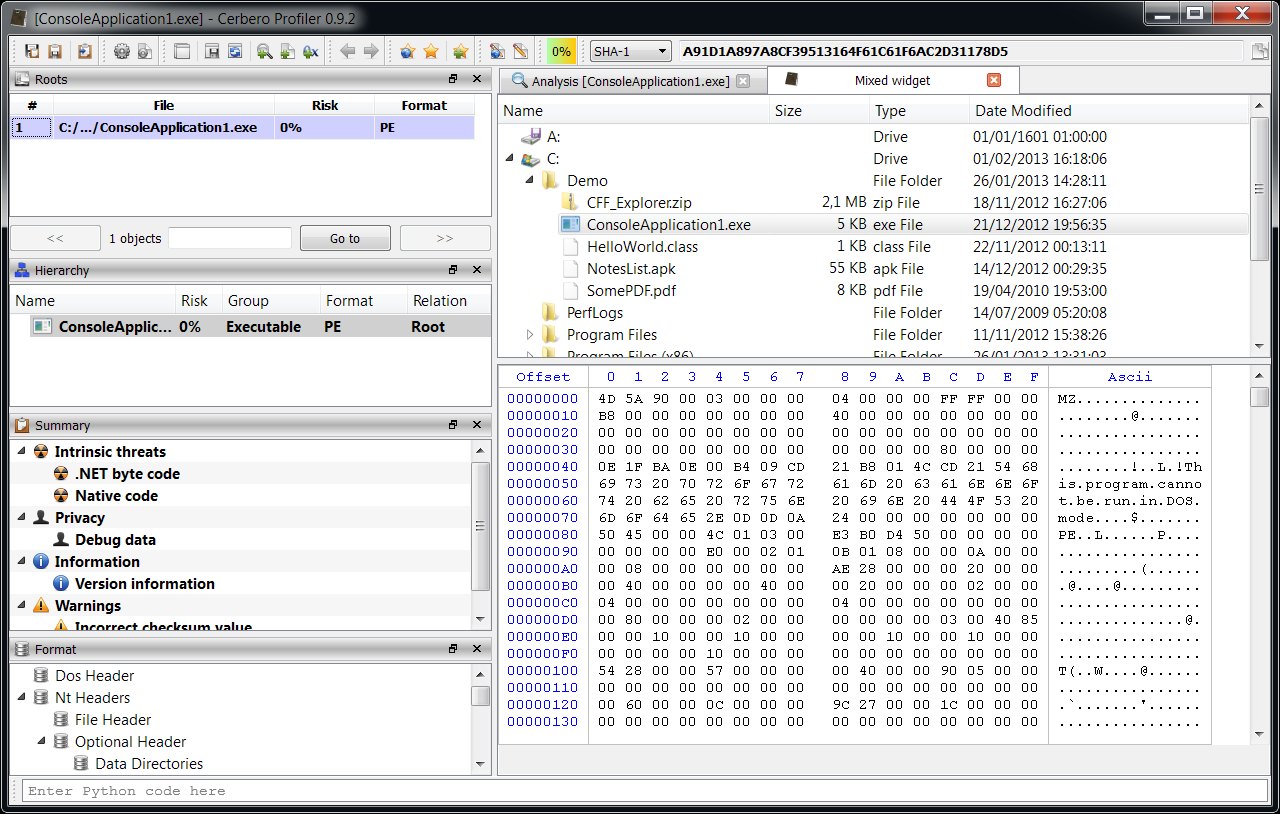
The SDK organization has changed a bit: because of its increasing size it made sense to subdivide it into modules. Thus, there’s now the Pro.Core module, the Pro.UI one and one module for each format (e.g. Pro.PE).

PDF

This is how we can output to text the raw stream of a PDF:

from Pro.Core import *
from Pro.PDF import *

c = createContainerFromFile(fname)
pdf = PDFObject()
pdf.Load(c)
objtable = pdf.BuildObjectTable()
pdf.SetObjectTable(objtable)
oid = PDFObject.OBJID(3, 0)
ret, dict, content, info = pdf.ParseObject(objtable, oid)
out = NTTextBuffer()
out.printHex(content)
print(out.buffer)

Output:

         0  1  2  3  4  5  6  7   8  9  A  B  C  D  E  F    Ascii

0000   48 89 24 8D CD 0A 83 30  10 84 EF 81 BC C3 1C 93    H.$....0........
0010   8B 4D 52 63 E3 B5 D0 0A  42 A1 D0 DC C4 83 D4 F8    .MRc....B.......
0020   D3 D6 0A 2A F5 F5 BB B6  B0 CC 2E C3 37 3B 1A 2D    ...*........7;.-
0030   67 2A B2 C8 38 D3 C8 A1  F0 80 C6 8A 18 17 14 7B    g*..8..........{
0040   94 0A 35 67 BB EC 66 D0  CE 1B D1 83 34 75 48 92    ..5g..f.....4uH.
0050   04 46 C7 B0 0E 53 E0 EC  48 E3 09 3C 1B 4A FB 86    .F...S..H..<.J..
0060   18 43 AF 14 68 19 7D 88  1C 05 52 05 3F 50 D7 DF    .C..h.}...R.?P..
0070   C7 73 3B FD FD A7 2B 67  85 B8 CA 58 89 6A 5E 02    .s;...+g...X.j^.
0080   96 2E A0 E9 C3 AB 46 F5  AE 31 8C 52 5B F1 91 C6    ......F..1.R[...
0090   8A 20 95 C0 32 A2 0B 53  D8 CC 48 96 3E E7 EC 44    . ..2..S..H.>..D
00A0   CD 5F 01 06 00 88 1E 2A  AA 0D 0A                   ._.....*...    

Streams in PDFs are usually compressed. Here’s how we can decode the same stream:

from Pro.Core import *
from Pro.PDF import *

c = createContainerFromFile(fname)
pdf = PDFObject()
pdf.Load(c)
objtable = pdf.BuildObjectTable()
pdf.SetObjectTable(objtable)
oid = PDFObject.OBJID(3, 0)
ret, dict, content, info = pdf.ParseObject(objtable, oid)
content = pdf.DecodeObjectStream(content, dict, oid)
out = NTTextBuffer()
out.printHex(content)
print(out.buffer)

Output:

        0  1  2  3  4  5  6  7   8  9  A  B  C  D  E  F    Ascii

0000   31 20 67 0D 0A 30 2E 35  20 47 0D 0A 31 20 4A 20    1 g..0.5 G..1 J 
0010   30 20 6A 20 31 20 77 20  34 20 4D 20 5B 33 20 5D    0 j 1 w 4 M [3 ]
0020   30 20 64 0D 0A 2F 47 53  32 20 67 73 0D 0A 31 20    0 d../GS2 gs..1 
0030   69 20 0D 0A 31 39 38 20  36 36 36 20 32 31 34 20    i ..198 666 214 
0040   35 38 20 72 65 0D 0A 42  0D 0A 42 54 0D 0A 2F 46    58 re..B..BT../F
0050   32 20 31 20 54 66 0D 0A  31 32 20 30 20 30 20 31    2 1 Tf..12 0 0 1
0060   32 20 32 31 37 2E 38 38  20 36 39 30 20 54 6D 0D    2 217.88 690 Tm.
0070   0A 30 20 30 20 30 20 31  20 6B 0D 0A 30 20 54 63    .0 0 0 1 k..0 Tc
0080   0D 0A 30 20 54 77 0D 0A  5B 28 50 29 34 30 28 61    ..0 Tw..[(P)40(a
0090   73 74 65 20 74 68 65 20  66 69 65 6C 64 20 61 6E    ste the field an
00A0   64 20 6D 6F 29 31 35 28  76 29 32 35 28 65 29 30    d mo)15(v)25(e)0
00B0   28 20 74 6F 20 68 65 72  65 29 31 35 28 2E 29 5D    ( to here)15(.)]
00C0   54 4A 0D 0A 45 54 0D 0A                             TJ..ET..        

We might also want to iterate through the key/value pairs of a PDF dictionary. Thus, iterators have been implemented everywhere they could be applied. While they don’t yet support the standard Python syntax they are very easy to use:

from Pro.Core import *
from Pro.PDF import *

c = createContainerFromFile(fname)
pdf = PDFObject()
pdf.Load(c)
objtable = pdf.BuildObjectTable()
pdf.SetObjectTable(objtable)
oid = PDFObject.OBJID(3, 0)
ret, dict, content, info = pdf.ParseObject(objtable, oid)
it = dict.iterator()
while it.hasNext():
    k, v = it.next()
    print(k + " - " + v)

Output:

/Length - 171
/Filter - /FlateDecode

Iterating through the objects of a PDF amounts to the same logic:

from Pro.Core import *
from Pro.PDF import *

c = createContainerFromFile(fname)
pdf = PDFObject()
pdf.Load(c)
objtable = pdf.BuildObjectTable()
it = objtable.iterator()
while it.hasNext():
    k, v = it.next()
    # print out the object id
    print(str(k >> 32))

CFBF (DOC, XLS, PPT, MSI, etc.)

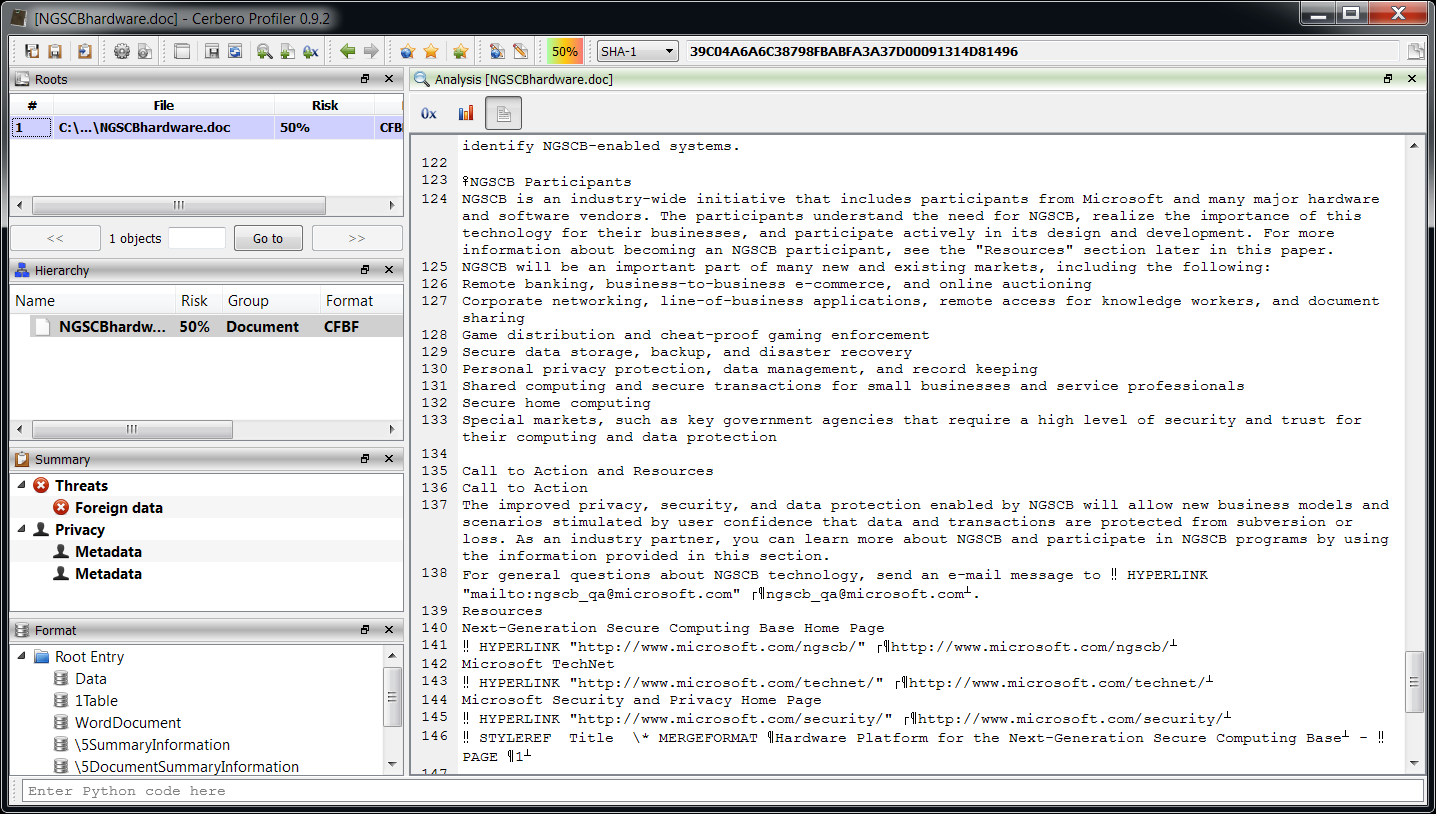
Iterating through the directories of a CFBF can be as simple as:

from Pro.Core import *
from Pro.CFBF import *

def visitor(obj, ud, dir_id, children):
    name = obj.DirectoryName(dir_id)
    print(name)
    return 0

c = createContainerFromFile(fname)
cfb = CFBObject()
cfb.Load(c)
dirs = cfb.BuildDirectoryTree()
cfb.SetDirectoryTree(dirs)
cfb.VisitDirectories(dirs, visitor, None)

Output:

Root Entry
CompObj
Ole
1Table
SummaryInformation
WordDocument
DocumentSummaryInformation

Retrieving a stream is equally easy:

from Pro.Core import *
from Pro.CFBF import *

c = createContainerFromFile(fname)
cfb = CFBObject()
cfb.Load(c)
dirs = cfb.BuildDirectoryTree()
cfb.SetDirectoryTree(dirs)
s = cfb.Stream(1)
b = s.read(0, s.size()) # read bytes
t = NTTextBuffer()
t.printHex(b)
print(t.buffer)

Output:

        0  1  2  3  4  5  6  7   8  9  A  B  C  D  E  F    Ascii

0000   01 00 FE FF 03 0A 00 00  FF FF FF FF 06 09 02 00    ................
0010   00 00 00 00 C0 00 00 00  00 00 00 46 18 00 00 00    ...........F....
0020   4D 69 63 72 6F 73 6F 66  74 20 57 6F 72 64 2D 44    Microsoft Word-D
0030   6F 6B 75 6D 65 6E 74 00  0A 00 00 00 4D 53 57 6F    okument.....MSWo
0040   72 64 44 6F 63 00 10 00  00 00 57 6F 72 64 2E 44    rdDoc.....Word.D
0050   6F 63 75 6D 65 6E 74 2E  38 00 F4 39 B2 71 00 00    ocument.8..9.q..
0060   00 00 00 00 00 00 00 00  00 00                      ..........      

SWF

Here’s how to output the disasm of an ActionScript2 Flash file:

from Pro.Core import *
from Pro.SWF import *

c = createContainerFromFile(fname)
swf = SWFObject()
swf.Load(c)
if swf.IsCompressed():
    swf.Decompress()
tl = swf.EnumerateTags()
swf.SetStoredTags(tl)
out = NTTextBuffer()
swf.AS2Disassemble(out)
print(out.buffer)

The same can be done for ActionScript3 using the ABCFileObject class.
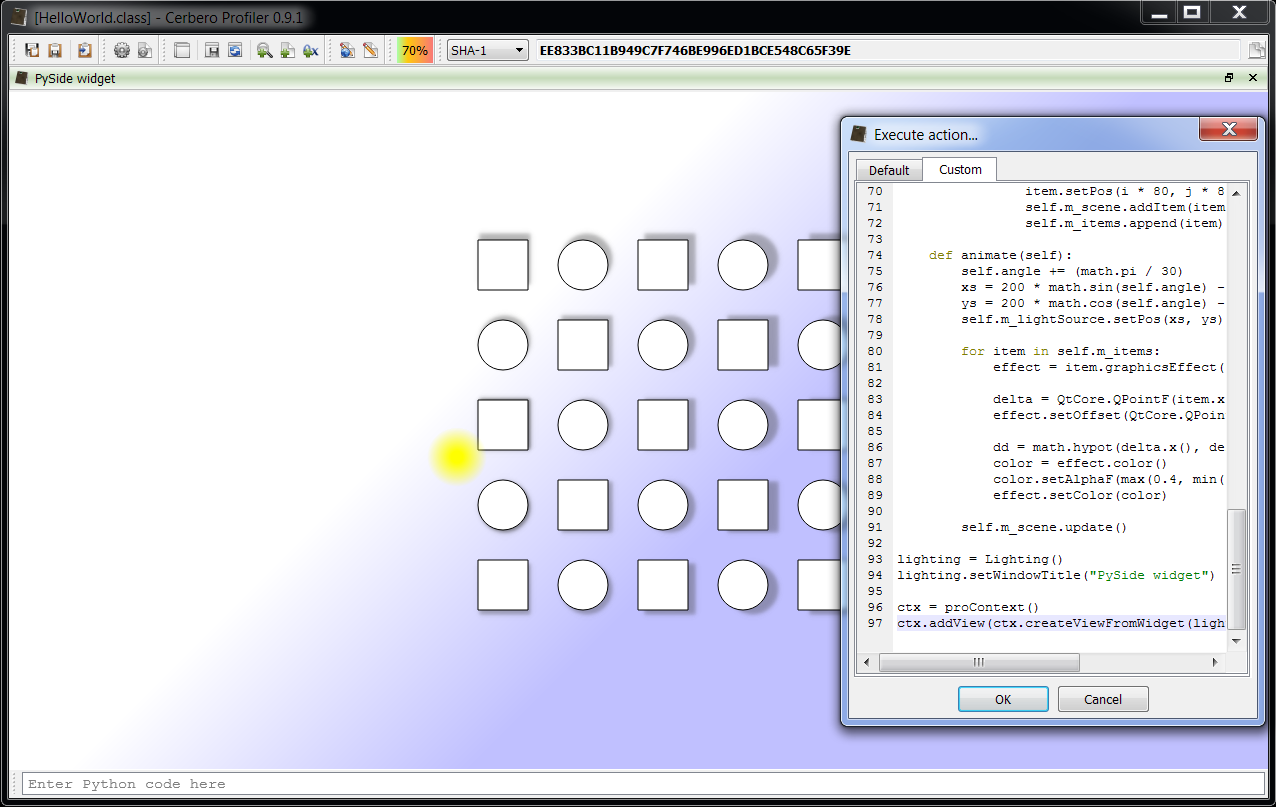
Class

This is how to disassemble a Java Class file:

from Pro.Core import *
from Pro.Class import *

c = createContainerFromFile(fname)
cl = ClassObject()
cl.Load(c)
cl.ProcessClass()
out = NTTextBuffer()
cl.Disassemble(out)
print(out.buffer)

DEX

This is how to disassemble an Android DEX file class:

from Pro.Core import *
from Pro.DEX import *

c = createContainerFromFile(fname)
dex = DEXObject()
dex.Load(c)
# disassemble the last class
classes = dex.Classes()
token = classes.Count() - 1
out = NTTextBuffer()
dex.Disassemble(out, token)
print(out.buffer)

In the upcoming post(s) I’m going to put it all together and do some very interesting things.
So stay tuned as the best has yet to come!

Exposing the Core (part 1)

The main feature of the upcoming 0.9.3 version of the Profiler is the expansion of the public SDK. This basically means that a consistent subset of the internal classes will be exposed. Although it’s a subset, there’s no way to document all methods and functions. Fortunately, many of them should be quite intuitive.

Some of the most common important classes are:

  • NTContainer: this is a generic container which is used to encapsulate data such as files and memory. It’s an extremely important class, since it’s used extensively. Containers can for the time being be created through SDK functions such as: createContainerFromFile/newContainer.
  • NTBuffer/NTContainerBuffer/CFFBuffer/etc.: used to efficiently read iteratively small amounts of data from a source.
  • NTTextStream/NTTextBuffer/NTTextStringBuffer: used to output text. Indentation can be specified.
  • NTXml: used to parse XML. Fast and secure. This class is based on RapidXML.
  • CFFObject: the class from which every format class inherits (ZipObject, PEObject, etc). A very small subset of this class is exposed for now. This will change in the future.
  • CFFStruct: representation of a file format structure.
  • CFFFlags: representation of flags in a CFFStruct.

One of the new additions is that Python can now use filters as well. Do you remember the post about Widget and Views? Let’s use the same code base and change just a few lines:

from Pro import *
from PySide import QtCore, QtGui
 
class MixedWidget(QtGui.QSplitter):
    def __init__(self, parent=None):
        super(MixedWidget, self).__init__(parent)
 
        self.setWindowTitle("Mixed widget")
        self.setOrientation(QtCore.Qt.Vertical)
 
        self.model = QtGui.QDirModel()
        tree = QtGui.QTreeView()
        tree.setModel(self.model)
        self.addWidget(tree)
 
        ctx = proContext()
        self.hex = ctx.createView(ProView.Type_Hex, "")
        self.addWidget(self.hex.toWidget())
 
        tree.activated.connect(self.updateFile)
 
    def updateFile(self, idx):
        if self.model.isDir(idx) == True:
            self.hex.clear()
        else:
            # modified lines
            name = self.model.filePath(idx)
            c = createContainerFromFile(name)
            fstr = ""
            c = applyFilters(c, fstr)
            self.hex.setData(c)
            # end
 
 
ctx = proContext()
w = MixedWidget()
v = ctx.createViewFromWidget(w)
ctx.addView(v)

With just three of the modified lines we are xoring all opened files with the value 0xCC and then show the resulting data in the hex view. The Profiler provides a huge number of filters for any kind of operation and they can be chained, so we could easily compress and then encrypt a file with AES by just replacing one line in the sample above. The function applyFilters displays an optional default wait dialog to the user to interrupt the operation (if it is executing in the main thread). Please remember that the easiest way to obtain the needed filters XML string is to use the UI view and use the export command from the list (context menu->Export…).

NTBuffer generates an exception when a read operations fail. Thus, it should be used as follows:

ctx = proContext()
v = ctx.getCurrentView()
d = v.getData()
b = NTContainerBuffer(d, ENDIANNESS_LITTLE, 0)
print(str(hex(b.u8())))
try:
    b.read(10) # or b.u8(), b.u16(), etc.
except IndexError as e:
    print(str(e))

A small snippet to show how to use NTXml:

x = NTXml()
ret = x.parse("")
if ret == NTXml_ErrNone:
    n = x.findChild(None, "r")
    if n != None:
        n = x.findChild(n, "e")
        if n != None:
            a = x.findAttribute(n, "t")
            if a != None:
                print(x.value(a))

Along with the core, several of the file objects will be exposed. A text dump of a structure could be as easy as:

c = createContainerFromFile(fname)
pe = PEObject()
pe.Load(c)
out = NTTextStringBuffer()
pe.DosHeader().Dump(out) # CFFStruct::Dump
print(out.buffer)

Please notice that the code above misses several checks. We need to make sure that c is valid and Load succeds. I’ll omit these checks here to keep the code minimal.

You might say that printing out a single structure is an easy task. So let’s take a look at another cooler sample:

c = createContainerFromFile(fname)
pe = PEObject()
pe.Load(c)
out = NTTextStringBuffer()
tables = pe.MDTables("#~") # 'tables' references all .NET metadata tables
pe.DisassembleMSIL(out, 0x06000001) # .NET token (MethodDef | index)
print(out.buffer)

These few lines output an entire .NET method such as:

private static void Main(string [] args)
{
 locals: int local_0,
         int local_1

 ldc_i4_2
 stloc_0 // int local_0
 ldloc_0 // int local_0
 stloc_1 // int local_1
 ldloc_1 // int local_1
 ldc_i4_1
 sub
 switch
  goto loc_22
  goto loc_60
 br_s loc_71
loc_22:
 try
 {
  ldstr "h"
  call System.Console::WriteLine(string) // returns void
  leave_s loc_81
 }
 catch (System.ArgumentNullException)
 {
  pop
  ldstr "null"
  call System.Console::WriteLine(string) // returns void
  leave_s loc_81
 }
 catch (System.ArgumentException)
 {
  pop
  ldstr "error"
  call System.Console::WriteLine(string) // returns void
  leave_s loc_81
 }
loc_60:
 ldstr "k"
 call System.Console::WriteLine(string) // returns void
 ret
loc_71:
 ldstr "c"
 call System.Console::WriteLine(string) // returns void
loc_81:
 ret
}

Nice, isn’t it? Remember we can change the indentation programmatically.

Of course, it will also be possible to get the object currently being analyzed and similar stuff. But we’ll see how to do that in another post.

If you’re wondering why the case convention for methods is not always the same, the reason is simple. CFFObject/CFFStruct/etc are based on older code which followed the Win32-like convention. Consequently all derived classes like PEObject follow this convention. All other classes use the camel-case convention.

News for version 0.9.2

The new version of the Profiler is out with the following news:

removed virtual memory constraint: large files are now supported
added decompression bomb detection
added media preview for image files
added preview for several PE resources
added text preview for Office Word Documents
added format selection to open file dialog
display format choose dialog when more than one format has been detected
added XFA interactive forms detection inside PDFs
added from/to hex and base64 filters
automatically detect files in Zip archives missing a Central Directory
increased PySide integration
– fixed Office VBA extraction bug
– fixed bug in PDF V4 and V5 Revision encryption

Format detection & selection

To better help with the identification of files which can be interpreted as different formats, the individual file dialog features now some additions.

As you can see the identified formats for the currently selected file are listed (it’s a simple GIF file with a PDF appended at the end). The dialog gives the user also the ability to manually choose the format to use for loading the file. While all this could be achieved even before, it wasn’t as handy as it is now.

However, it wouldn’t make sense to display the file selection dialog when the user uses the shell integration or drops a file to open it. So, instead the Profiler displays a choice dialog for the format in case multiple formats are detected.

Conversion filters

Some new filters are available: from/to hex/base64.

While the actions in the Profiler already feautured a mechanism to do these conversions, having them as filters is extremely useful, because it allows to use them to load embedded files or to convert large portions of data.

Damaged Zip archives

While it has always been possible to manually extract through filters data or partial data from damaged Zip files (e.g. those missing a Central Directory), now the embedded data is automatically analyzed and ready for inspection. This means that even when a Zip archive is truncated and some compressed files are truncated as well, they will nonetheless be automatically detected and be available for inspection by the user.

As you can see many improvements have been introduced. The most important of them is of course the removal of the virtual memory constraints as it represents an important step in the roadmap of the Profiler. Stay tuned as the next version will be important as well!

XFA Interactive Form Inspection

The upcoming 0.9.2 version of the Profiler introduces detection of Acro/XFA interactive forms inside PDFs. This technology has been abused numerous times (some recent cases come to mind), so it is now being reported as a potential threat.

The video below shows the inspection of a XFA Interactive Form and how to load a base64-encoded GIF image embedded in it.

Stay tuned!

Previews

The upcoming version 0.9.2 of the Profiler adds previews for various things: images (all supported formats), several Portable Executable resources and Office Word Documents (text-only).

PE resources preview

Since media elements are rendered through third-party code, the Profiler displays a warning box before actually rendering a media element.

Preview warning

The ‘Allow all’ button allows media elements for the current session only. If the Profiler is running in a safe environment (like a VM), the user can decide to permanently disable the warning box and allow all media elements.

Preview settings

Last but not least, text-only preview of Office Word Documents has been introduced. This allows users to safely inspect the text content of a document without processing the file with an official viewer which could be the target of exploits.

Office document preview

While there are already enough new features to release, some smaller additions will be squeezed into 0.9.2 during the next days. Stay tuned!

Zip bomb revisited

The upcoming 0.9.2 release of the Profiler removes the virtual memory constraint, meaning that it is now able to open and process files of any size (the hex editor can edit large files as well). This feature has actually been in the TODO list from day 1 and I’ll write about the internals of it in some other post, in order to better demonstrate the capabilities gained by these changes to the core.

Also, because of the increased functionality, it made sense to add detection for Zip (decompression) bombs. Almost a year ago we’ve talked about Zip bombs, but it was limited to the safe exploration of such files. Let’s start with the new ‘Limits’ page in the setup.

Limits

  • What had been once the maximum size of a file is now the size of virtual memory the memory pool is allowed to use. Of course, the more virtual memory is granted, the faster it becomes to analyze large files. But it’s only a matter of speed, you can choose to give to the pool the bare minimum, it’ll work just as well.
  • The nesting option shouldn’t need any explanation since it hasn’t changed. But just for completeness: it specifies the maximum level of scanning into a root object. If more levels are available, it is signaled. For instance, level 0 specifies that children objects should not be scanned automatically (though they might still be opened manually by the user).
  • The maximum file size can be used to discard files larger than the specified size during batch scan operations. The default is 0, which stands for infinite.
  • The decompression bomb threshold is the limit we’re interested in for this post. It represents a cumulative size which can’t be exceeded. In other words if an archive contains 1 file of 100+ GBs (let’s use this number for the purpose of this example) it’s the same as whether one sub-archive contains 100 files of 1 GB each (plus a single byte in excess). If the threshold is exceeded, it will be reported as a threat. While 100 GBs is the default, you can speed up scanning by specifying a lower limit.
  • The maximum number of children files is cumulative as well. This constraint depends on virtual memory limitations (as all children are shown in a tree). 100.000 (the default) is a safe choice. If more children than the imposed limit are present, it is signaled.

So let’s again take the famous 42.zip as an example of Zip bomb and let’s scan it. We’ll get this in the summary:

Decompression bomb threat

Please note that the threat may not be reported in the summary of the root object itself, but in one of its children objects (once the bomb threshold has indeed been exceeded). But since we know there’s a threat (as reported by the risk factor) we can just jump to it by pressing F2 in the hierarchy view.

Widgets and Views

The last release of the Profiler featured some significant improvements. So while it also included initial PySide support, there wasn’t much time to make it really nice. One of the missing things was the ability to mix internal Profiler views (such as the hex editor) with PySide widgets. With the upcoming 0.9.2 release it will be possible to create a view and obtain a PySide widget with just one method:

widget = view.toWidget()

This way one can make use of advanced internal views of the Profiler and combine them with other custom controls. Let’s see a practical example.

Mixed widget

The widget in the screenshot combines a QTreeView with a directory model and a hex view. When a file is activated in the tree, it is opened by the hex editor. To try it out, just press Ctrl+Alt+R and enter the following code:

from Pro import *
from PySide import QtCore, QtGui

class MixedWidget(QtGui.QSplitter):
    def __init__(self, parent=None):
        super(MixedWidget, self).__init__(parent)

        self.setWindowTitle("Mixed widget")
        self.setOrientation(QtCore.Qt.Vertical)

        self.model = QtGui.QDirModel()
        tree = QtGui.QTreeView()
        tree.setModel(self.model)
        self.addWidget(tree)

        ctx = proContext()
        self.hex = ctx.createView(ProView.Type_Hex, "")
        self.addWidget(self.hex.toWidget())

        tree.activated.connect(self.updateFile)

    def updateFile(self, idx):
        if self.model.isDir(idx) == True:
            self.hex.clear()
        else:
            name = self.model.filePath(idx)
            self.hex.setFileName(name)


ctx = proContext()
w = MixedWidget()
v = ctx.createViewFromWidget(w)
ctx.addView(v)

Amazingly little code snippet, right? Please note that the ProHexView setFileName method is also a new addition to the SDK.

News for version 0.9.1

The new version of the Profiler is out with the following news:

added capability of opening multiple analysis views
added capability of switching root object in the workspace
added navigation in analysis views
added bookmarks
added PySide integration
– added user application data folder support
– added history for the Python command line and script dialog
– added save option to the keys input dialog
– improved notes: the toolbar now signals their presence
– updated Qt to 4.8.4

Also a new Demo version has been released, which as usual can be found on the product page.

UI Improvements & Bookmarks

The upcoming 0.9.1 version of the Profiler features some important UI improvements and the introduction of bookmarks. Among the UI improvements there’s:

  • the ability to switch root in the workspace
  • multiple analysis views displaying data of different roots
  • navigation

In this case a video is probably more worth than a thousand words.

These new features lay down the groundwork for some more interesting capabilities which will be added soon. Stay tuned! 🙂

PySide support

This is really a small addition which took just a couple of hours of work, but since it can come very handy, it’s worth dedicating a post to it. The upcoming 0.9.1 version of the Profiler adds explicit support for PySide. Thus, it will be possible to create Qt widgets and add them to the workspace.

Installing PySide

First of all, let’s install PySide. There are 3 ways to do this.

1) Install it from the qt-project page.

Make sure you select the package matching the current Python version used by the Profiler.

2) Install the package we compiled for you. It’s vanilla, directly from the original sources, but it has the advantage that it is guaranteed to work. In fact, at the time of writing the official package contains a bug (missing shiboken Python module) and so the first one is not really an option until it is not fixed.

Download
SHA1: 2024348E79890A167BB231098A6A16FC8BB02C9E

3) You can compile PySide yourself following the instructions at qt-project. At the end, use the installer created inside ‘c:\pyside-setup\dist’.

A code sample

Using it is even easier than the setup process. Basically ProContext has a new method called createViewFromWidget which takes as a parameter a widget created by PySide and returns a ProView which in turn can be added to the workspace.

Adding a widget to the workspace only takes the following line:

ctx.addView(ctx.createViewFromWidget(widget))

Therefore using an existing widget and adding it to the workspace is very easy. Let’s see a real-world widget like an official PySide sample: PySide/examples/effects/lighting.py. It’s sufficient to remove:

if __name__ == '__main__':

    import sys

    app = QtGui.QApplication(sys.argv)

    lighting = Lighting()
    lighting.setWindowTitle("Lighting and Shadows")
    lighting.resize(640, 480)
    lighting.show()

    sys.exit(app.exec_())

And add:

lighting = Lighting()
lighting.setWindowTitle("PySide widget")

ctx = proContext()
ctx.addView(ctx.createViewFromWidget(lighting))

Now we can add an action to execute the code or just insert it in the custom script box (Ctrl+Alt+R) and the view will be shown like this:

To set a custom icon for the view use setWindowIcon.

As usual stay tuned as the upcoming version is going to include some major additions and significant changes.