We’d like to wish everybody merry Christmas and a happy new year!
We’re just in time to place under the Christmas tree a new version of the Profiler with the following news:
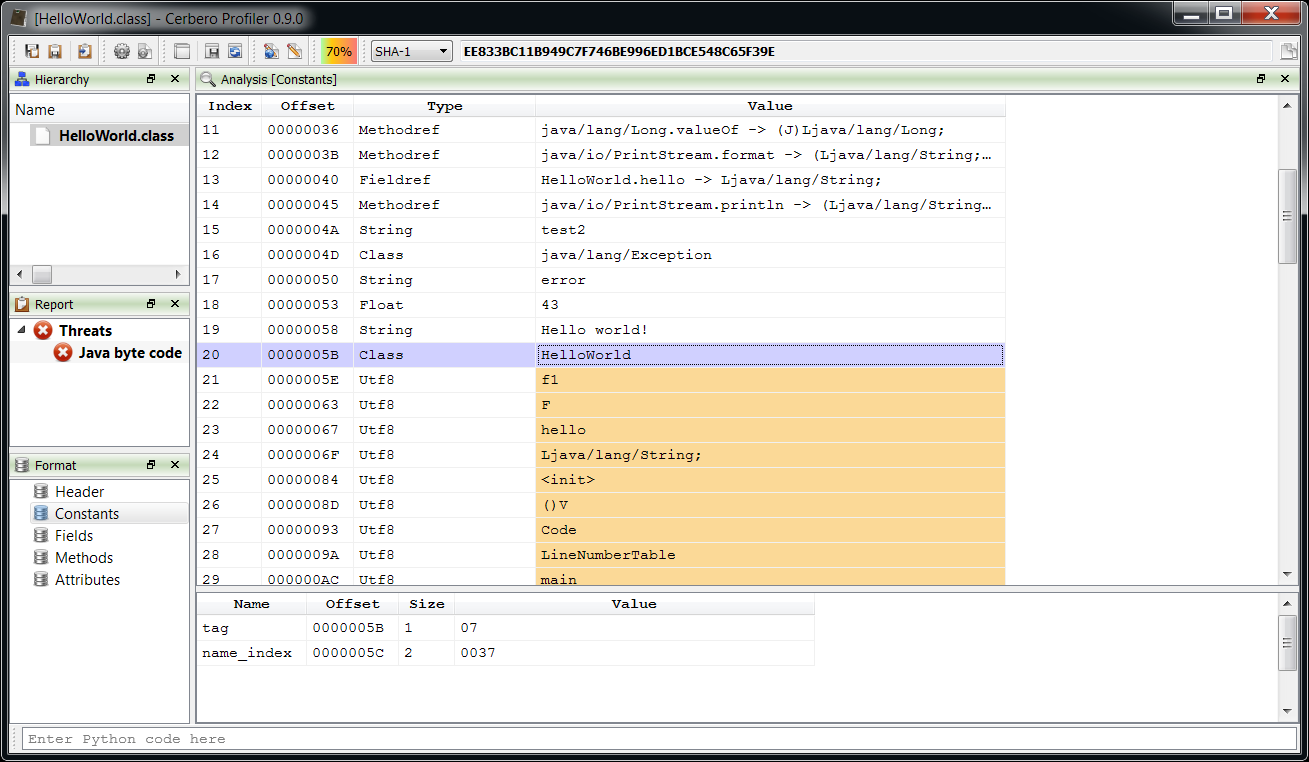
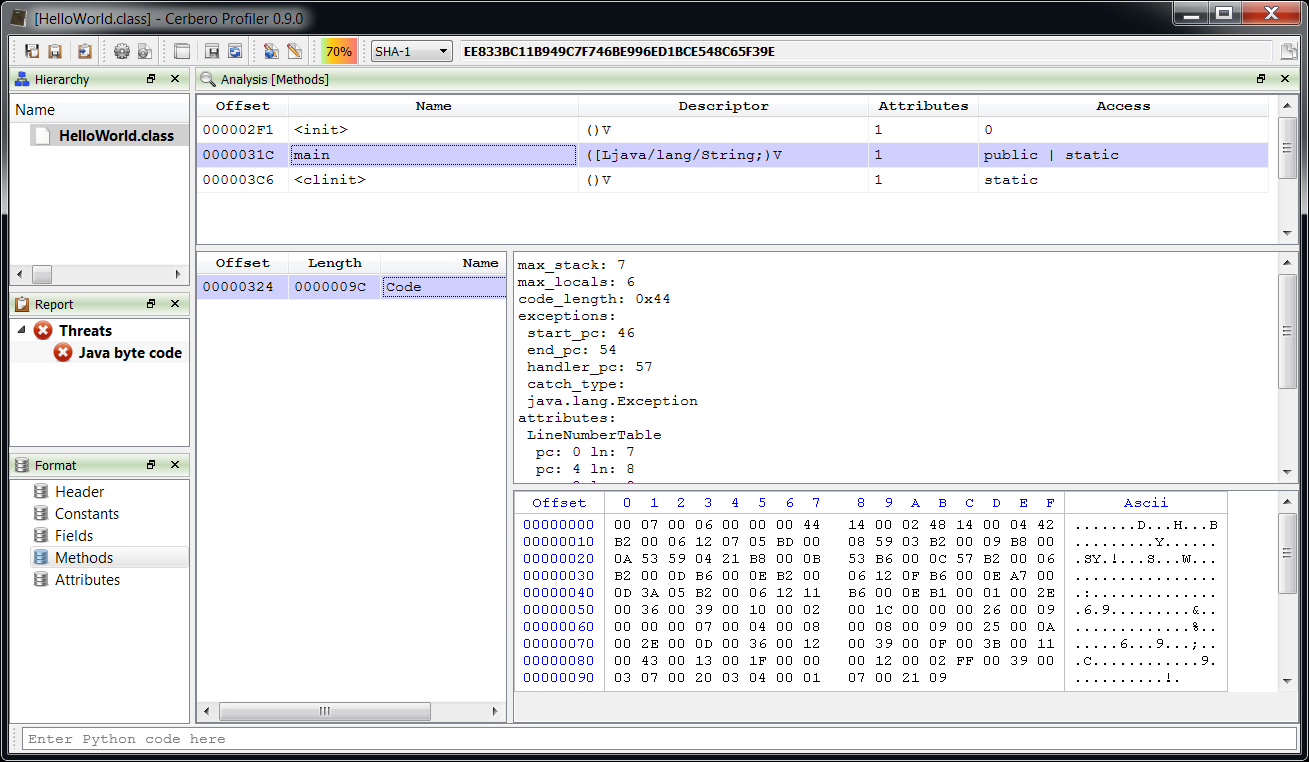
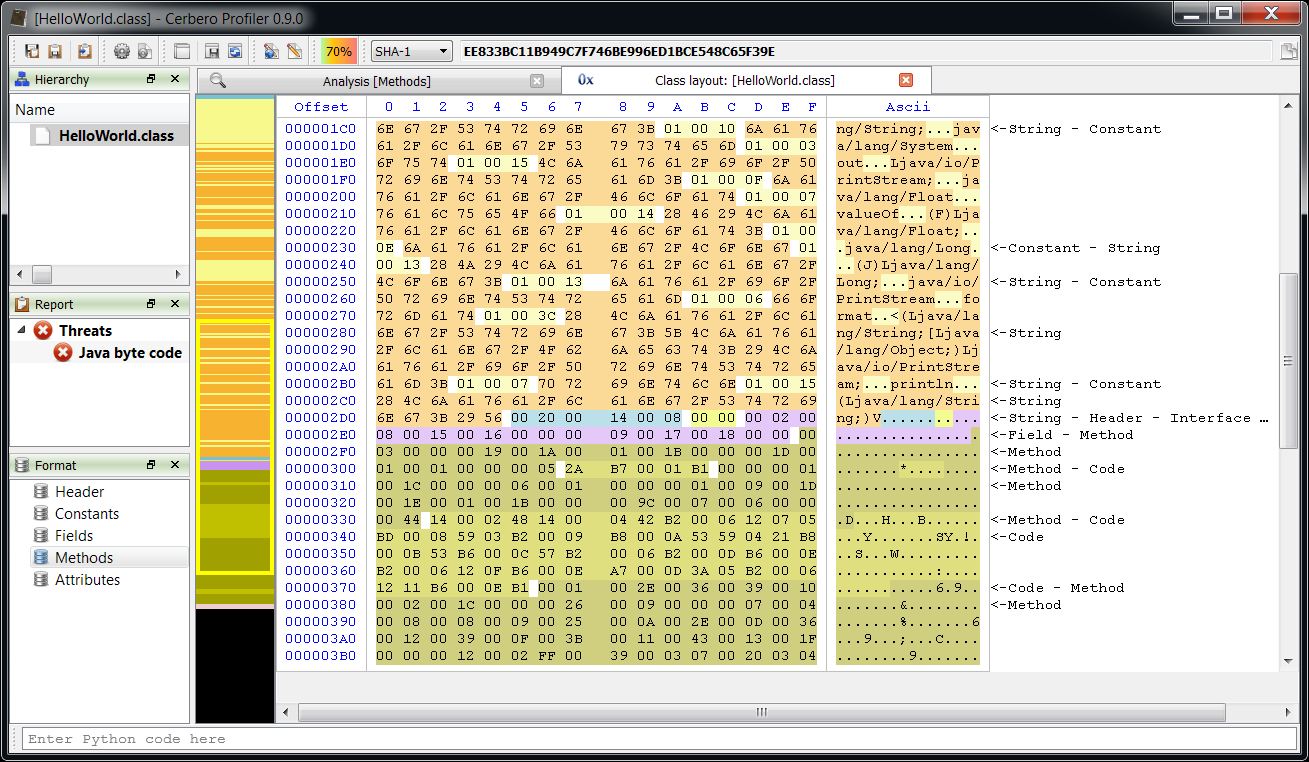
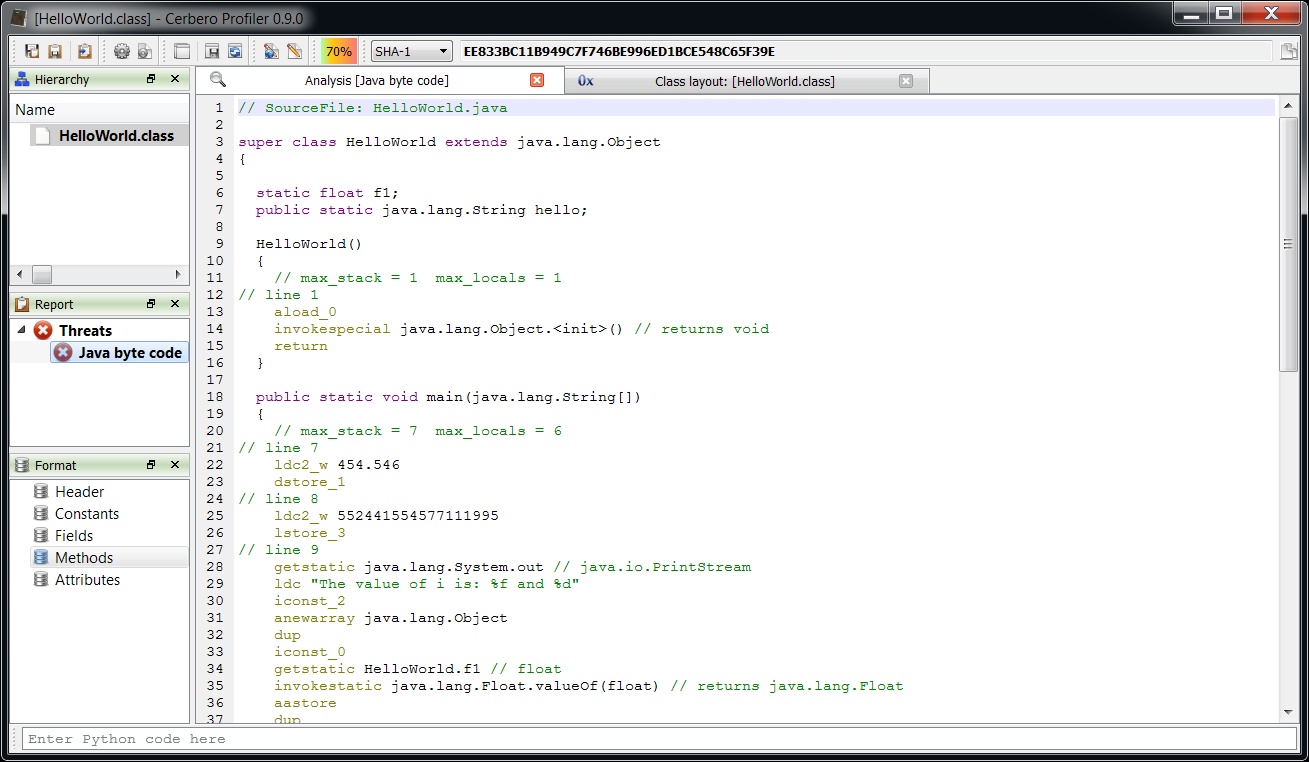
– added Java Class support including byte code disassembler and layout ranges
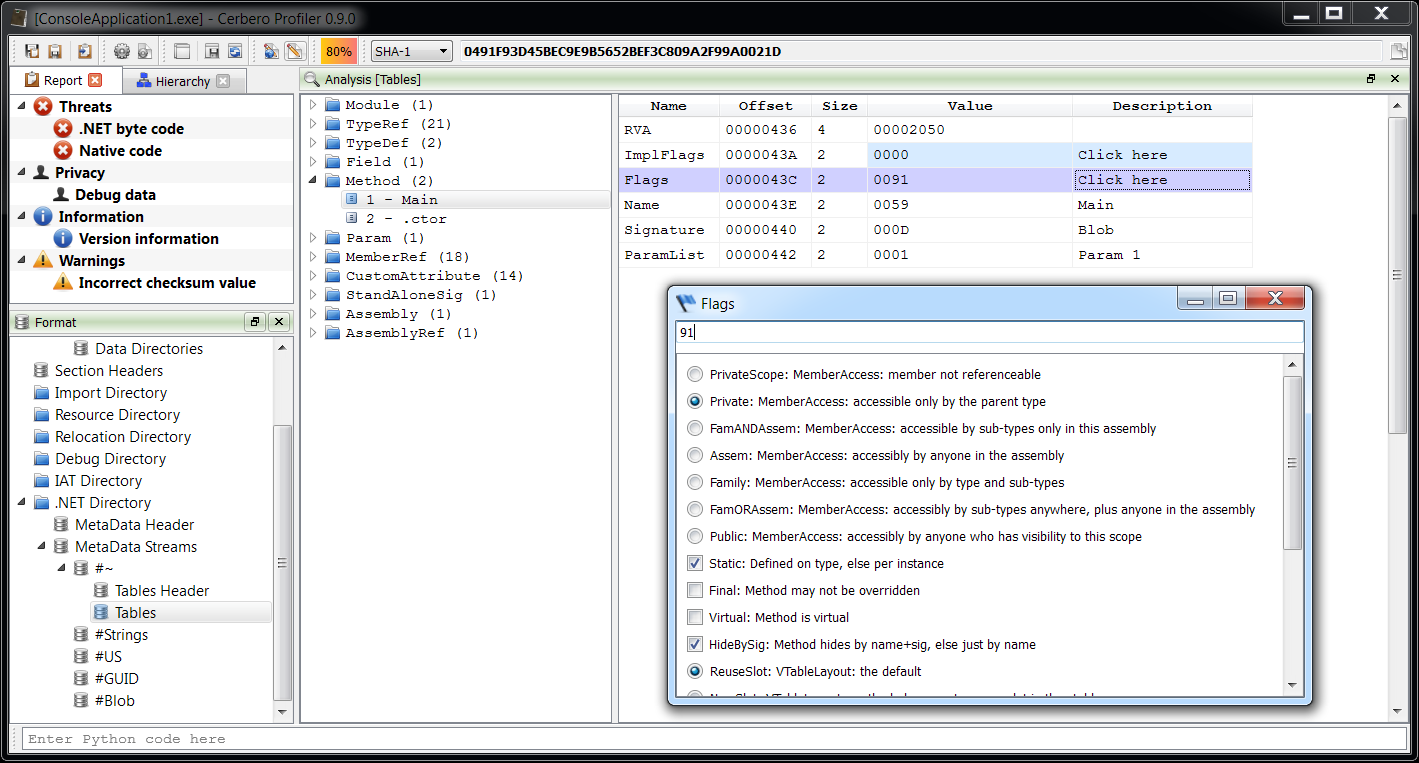
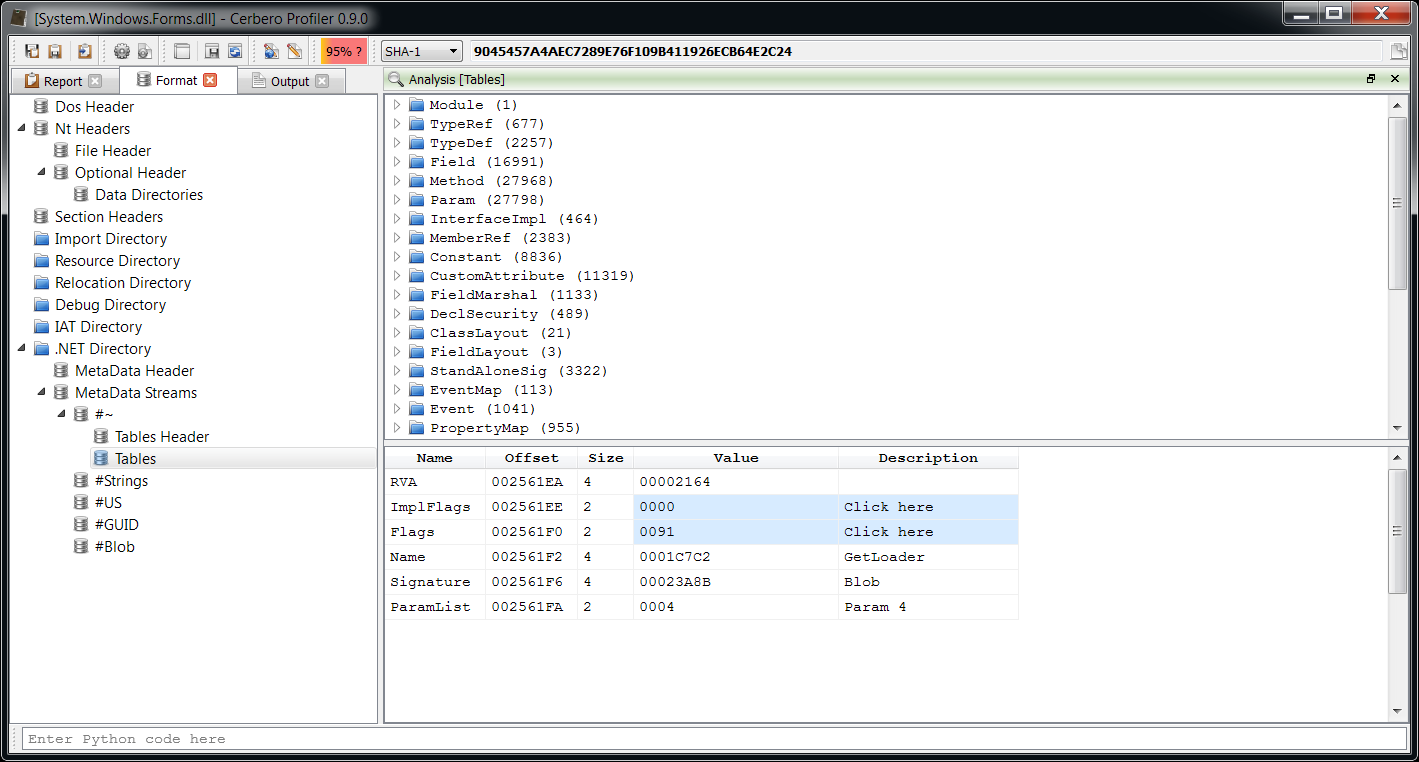
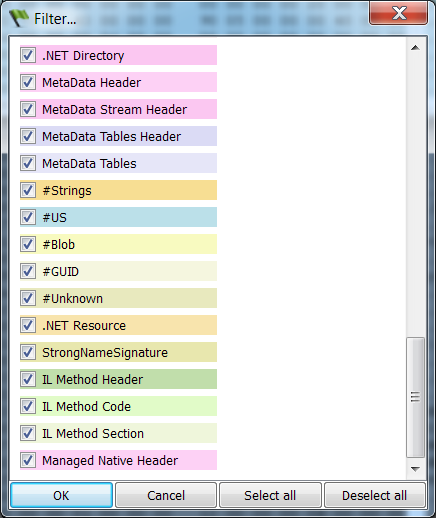
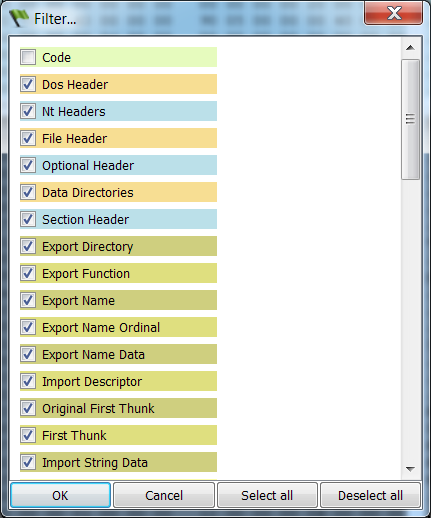
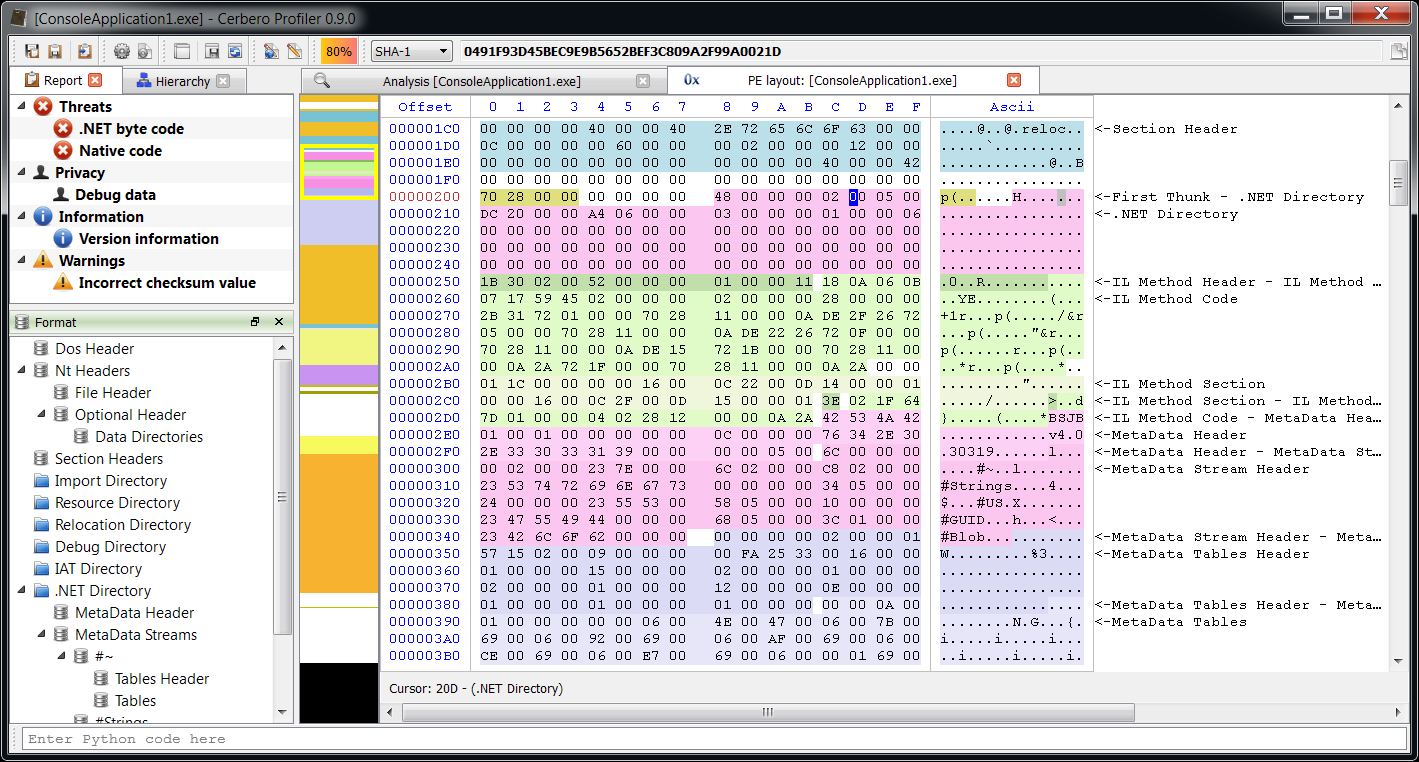
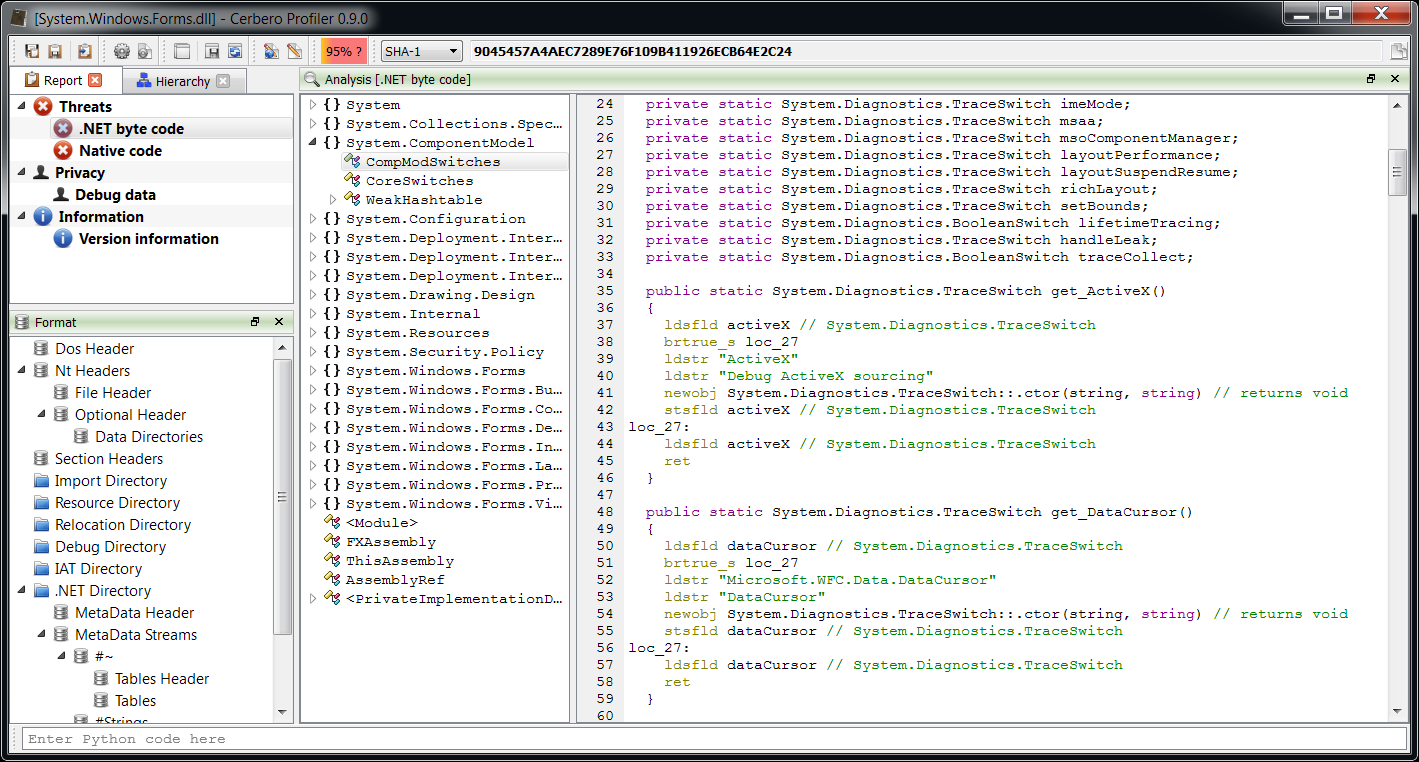
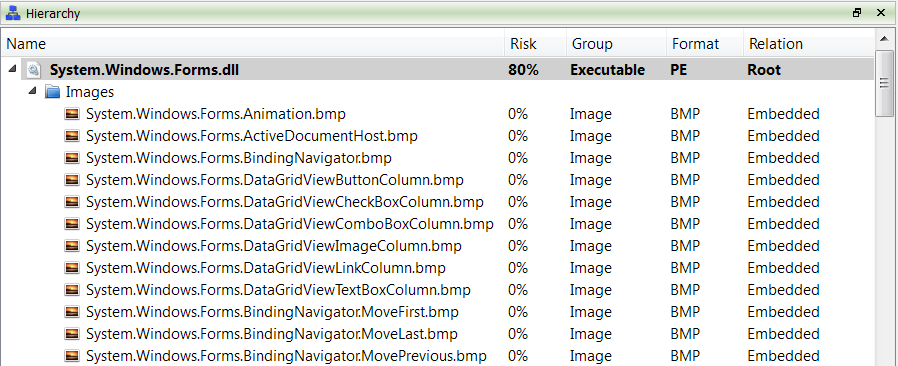
– added .NET support including byte code disassembler and layout ranges
– added DEX support including byte code disassembler and layout ranges
– added dedicated view to display data like raw PDF objects
– added PE MUI resources validation
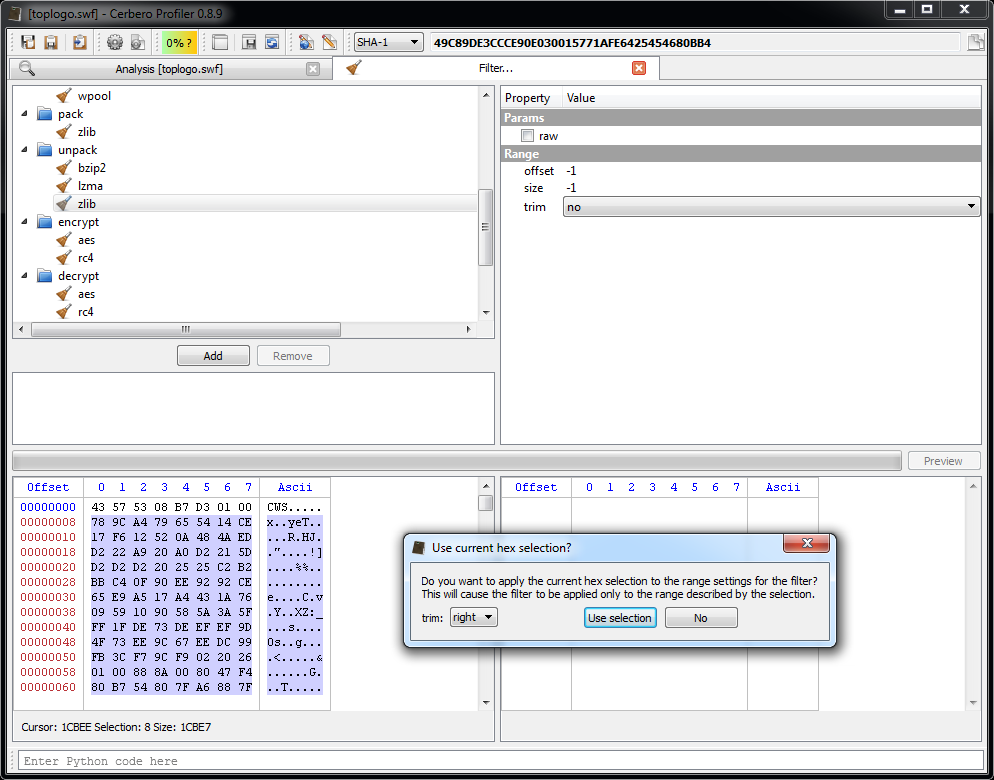
– added Adler32 to filters
– updated jsbeautifier
– separated malicious threats from intrinsic ones in the report view
– fixed update with unprivileged user account on Windows
– fixed several bugs
The main addition in this new release as seen previously is the managed trio Java, DEX and .NET.
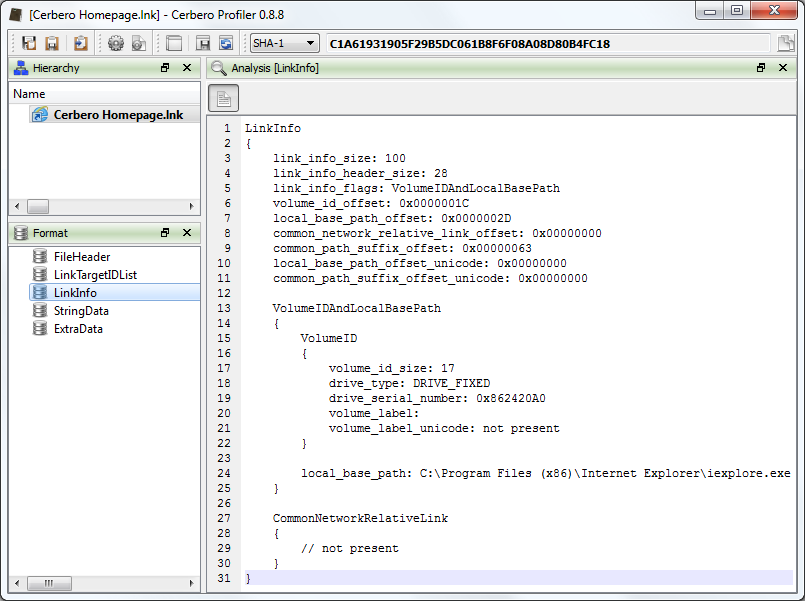
Dedicated view to display raw data
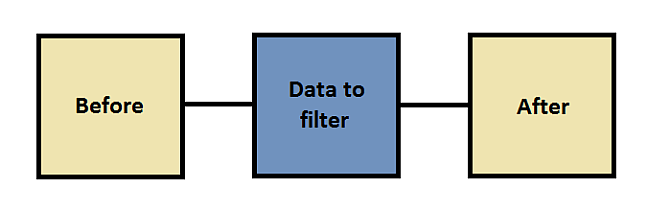
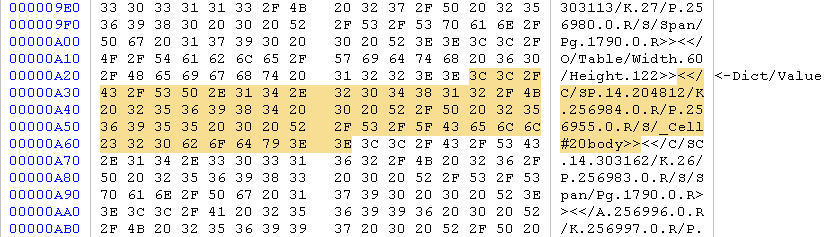
Previously PDFs had 3 views to display objects: one for the dictionary, one for the decoded stream and one for the decoded stream shown as text. Now there’s also a ‘raw data’ view to show the object unmodified just as it is in the file.
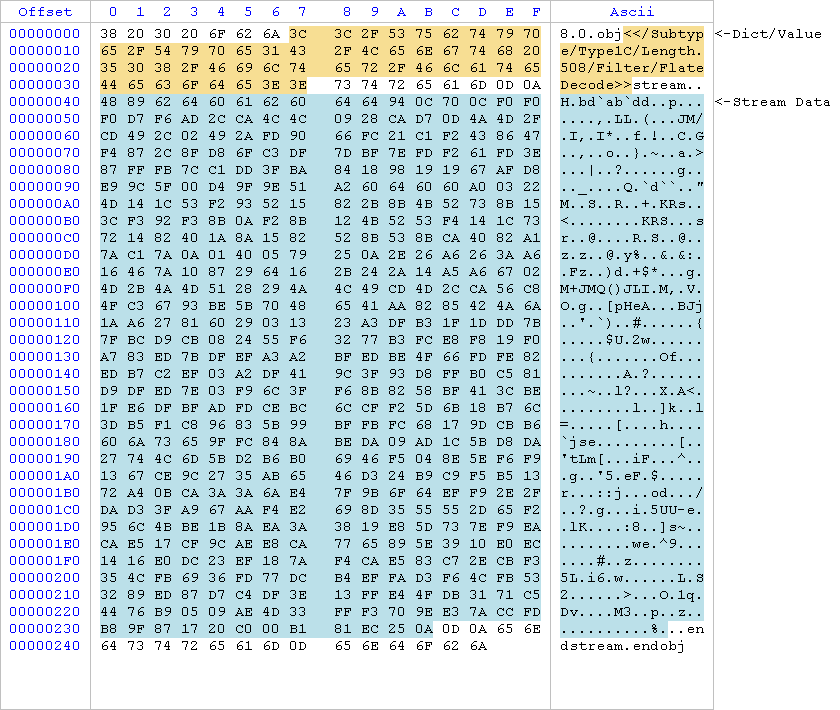
Highlighted with different colors you can see the dictionary/value and the stream part. The same applies to child objects which are highlighted in the stream of their parent.
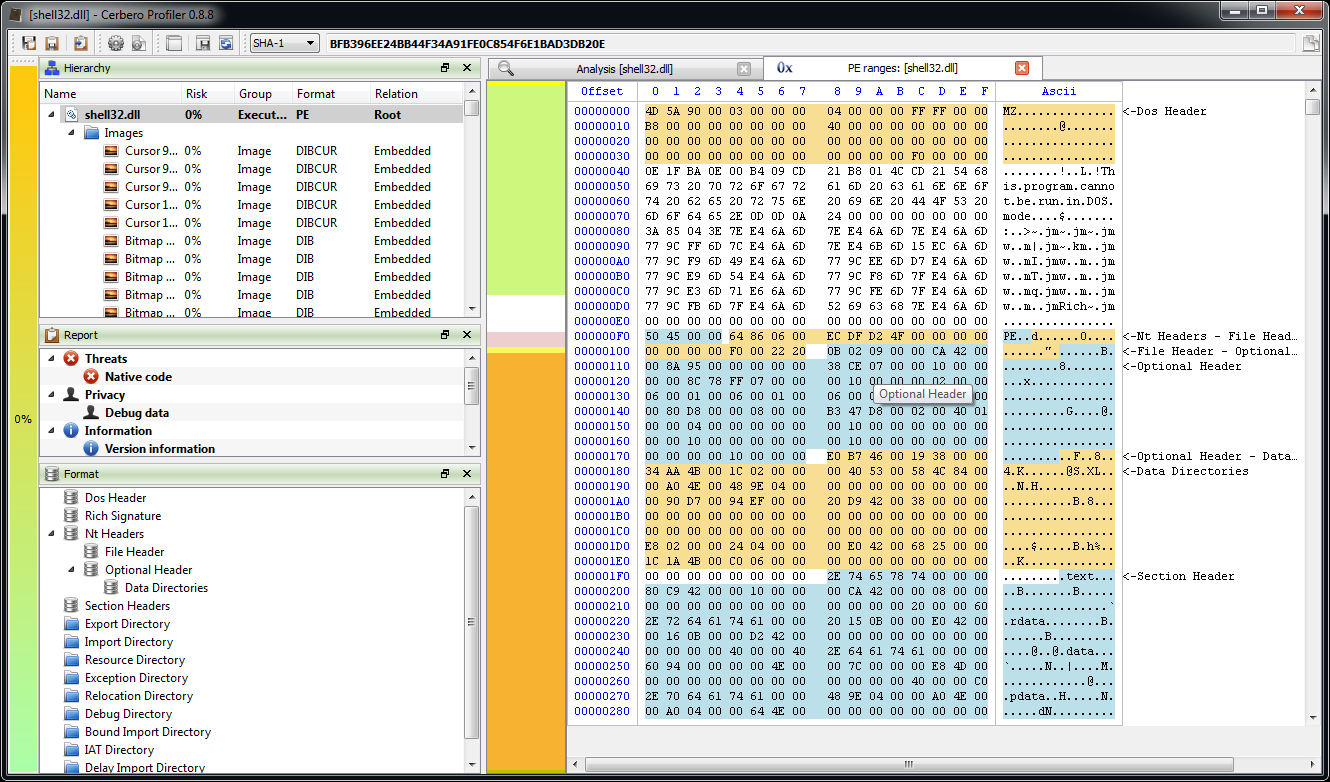
PE MUI resources validation
Following a short post about MUI resources, validation for them has been added. Also some bug fixes related to resource validation.
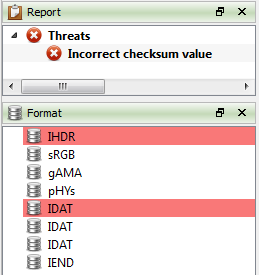
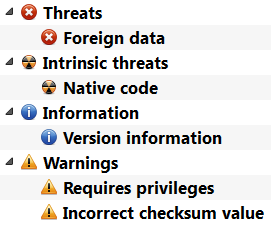
Separated malicious threats from intrinsic ones
In order to better separate intrinsic risk factors from malicious threats, they are now shown separately in the report view.
Have some nice holidays and stay tuned as we’ll try to add even more features the upcoming year.
Christmas hat image from freevector.com