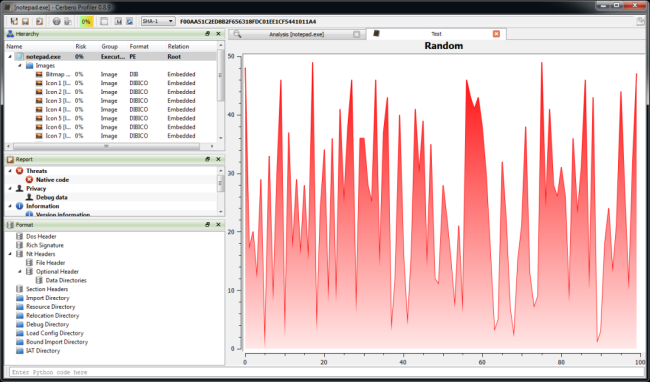
The upcoming 0.8.9 release of the Profiler improves integration with Python and the SDK exposes new functionality. Moreover, it lays down the groundwork needed to expand the SDK in the next releases. Documentation of the SDK has been included in the docs directory and also a Python command line has been added to the workspace.
To offer a glimpse of the capabilities here is a small code snippet to create a custom plot which could be used, for instance, to display entropy.
import random

ctx = proContext()
v = ctx.createView(ProView.Type_Plot, "Test")
v.setPlotTitle("Random")
v.setAxisScale(ProPlotView.xBottom, 0, 100)
v.setAxisScale(ProPlotView.yLeft, 0, 50)
x = NTDoubleVector()
y = NTDoubleVector()
i = 0
while i < 100:
    x.append(i)
    y.append(random.randrange(50))
    i = i + 1
v.addCurve(x, y)
ctx.addView(v)
And the screenshot of the created plot.
While this doesn't sound too exciting at first, the on-going SDK expansion will allow to do some very interesting things. Stay tuned as some more technical posts are coming.
