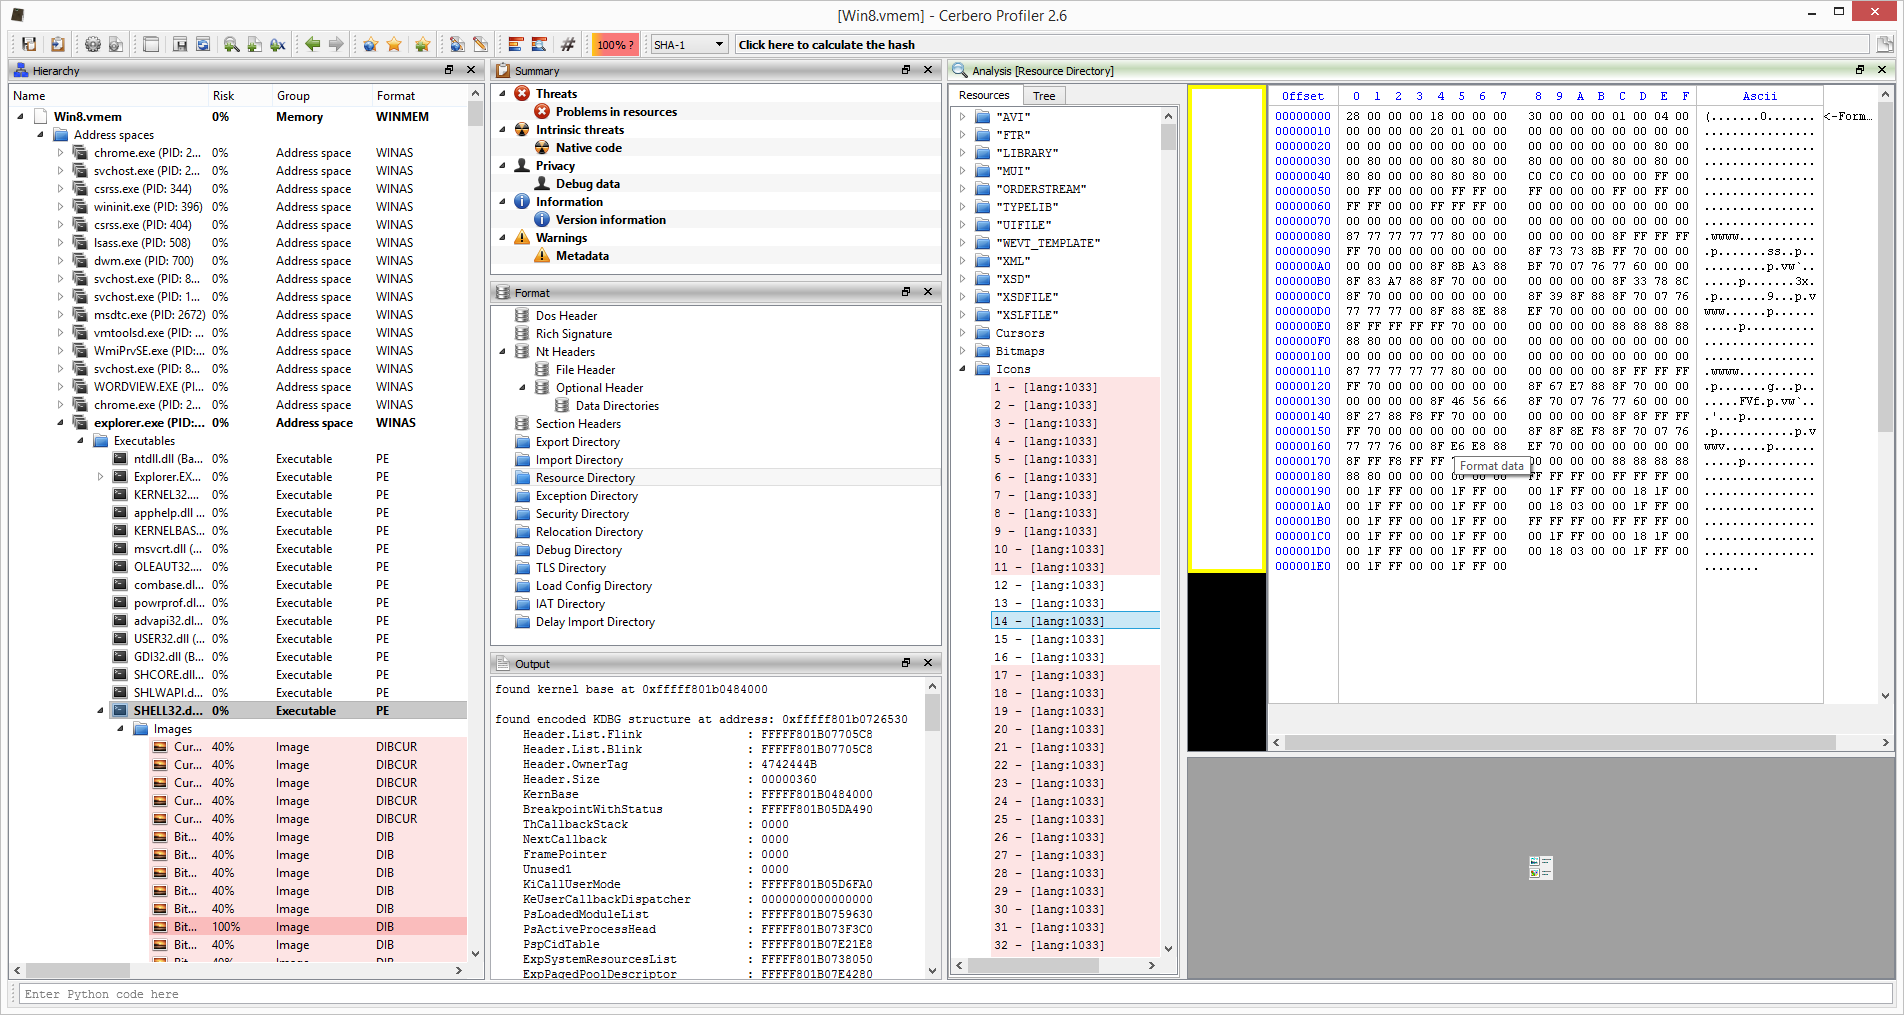
Let’s begin with an image:
Yep. That’s an icon. In an executable. In a process address space. In a raw memory dump.
And here is the video demonstration:
This is just a proof-of-concept. We still haven’t decided whether to develop this further. It really depends on whether the forensic community is interested in having such a product. So, even a re-tweet will have an impact on our decision. 🙂 We wanted to show what is currently possible and, of course, it’s not the end of the cool things which are possible.
In case we decide to go ahead with the development, we will probably create a beta-test group of potential customers and decide with them a roadmap for a 1.0 version, taking into consideration all those features which are essential to them. What we already support are the Windows versions that go from XP to 10 on the following architectures: x86, x86-PAE, x64. And, of course, the software itself, just like Profiler, runs on Windows, OS X and Linux.
And now to the more technical side if you’re interested. What we have shown in this demonstration is just a Python extension for Profiler. To be more specific, it’s only about 1000 lines of Python code and this includes all the UI views. The bulk of the work went into exposing all the necessary capabilities of our SDK to Python. Of course, all this work also benefits other extensions, not just the memory forensics ones. So, if this project ends with this post, it’s really not a tragedy, as we haven’t lost any significant time developing specific stuff for it.
So why did we choose to write our memory forensics support in Python, rather than in C++, which would’ve taken us a lot less time? The reasons are several. The memory forensic field is always changing rapidly and setting code in stone by compiling it wouldn’t be a good idea. Also, we wanted to give our customers the possibility to inspect the code and to modify it. Just by looking at existing code it’s extremely easy to write new utilities. While on the other hand, having our core engine and UI written in C++, makes our tool very fast. We think this is the perfect combination.
If you’re wondering why we didn’t use Volatility as a backbone, the answer is that it would’ve been incompatible on a licensing level and way too difficult to fit nicely into our existing framework to accomplish what we wanted to do.
We hope you enjoyed the demo and we would be happy to receive your feedback!

wow it’s a killer feature! please dev it further
Good stuff. It is impressive that this is done in Python as a CPro extension! 🙂
Thank you! 😉