Profiler 0.8.7 Demo

The upcoming version 0.8.8 of the Profiler is feature-packed (so stay tuned). In the meanwhile we found some time to prepare a new evaluation version based on the previous 0.8.7 version.

SHA1: EB208B9CB9FB3B7ADAE5A0FD24C4AA08E591752F

This new demo version is no longer subject to the DOC only limitation, which means it is able to open every CFBF file (including XLS and PPT files).

Please note that this new demo is subject to the following limitations:

  • only CFBF files are supported
  • embedded and referenced files can’t be inspected
  • only single file analysis is available
  • although the action system is working, some actions are not available
  • filters are not available

Enjoy!

An introduction to Filters

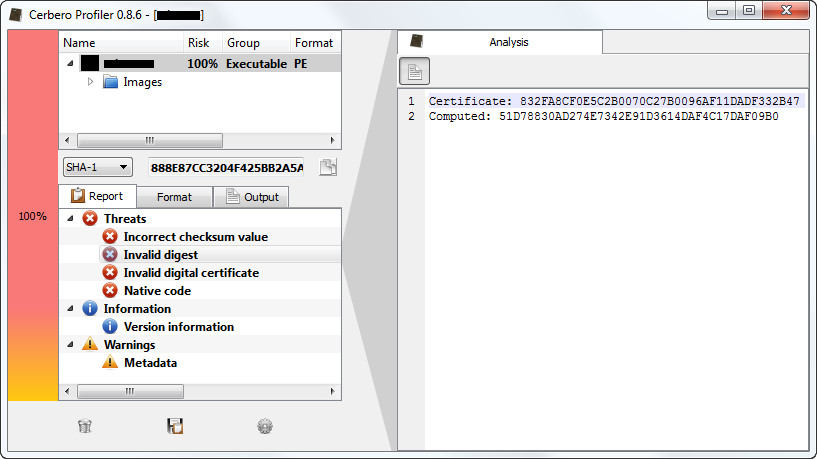
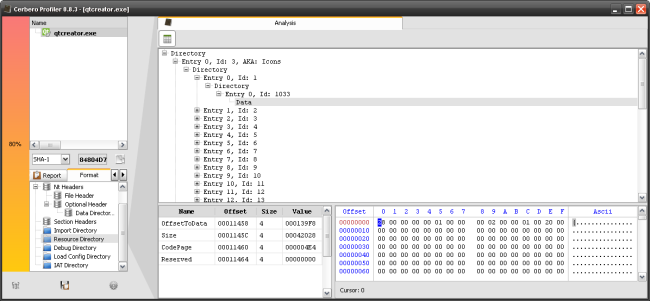
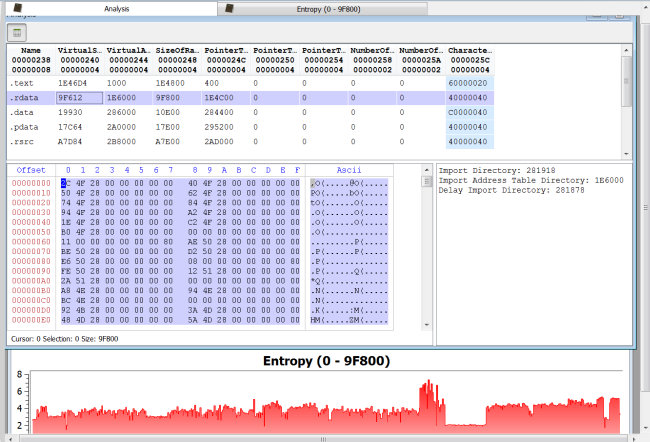
While filters have always been a part of the Profiler, they are now partly exposed only with the upcoming 0.8.7 version. Shortly explained: filters are algorithms of different nature which can be applied to portions of data. The starting point to interact with filters is the filter view. This view is triggered with the Ctrl+T shortcut. Let’s start with some step by step screenshots.

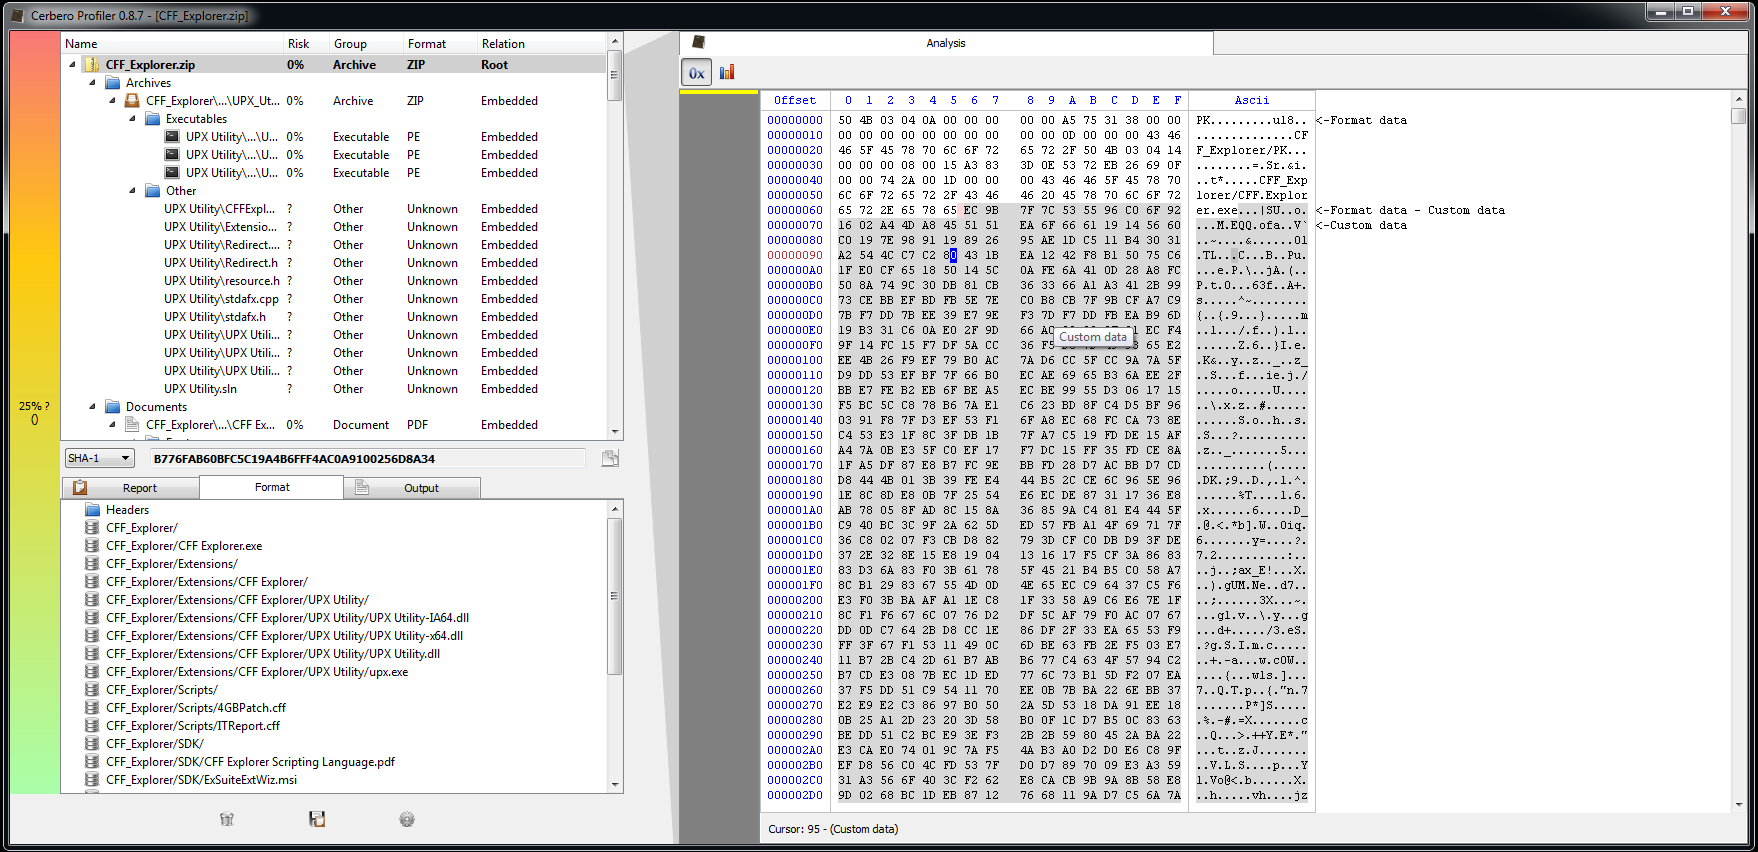
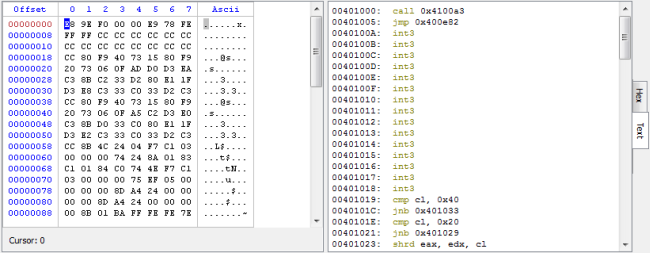
This is a Zip file and the gray area marks a compressed file. Let’s select this area with Ctrl+Alt+A.

Zipped file

Now let’s press Ctrl+T and take a look at the filter view.

Filter View

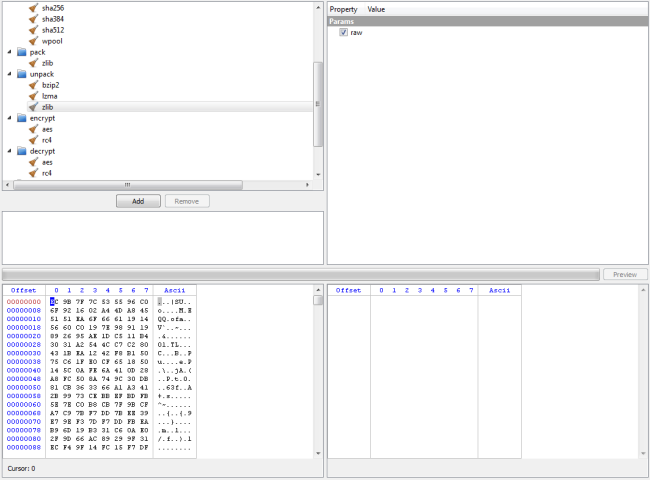
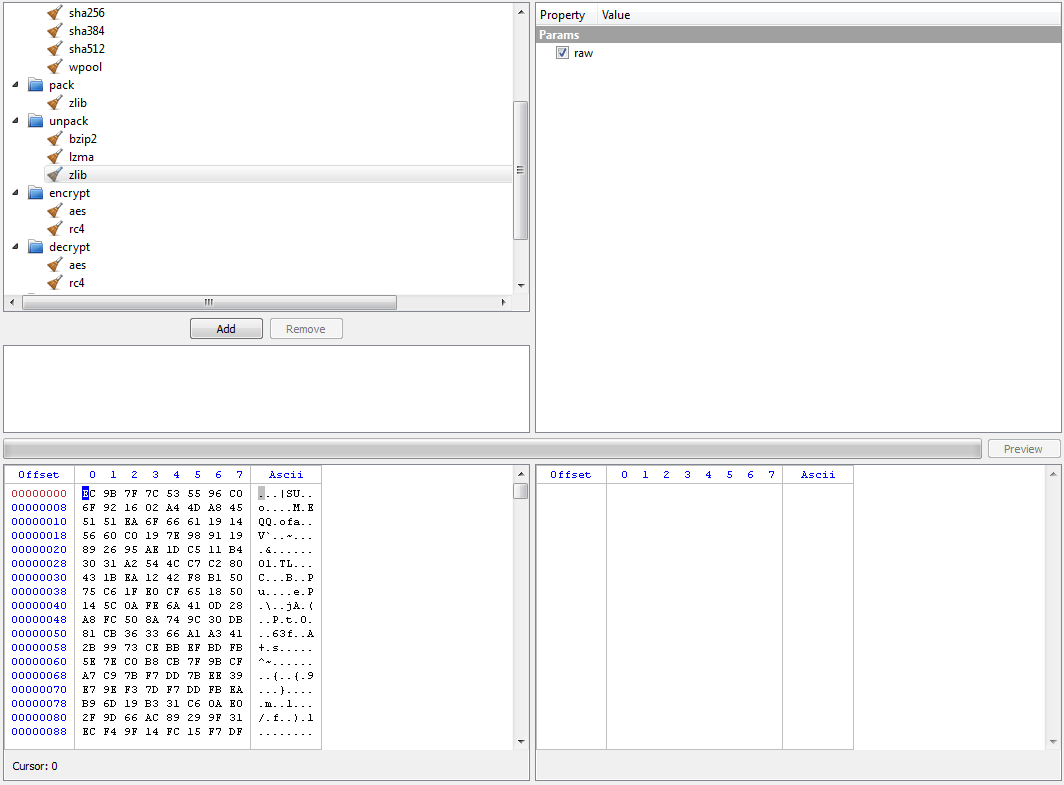
The tree at the top-left displays the available filters. The property editor next to it contains the available parameters for the currently selected filter and the list beneath the filters is the stack of filters which need to be applied to the input data. The hex view on the left contains the data which we have previously selected in the hex view (meaning the compressed file) and represents the input data.

Now if we want to decompress the data, let’s add the unpack/zlib filter (with the raw parameter checked) to the stack by clicking on “Add”.

Filter stack

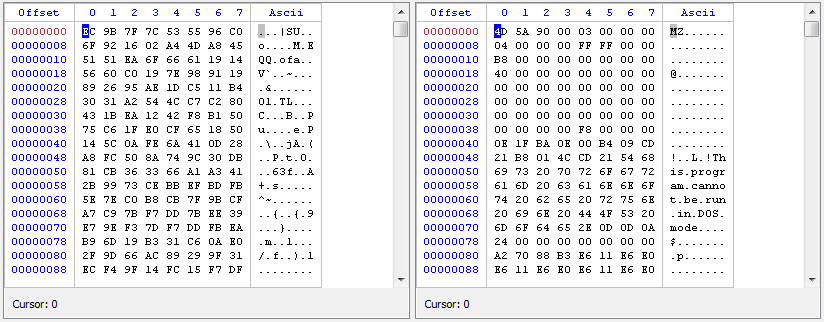
And at this point we can click on the “Preview” button.

Unzipped file

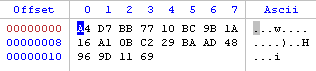
But what if we want to retrieve the SHA1 of the decompressed data? Just add the hash/sha1 filter to the stack.

Filter stack

This time we’ll have only the SHA1 hash in the output view.

SHA1

The filter stack can be imported and exported. Just right-click inside the stack list. The exported filters of the current stack will look like this:

If we had opened the filter view without a selection we would have had an editable hex view on the left, which we could fill with our custom data. Also, the hex views in the filter view have all the benefits of a regular hex view (that is if the filter view is not triggered while loading a file, as we’ll see later); this means that it’s possible to trigger a new filter view by selecting something in the hex view containing the filtered output data.

What I’ve showed until now isn’t an every-day task, but it serves the purpose of introducing the topic. We’ll see some real-word cases after I have introduced the misc/basic filter. But before of that let me shortly mention text output filters.

Right now the Profiler features two filters with text output: disasm/x86 and disasm/x64. When a filter outputs text, we’ll be shown by default a text view instead of the hex view on the right.

x86 filter

This can come handy when decrypting shellcode. What we also most probably need is the misc/basic filter, which I think will be one of the most commonly used filters. Let’s look at its parameters.

basic filter params

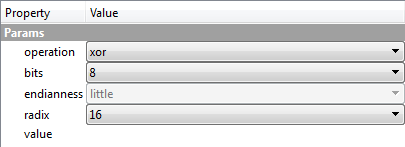
operation specifies what is going to be performed on the input data. Available operations are: set(fill), add, sub, mul, div, mod, and, or, xor, shl, shr, rol, ror. bits specifies the size in bits of each element the operation has to be performed on (values up to 64 bit are supported). endianness applies only to elements greater than 8 bits. radix is related to the input format of value. value contains the data used for the operation.

If I now inserted “FF” as value, then I would be xoring every byte of the input data with that 1-byte value. If, however, I inserted “FF 00”, then I would be xoring every even byte with “FF” and every uneven one with “00”. I may even only modify every third byte by using wildcards and leaving the first two unchanged, I only have to insert “* * FF”. Wildcards and arrays can be used even in the context of values bigger than 1 byte of course.

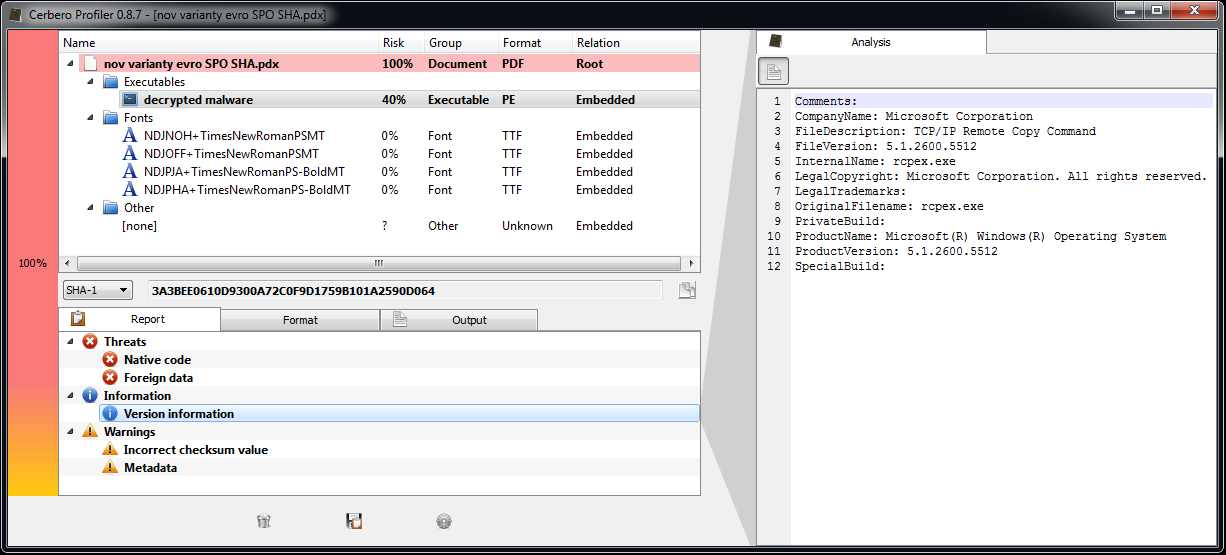
Now that I’ve introduced the basic filter, let’s see our first real-world case. What you see is a PDF containing an encrypted malware.

Malware PDF

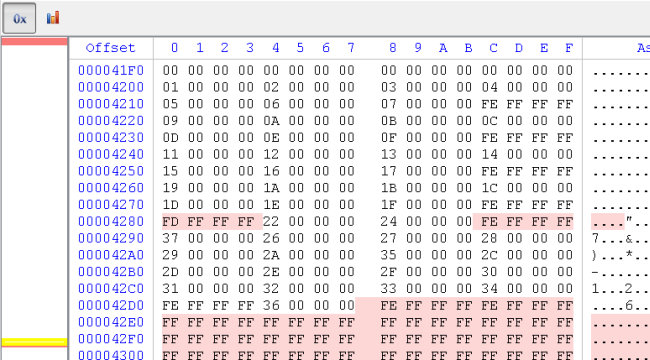
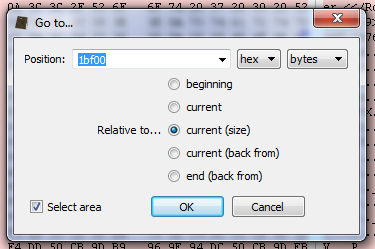
At the caret position an encrypted Portable Executable starts, it’s quite easy to figure out because of the repetitive sequence of bytes (a PE header is full of zeroes). I select the data with the go to dialog (Ctrl+G).

Select encrypted malware

Now instead of triggering the filter view directly, I’m going to load the embedded file with Ctrl+E. This triggers the load file dialog.

Load malware

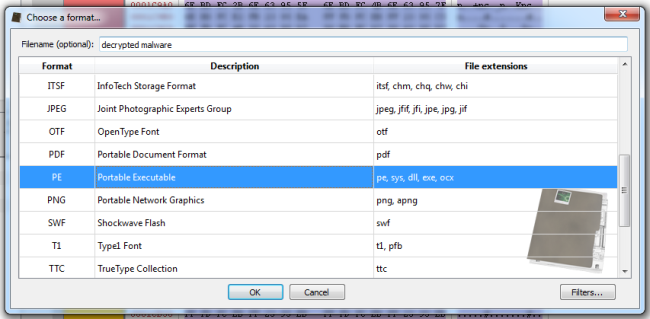
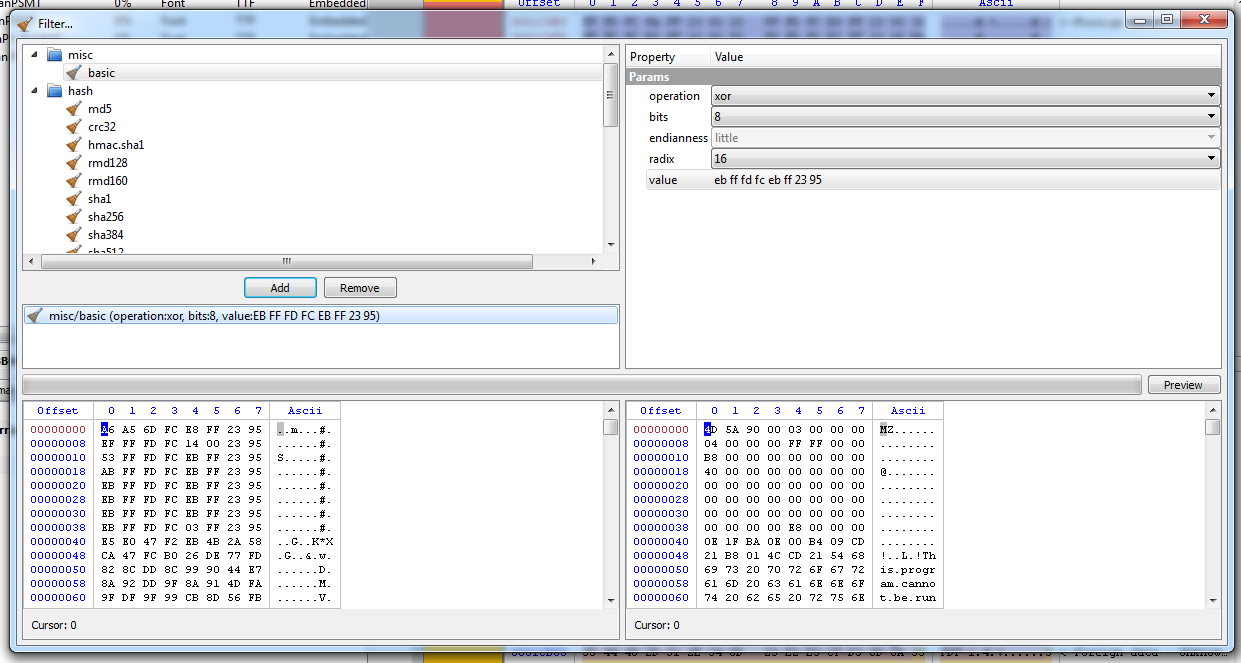
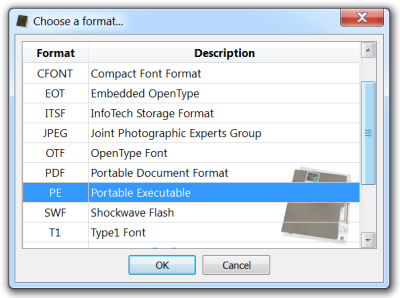
As you can see I specified the format of the file to load (PE) and inserted an optional name for it, but now it’s necessary to tell the Profiler how to decrypt the file, otherwise it won’t be able to load it. So I’ll just click on the “Filters” button at the bottom-right and a filter view dialog will pop up.

Malware filters

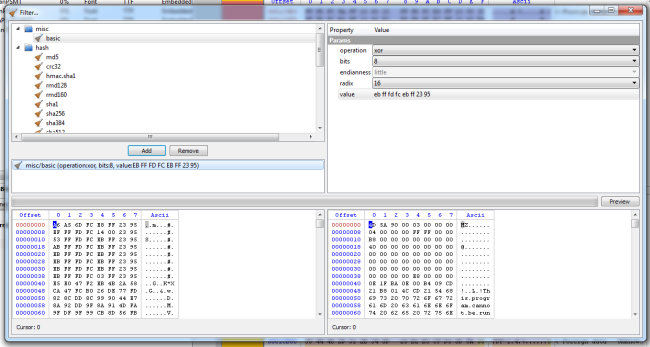
The decryption sequence is “EB FF FD FC EB FF 23 95”. It can be expressed like I did as an array.

But since it amounts to a 64-bit value, it can also be expressed like this.

Ok, back to the malware. After having added the decryption filter to the stack I just close the dialog and confirm the load file dialog. We’re now able to navigate the decrypted PE.

Decrypted malware

Now I can just save the project (which is under 1KB) and send it to a colleague who will be able to inspect the decrypted file.

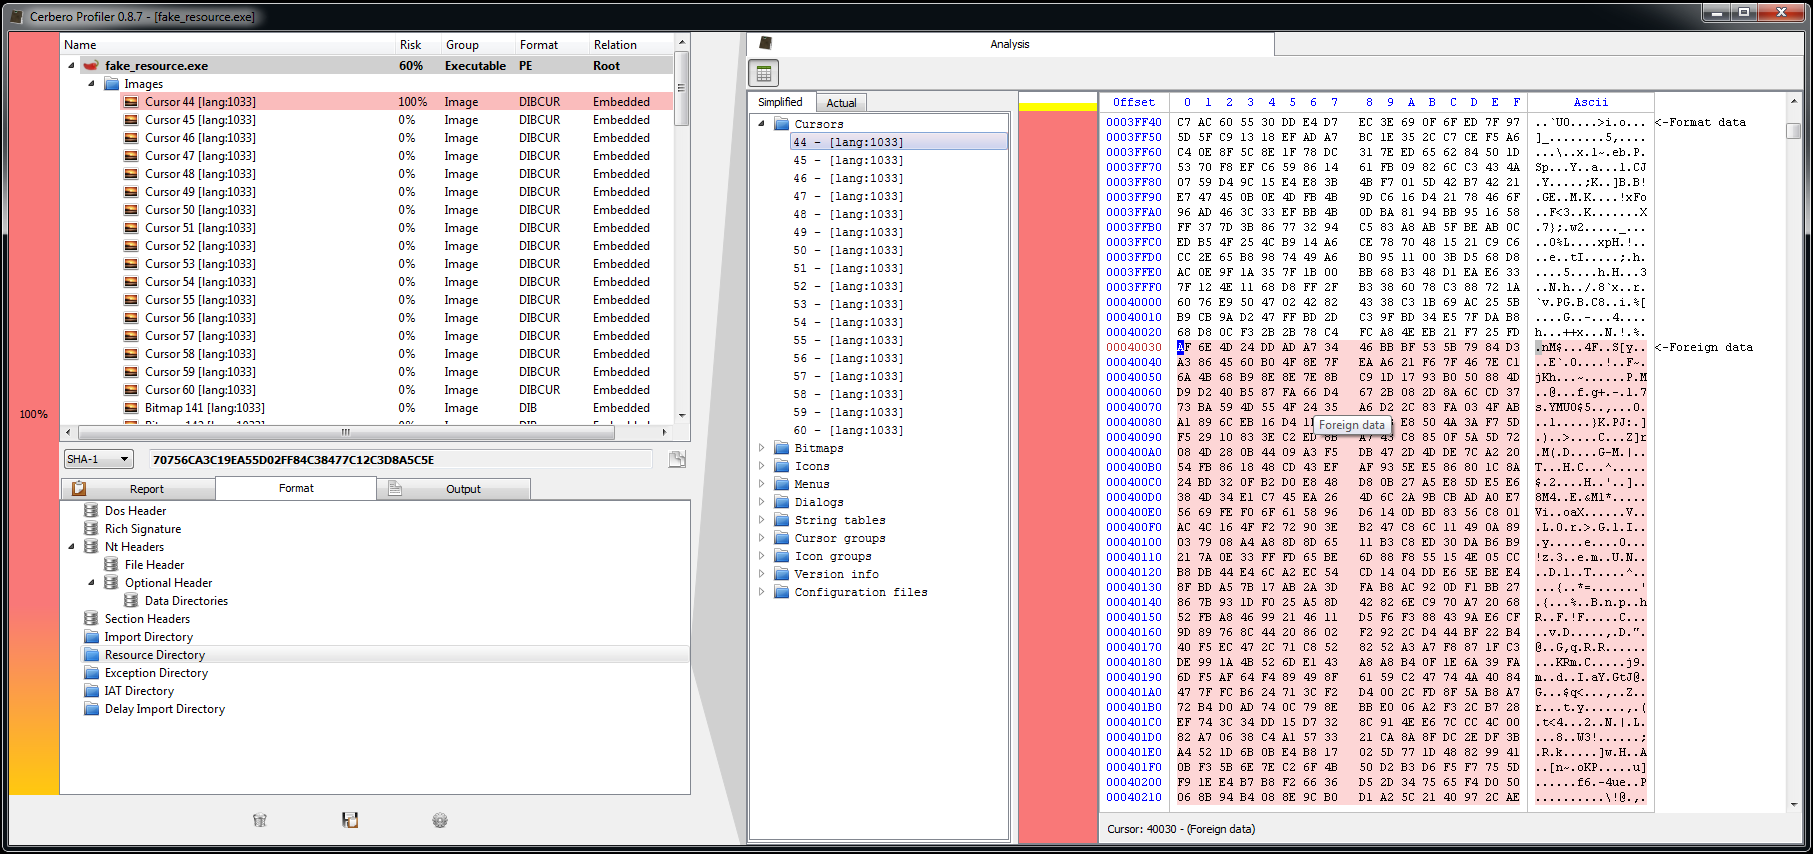
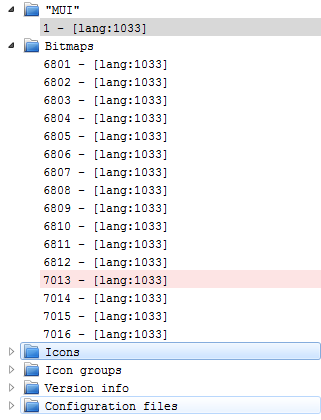
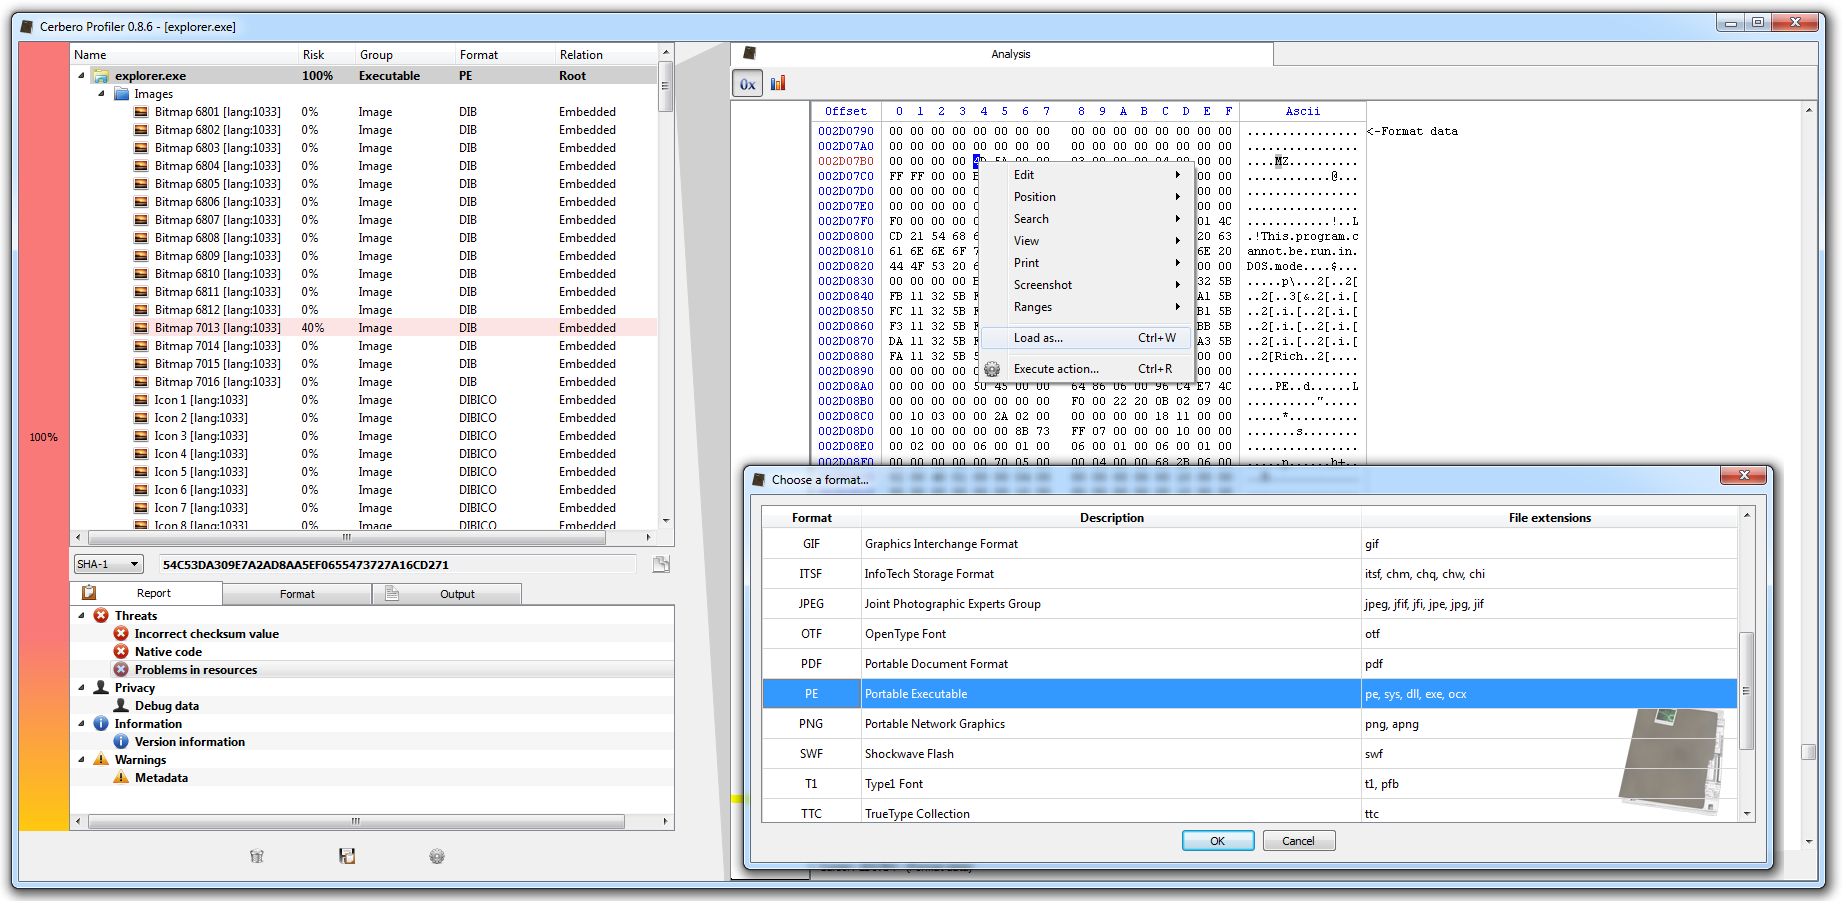
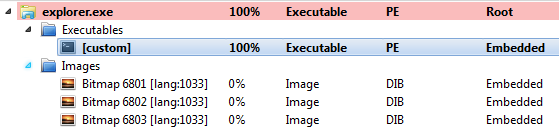
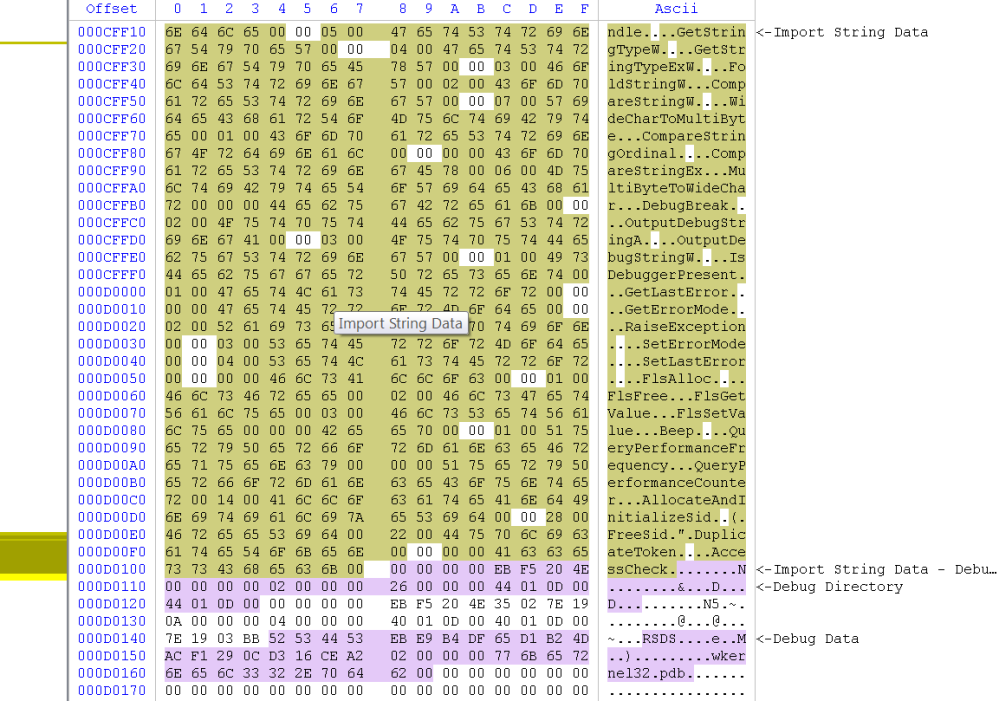
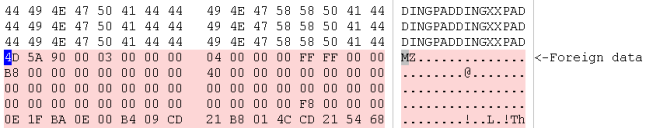
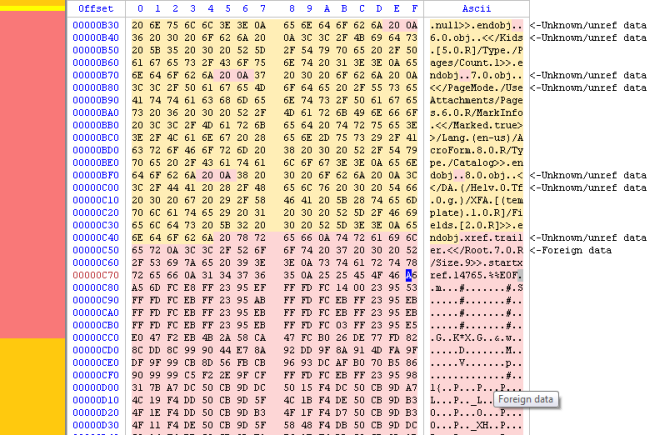
The last real-world case I’m going to present I made it myself, because it was easier than to start looking for one. I just took a cursor resource from a PE and appended another RC4-encrypted PE to it. Then replaced the original resource and opened the host file with the Profiler.

Fake resource

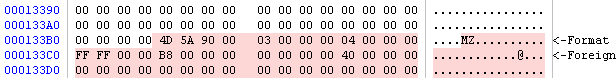
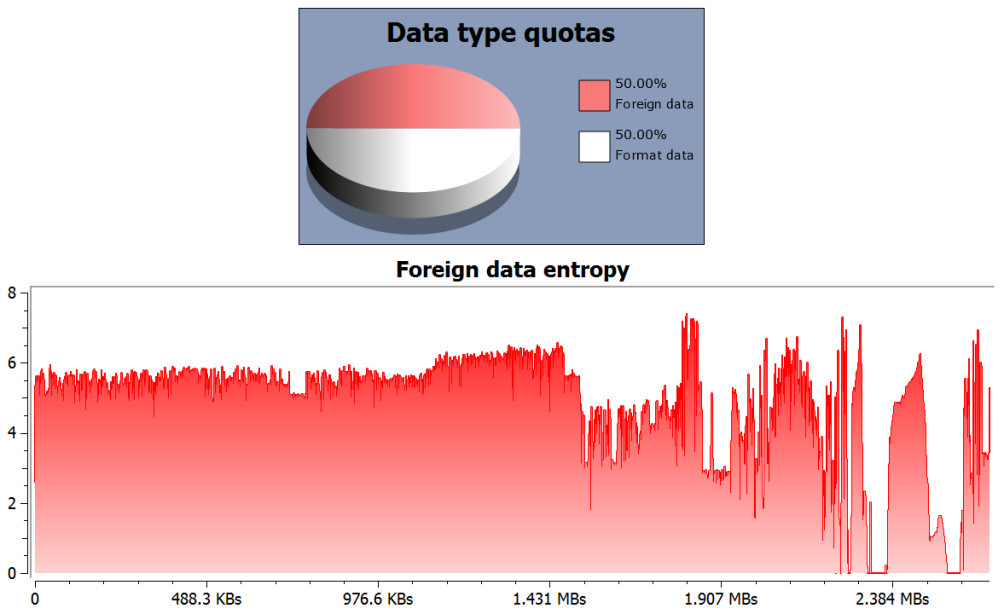
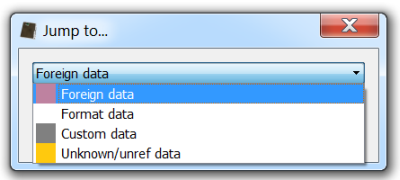
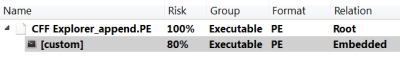
The Profiler tells us that the are problems in the resource and also shows us the file. In fact, we can see where the foreign data begins. I just select the foreign data (I can do this both from the resource directory or from the DIBCUR embedded file), trigger the load file dialog and apply the decryption filter.

In upcoming updates there will be many improvements to filters: many more will be added and the concept will be extended and made customizable. Clearly this post doesn’t cover all of that, but I think for now this is enough to keep the introduction simple.

Microsoft Authenticode

Based on RSA’s PKCS7 standard, Authenticode is the technology developed by Microsoft to digitally certify programs and drivers on Windows. Trusted signatures guarantee that the certificate owner is indeed the author of the signed executable, and also that the data itself has not been tampered with by anyone else.

In a default configuration scenario, the operating system considers these signatures during all but three events:

  1. When kernel-mode drivers are loaded
  2. When executable images that derive directly from content downloaded using Internet Explorer (or any other third-party browser which supports it) are written to disk.
  3. When an application requires admin privileges.

Point two is a weak security measure for the following reasons:

  1. Even if the right browser is used, there’s still no guarantee that the verification request (because it is by no means mandatory) is honored by the operating system unless the UAC privilege elevation dialog is invoked (either via manifest or using the “Run as Administrator” menu item). It’s important to note that if the Authenticode signature can’t be verified, the dialog being shown to the user is the same as the one for unsigned executables. At this point, there is no way to distinguish from unsigned (no code signature) and untrusted programs (invalid code signature) using the UAC dialog alone.
  2. Once an application has been authorized by a user and his certificate store, no checks are performed when it is moved to another system (even if the new certificate store can’t validate the Authenticode signature)
  3. The whole mechanism heavily relies on the file system being used; copying unauthorized files to a non-NTFS file system (which happens quite a lot, considering the vast majority of USB drives are using FAT32) doesn’t preserve the alternate data streams created by browser.

Also the verification is not self evident if done manually using Windows Explorer, as the properties dialog doesn’t show the validity of the certificate until the user clicks the “Details” button. This is highly misleading, because the user might get a false sense of security by just checking whether the executable contains a digital signature.

Windows certificate dialog

The upcoming version 0.8.6 of the Profiler introduces support for this technology, allowing users to very quickly access and verify code signing information.

The following screenshot shows a perfectly valid digital signature; all the certificates taken from the Authenticode data have been successfully used to build a trust chain that validates the PKCS7 using the system store, which means that those at the root of the tree have been directly validated by the Windows Certificate Store.

Microsoft Authenticode – A valid digital signature

As you can see, the risk factor is set to zero, since the validity of the publisher has been determined. This behavior can be changed from the Risk panel of the options: it is not on by default!

For comparison, the following screenshot shows how an invalid digital certificate is displayed:

Microsoft Authenticode – An invalid digital signature

In this case the hash is no longer what expected, issuing both a digest and an invalid certificate errors.
Countersignatures are of course supported and I think you’ll be pleased with how fast our implementation is.

Additional resources:

  1. Windows NTFS Alternate Data Streams, from Symantec
  2. Mark of the Web, from MSDN

Validation of Portable Executable resources

One of the new features of the upcoming 0.8.6 version of the Profiler is the validation of resources. This means the Profiler verifies the integrity of resources and lets the user inspect problems, making it easy to discover things like appended files or fake resources. This feature comes handy since very often malware is hidden in resources and droppers often use resources to store their payload.

All the most important resource types are supported:

  • Version info
  • Bitmaps
  • Icons
  • Cursors
  • Icon groups
  • Cursor groups
  • Configuration files
  • Accelerators
  • Menus
  • Dialogs
  • String tables
  • Message tables
  • Any other supported file format

So let’s see a simple test case. What I did is to append a DLL to a bitmap and then replace one of the bitmaps in explorer.exe with my modified one.

I could’ve used any other resource type, or even a PNG or GIF, it wouldn’t have mattered.

The simplified resource tree highlights problems with their risk color, while unsupported types are highlighted in gray.

One can jump to problems with the F2 shortcut, no need to scroll the tree ourselves in search of problems.

In the screenshot above the analysis shown is for my fake bitmap. As it’s possible to see, the bitmap ends where the red-marked data begins.

In this context it is very easy to just load the embedded PE with the “Load as…” (Ctrl+W) command.

And this gives me the opportunity to mention briefly another nice improvement to the hierarchy view.

As you can see files are now grouped according to their type. This makes it much easier to go over the files or to look for specific types. This behavior is optional and can be changed from the settings.

I think I could’ve presented this new feature with a more interesting real-world case. However, there are still some things to do in order for the new version to come out and there wasn’t enough time. I hope, nevertheless, that you enjoyed the post. 🙂

News for version 0.8.5

Since there are many improvements and additions, here’s a list with the most important ones:

– finished support for Portable Executable directories (.NET excluded): Delay Import, Bound Import, Exception (x64, IA64), Security
– improved detection of files in MSI archives
– replaced the native scan table with the custom table control: now it’s fast and efficient
– added threat highlighting and jump in scan table and hierarchy view
– increased the UI responsiveness during batch scans
– introduced option to disable intrinsic risk factors
– added search functionality to every control which lacked it
– added support for PNG and APNG files
– added support for GIF files
– improved PE Debug directory view
– added language switch in text view
– improved file format choose dialog
– improved initialization performance by delay-loading some modules
– updated OpenSSL

This version prepares the ground for the next .6 version, which as I expect will be very interesting. However, even in 0.8.5 there are many useful new things, so in this post I’ll just do a tour of those which might need an explanation.

Threat highlighting

This means that files with a risk factor > 0 are now highlighted with different gradients of orange (low risk) and red (high risk). This is true for the new file system scan results table, which by the way is now blazingly fast.

Scan threat highlighting

But also for the file hierarchy itself.

Hierarchy threat highlighting

It’s possible to jump to files with risk factor > _customizable_threshold_limit_ with F2 (next) and Shift+F2 (previous).

Disable intrinsic risk factors

It’s pretty clear that an executable can contain native code, right? It’s expected to, just as a font file is expected to contain its specific bytecode. These characteristics are intrinsic to these file formats and as users we might not desire to be alarmed by that.

Disable intrinsic risk

By enabling this new handy option, these factors will no longer contribute to calculate the risk of a file.

PE directories

Apart from .NET, all Portable Executable directories are now supported. Specifically, support for the following directories has been added: Delay Import, Bound Import, Exception (x64, IA64) and Security.

Security Directory

This month we will post about some new interesting features and the PE analysis series will be continued. 🙂

PE analysis (part 1)

This is the first of a series of posts which will be dedicated to PE analysis features. In previous posts we have seen how the Profiler has started supporting PE as a format and while it still lacks support for a few directories (and .NET), it supports enough of them for x86 PE analysis.

PE Analysis 1

While the upcoming version 0.8.4 of the Profiler also features analysis checks as CRC, recursion, metadata, etc., this post will be about the in-depth range analysis for PE files. As the screenshot above previews, in-depth ranges show PE data structures in a hex view and the distribution of data in a PE file.

Let’s take as first sample “kernel32.dll”. After having it opened in the Profiler, let’s execute the “PE->Display ranges” action.

PE ranges action

We get the PE ranges for kernel32.

Kernel32 ranges

The big region of data marked as fluorescent green represents executable code. As you can see, it is interrupted by a gray region of data which the tooltip tells us being a combination of “Code” and “Export Name Data”. If we move the cursor, we can see that it’s not only Export data, but also Import data. Which means that the Export and Import directory are contained in the executable part of the file (the IAT is in the thin gray area at the beginning of the code section). But we may not be interested in having the code section covering other data regions. This is why we can filter what we want to see (Ctrl+B).

PE ranges filter

I unmarked the “Code” range. Thus, we now get all the ranges except the unmarked one.

Kernel32 ranges without code

We can also jump to regions of data, but before seeing that, I want to briefly mention that the hex view can be printed to file/PDF or captured.

Hex View caputre

Not a big feature, but it may come handy when generating reports.

Now let’s look at a file I have especially crafted for the occasion, although it reflects a very common real-world case.

PE high entropy

We’ve got a PE with an extremely high quantity (50%) of foreign data and the entropy level of that data is also extremely high.

So let’s jump to the first occurrence of foreign data (Ctrl+J).

Ranges jump

What we see is that right there where the analyzed PE files finishes, another one has been appended.

Appended PE

So let’s select the contiguous range of data (Ctrl+Alt+A: this will select the foreign range of data) and “Load selection as…” (Ctrl+E) will asks us to select the file type to load (it is automatically identified as being a PE).

Load appended PE

We are now able to analyze the embedded PE file.

Loaded appended PE

While this procedure doesn’t highlight anything new, since loading of embedded files has been featured by the Profiler from its earliest versions, I wanted to show a practical use of it in connection with ranges.

It has to be noted that this particular case is so simple that it can be detected automatically without interaction of the user. In fact, detection of appended files in PEs will be added most probably in version 0.8.5.

Hope you enjoyed this post and stay tuned for the next parts!

PS: take advantage of our promotional offer in time. Prices will be updated in August!

ActionScript2 Disassembler

While a disassembler for ActionScript3 has been featured by the earliest versions of the Profiler, it was still missing one for ActionScript2. This has changed in the upcoming 0.8.4 version and thus largely extending the support for the Flash file format.

AS2 Disassembler

The main goal I had during the development of this component was to represent the input file as close as possible in the output. To achieve this, the resulting disasm contains offsets, sizes, and also warnings and errors in case wrong values are detected.

Sorry for making this post so short, but there’s still a lot to do for the upcoming release!

Resource & Load Config Directory

The upcoming 0.8.3 version of the Profiler features two new directories. Most of the work went into implementing an efficient model view controller for the Resource Directory tree.

Resource Directory

Last year I was notified by Ange Albertini that his resourceloop.exe sample crashed the CFF Explorer (by exhausting the stack). Recursion is one of the things to look after when parsing a file as mentioned in my speech about the security of non-executable files. The screenshot below shows Ange’s sample in the Profiler.

Recursive Resource Directory

The red marked Resource Directory Entry points back to the top-level Resource Directory and thus creates a recursion in the tree.

The Profiler is intended to offer complete support for the PE file format, this is why all directories will be supported. One of the directories missing in the CFF Explorer, for instance, is the Load Config (alias SafeSEH).

Load Config Directory

Another small addition is the smart address converter (VA/RVA/Offset). This action guesses the address which needs to be converted from the context. Jumping to a location in the hex view is usually a matter of Ctrl+R and twice Ctrl+Enter.

Address converter

Five directories are still missing: Security, Exception, Bound Import, Delay Import and .NET. The analysis of x86 PEs can already be implemented by adding basic support for the Security Directory. x64 needs Exception as well. Bound and Delay Import support will follow. .NET is the one which has least priority, but it won’t take much time to impelement.

The coming posts about Portable Executable will involve analysis and will be more interesting than this one. So stay tuned. 😉

Profiler 0.8.2 Demo

The first evaluation version of the Profiler is available.
SHA1: F1CA1B8B1BAE51977EE0BE827DC13E2E17BD81A3

Please note that the demo is subject to limitations:

  • only standard .doc files are supported (not even other Office file types)
  • embedded and referenced files can’t be inspected
  • only single file analysis is available
  • although the action system is working, some actions are not available

But now let’s see what features it does offer.

Demo 0

The file report and the hex view along with marked ranges.

Demo 1

The extraction of metadata.

Demo 2

The extraction of VBA code is also available.

Demo 3

And, of course, the inspection of the CFBF file format itself.

Demo 4

Other common features are also available. Enjoy!

Portable Executable: coming soon

In the upcoming 0.8.1 release of the Profiler initial support for PE files has been introduced. 🙂

Optional Header

Most of the work went into optimizing the UI and allowing for complex custom views to be built easily, while maintaining great speed. Even the grid control you can see here displayed is a custom control.

In the following screenshot you can see a complex view displaying the section headers.

Section Headers

And here’s a more basic view for the import directory.

Import Directory

Another eye candy screenshot of the section headers with entropy computation for one section.

Section Entropy

What will be present in this first PE edition is mainly about the file format itself. What is going to be missing is a viewer for the resources and one for the .NET directory, because we need first to implement an efficient and customizable tree control. Also ranges won’t be supported as long as the whole file format isn’t supported. This is due to the fact that the PE is one of the most studied and documented file formats around, hence the necessity to be very precise when calculating data ranges.

Also, soon we’ll release a demo of the Profiler. Stay tuned!