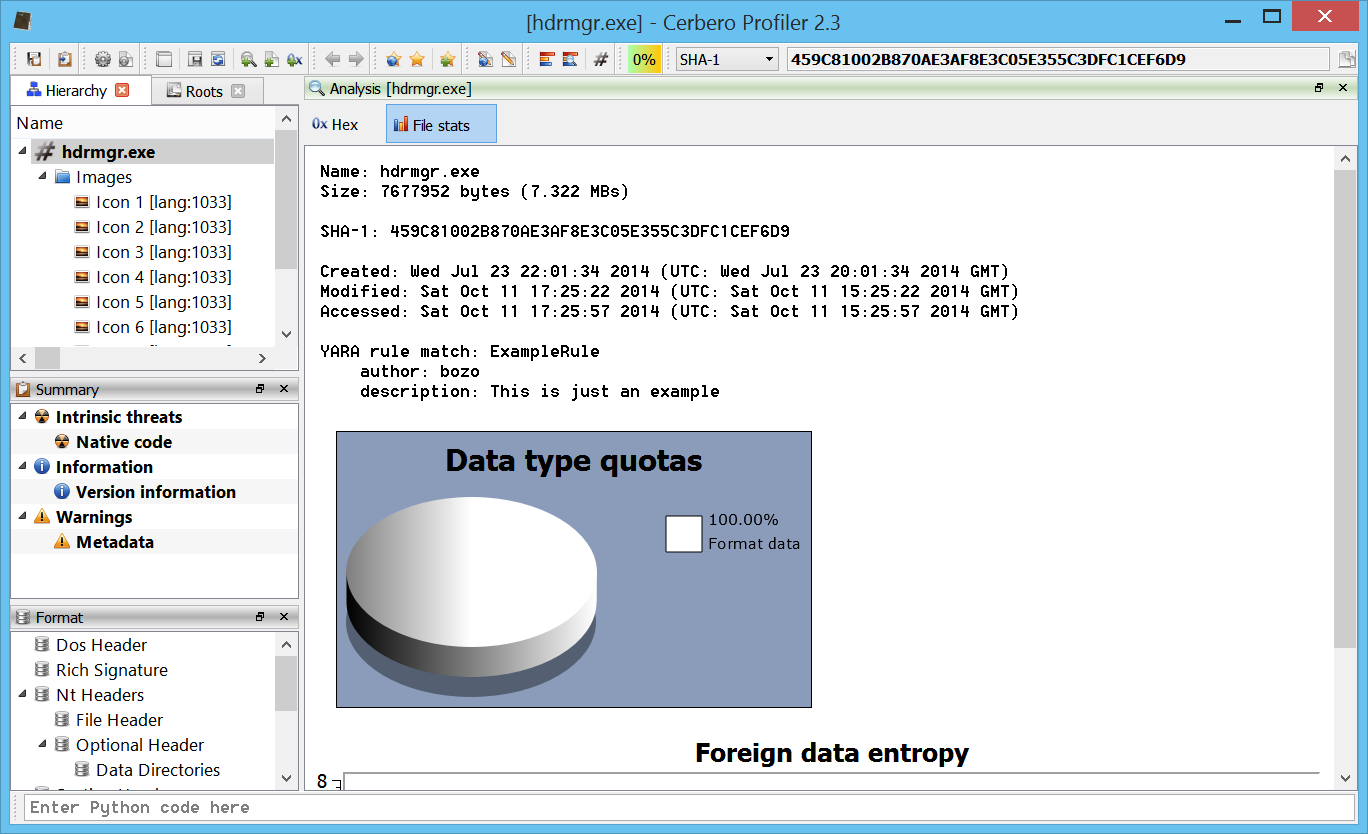
Profiler 2.3 is out with the following news:
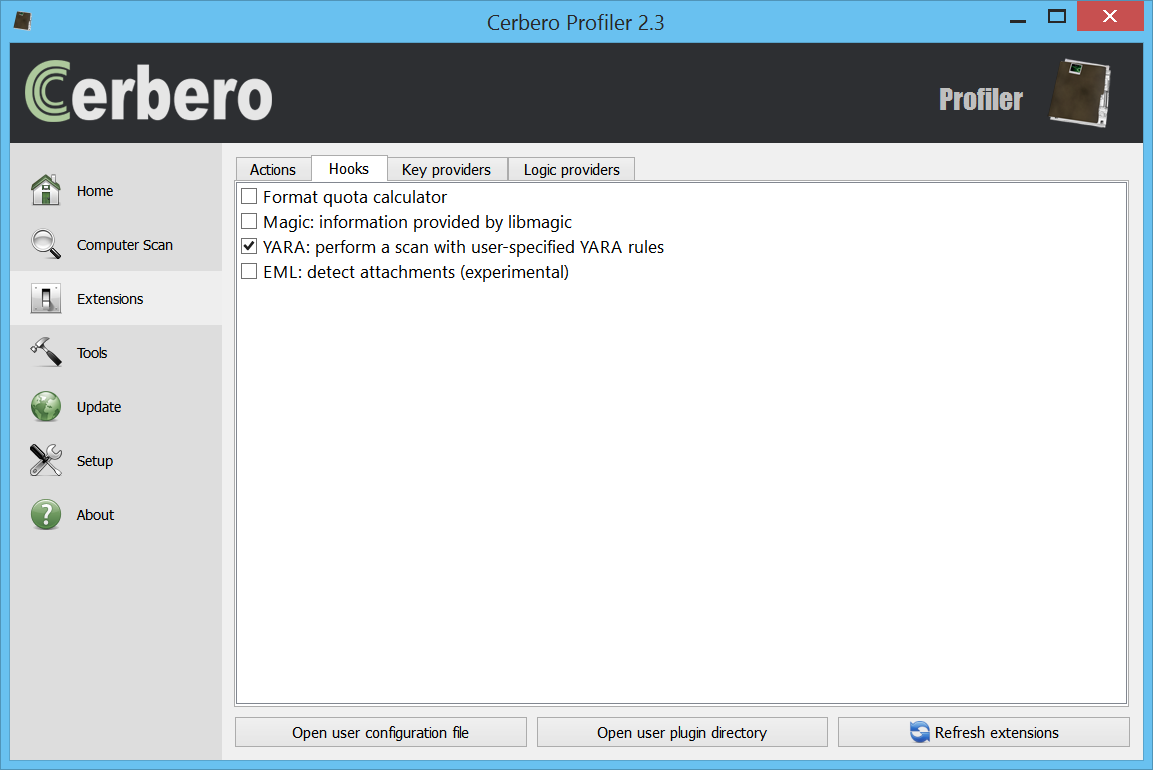
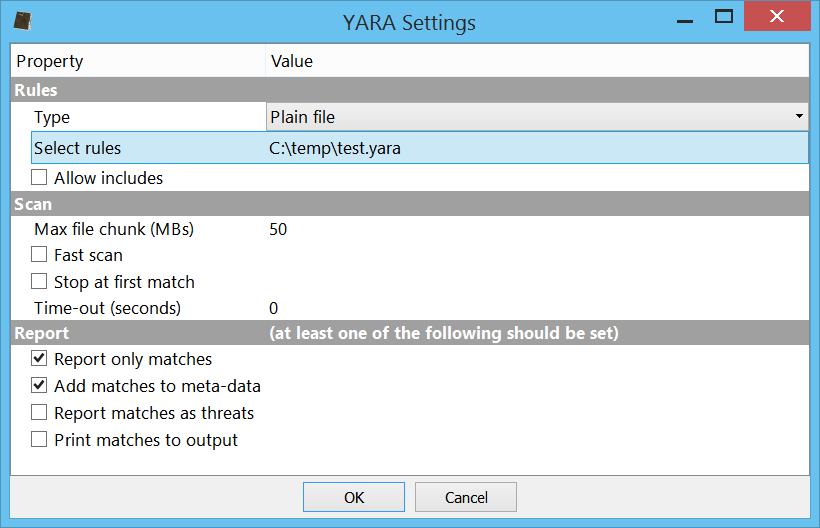
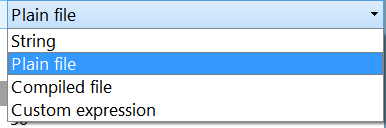
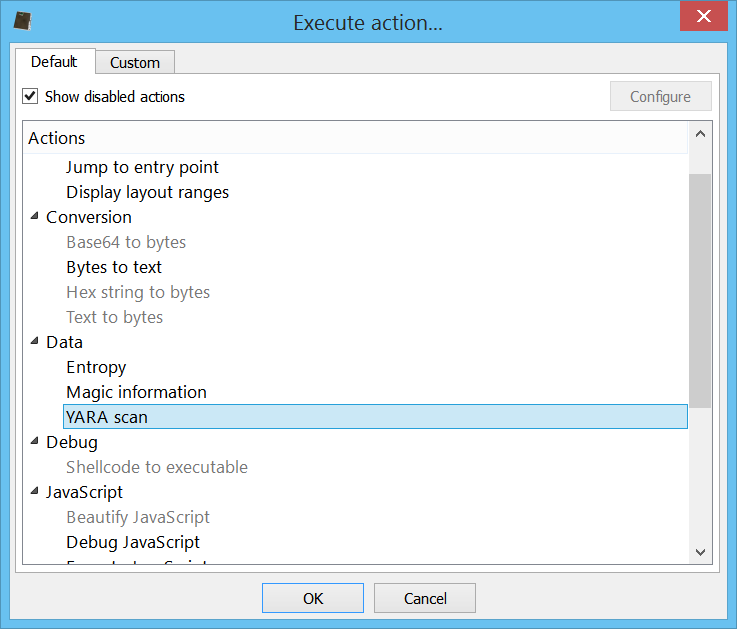
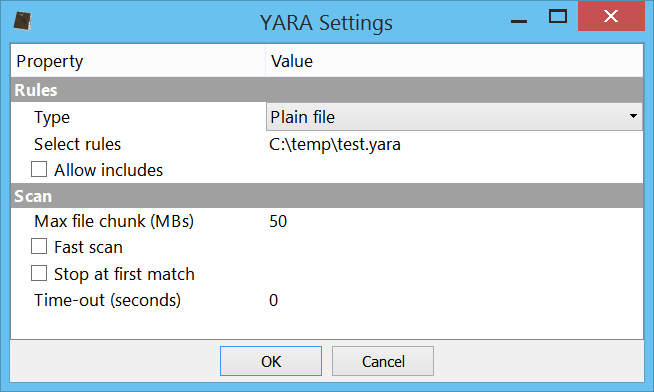
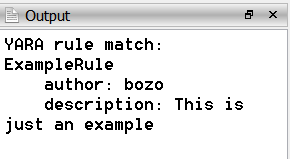
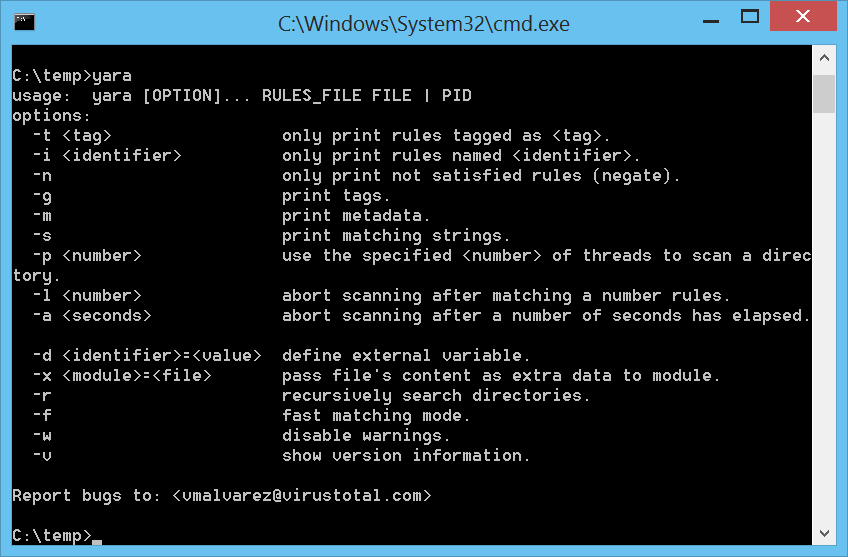
– introduced YARA 3.2 support
– added groups for logic providers
– added Python action to encode/decode text
– added Python action to strip XML down to text
– added the possibility to choose the fixed font
– added color randomization for structs and intervals
– added close report and quit APIs
– exposed more methods of the Report class (including save)
– improved indentation handling in the script editor
– synchronized main and workspace output views
– improved output view
– updated libmagic to 5.21
– updated Capstone to 3.0
– many small improvements
– fixed libmagic on Linux
– removed the tray icon
– minor bug fixes
Logic provider groups
Logic providers can now be grouped in order to avoid clutter in the main window. Adding the following line to an existing logic provider will result in a new group being created:
group = Extra 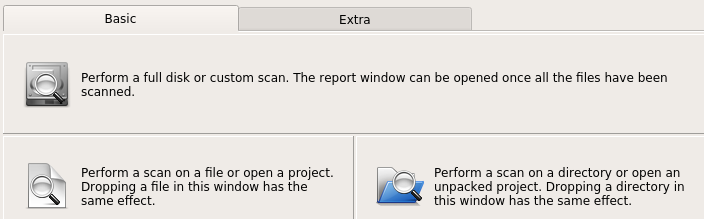
Encode/decode text action
A handy Python action to convert from hex to text and vice-versa using all of Python’s supported encodings. Place yourself in a hex or text view and run the encoding/decoding action ‘Bytes to text’ or ‘Text to bytes’.
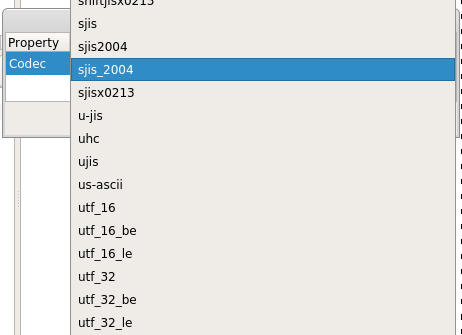
The operation will open a new text or hex view depending if it was an encoding or a decoding.
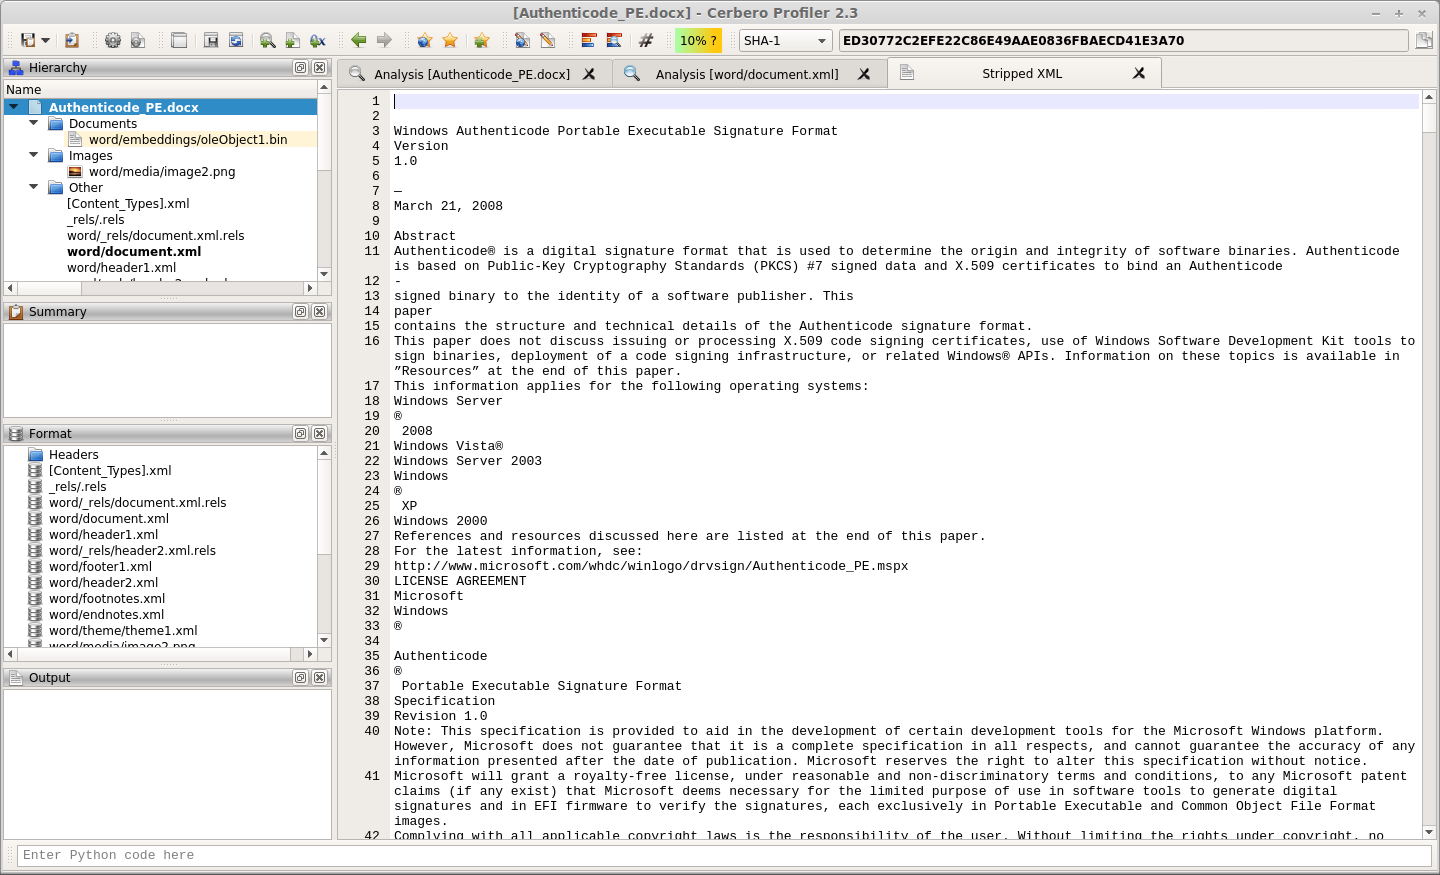
XML to text action
Strips tags from an XML and displays only the text. The action can be performed both on a hex and text view.
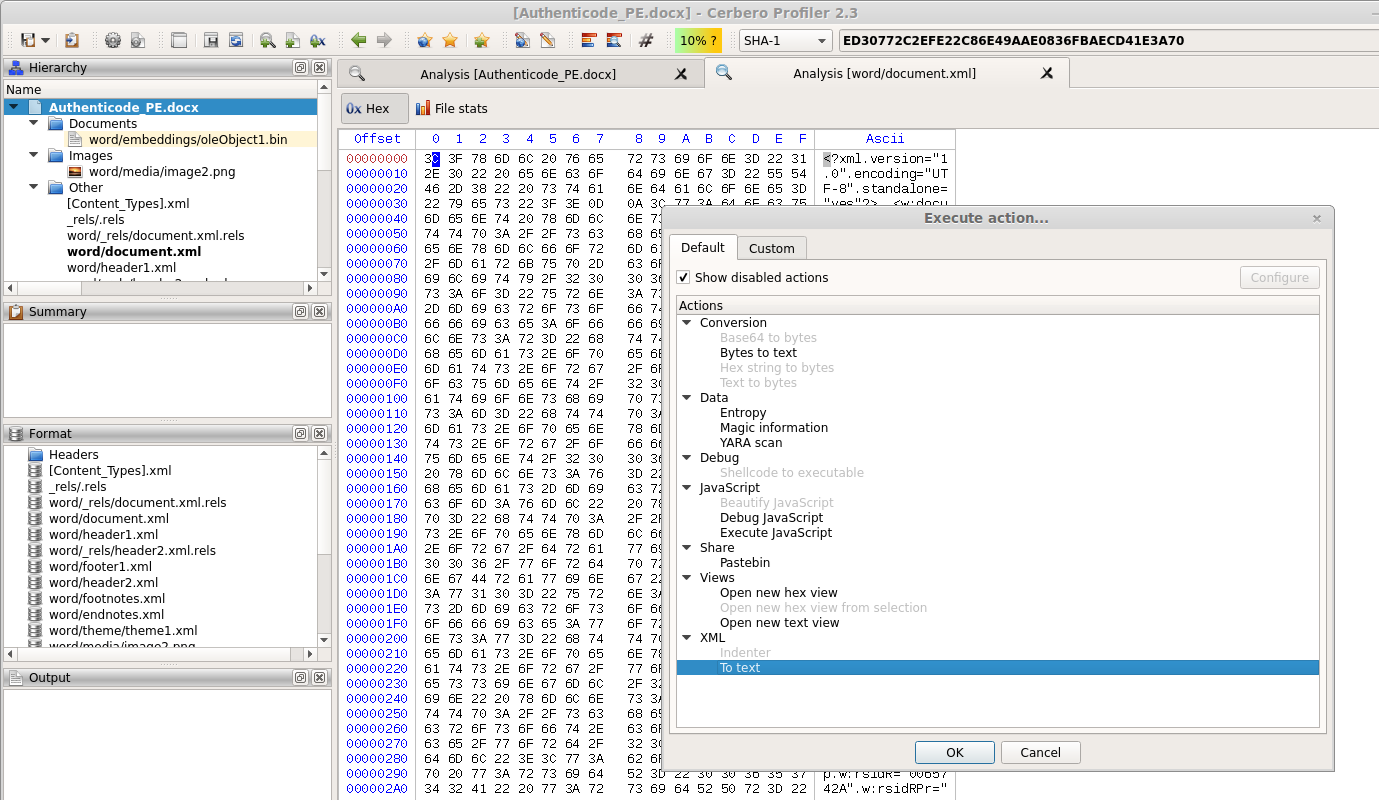
And it will open a new text view. This is useful to view the text of a DOCX or ODT document. In the future the preview for these documents will be made available automatically, but in the meantime this action is helpful.
Fixed font preferences
The fixed font used in most views can now be chosen from the ‘General’ settings.
Struct/intervals color randomization
When adding a structure or interval to the hex view the chosen color is now being randomized every time the dialog shows up. This behaviour can be disabled from the dialog itself and it’s also possible to randomize again the color by clicking on the specific refresh button.
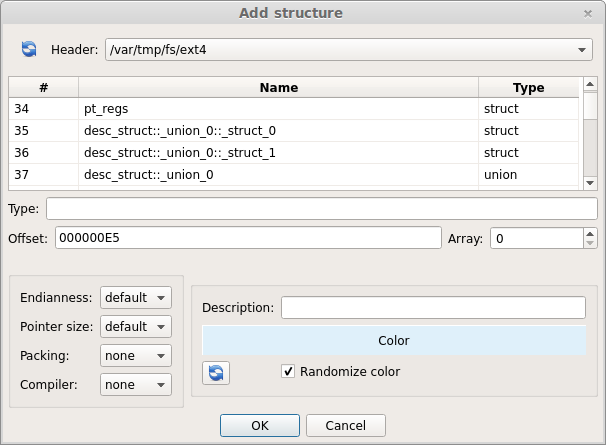
Manually picking a different color for every interval is time consuming and so this feature should speed up raw data analysis.
Report APIs
Most of the report APIs have been exposed (check out the SDK documentation). This combined with the newly introduced ‘quit’ SDK method can be used to perform custom scans programmatically and save the resulting report.
Here’s a small example which can be launched from the command line:
from Pro.Core import *
import sys
ctx = proCoreContext()
def init():
ctx.getSystem().addFile(sys.argv[1])
return True
def rload():
ctx.unregisterLogicProvider("test_logic")
ctx.getReport().saveAs("auto.cpro")
ctx.quit()
ctx.registerLogicProvider("test_logic", init, None, None, None, rload)
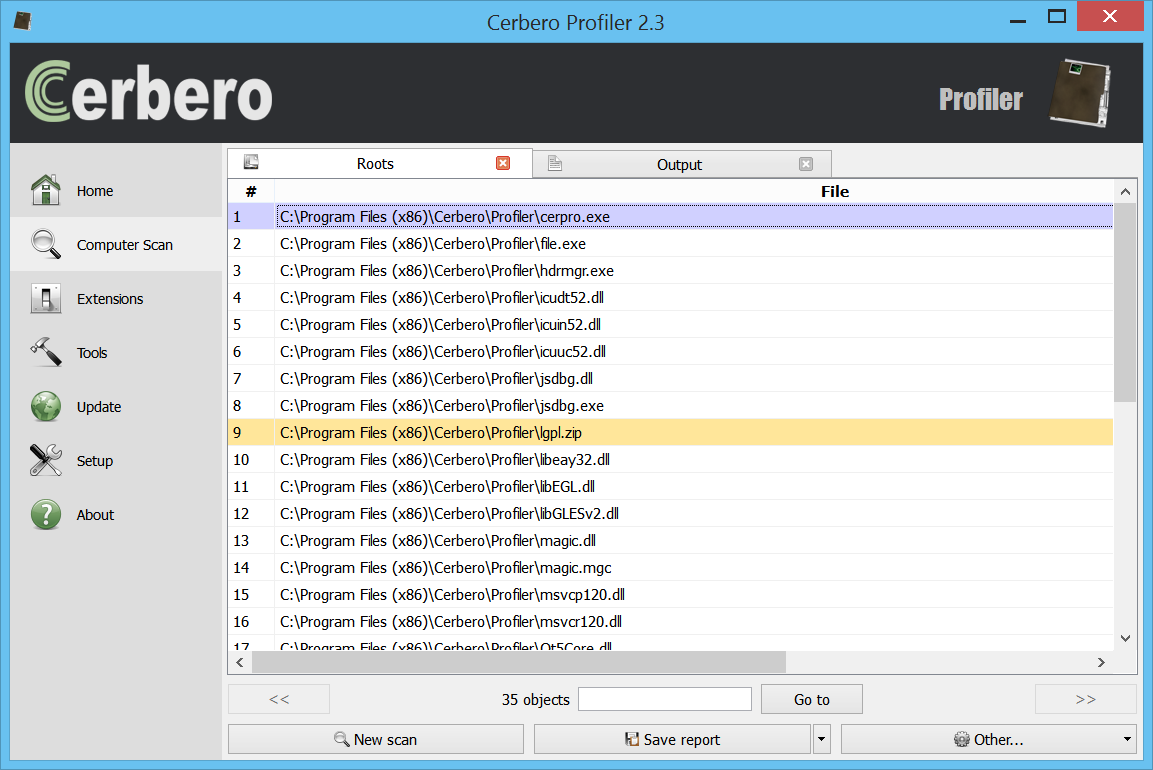
ctx.startScan("test_logic") The command line syntax to run this script would be:
cerpro -r scan.py [file to scan] The UI will show up and close automatically once the ‘quit’ method is called. Running this script in console mode using the ‘-c’ parameter is not yet possible, because of the differences in message handling on different platforms, but it will be in the future.
Synchronized output views
The output view of the main window and of the workspace are now synchronized, thus avoiding missing important log messages being printed in one or the other context.
Enjoy!