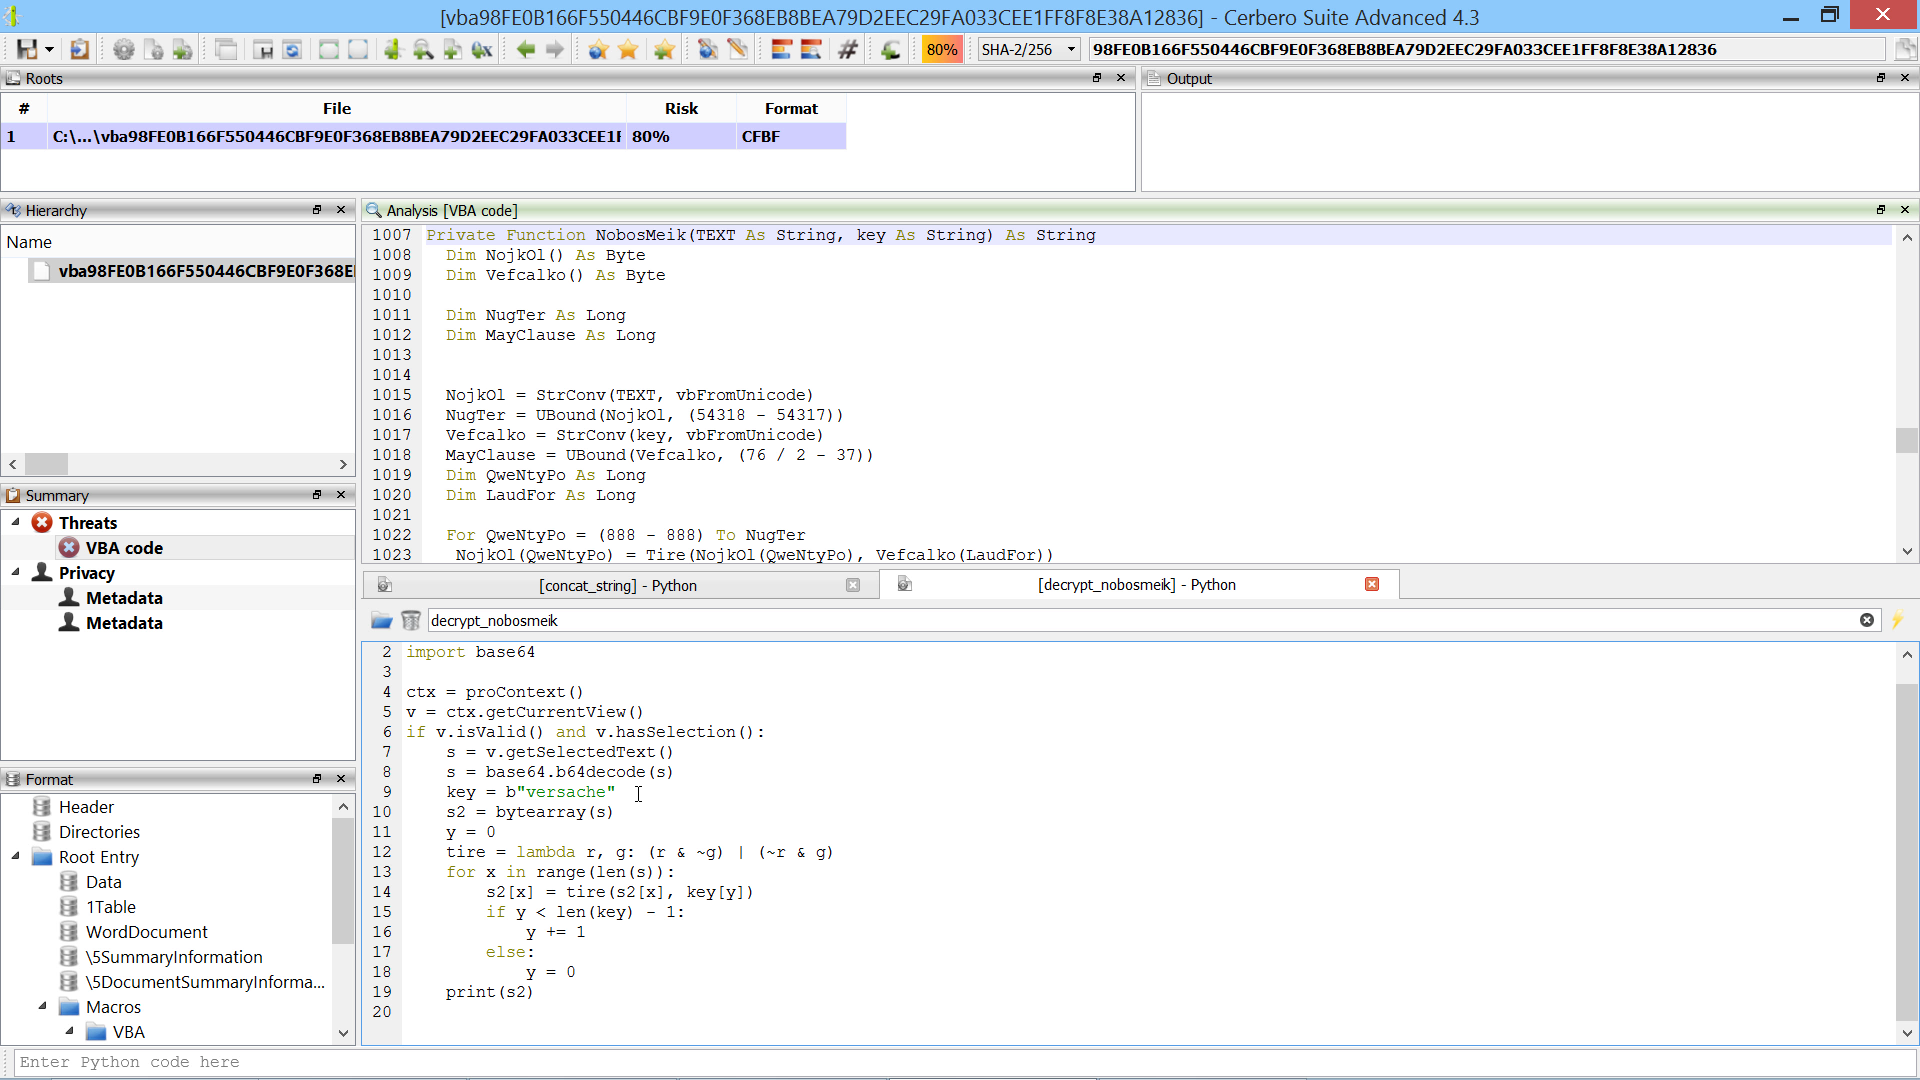
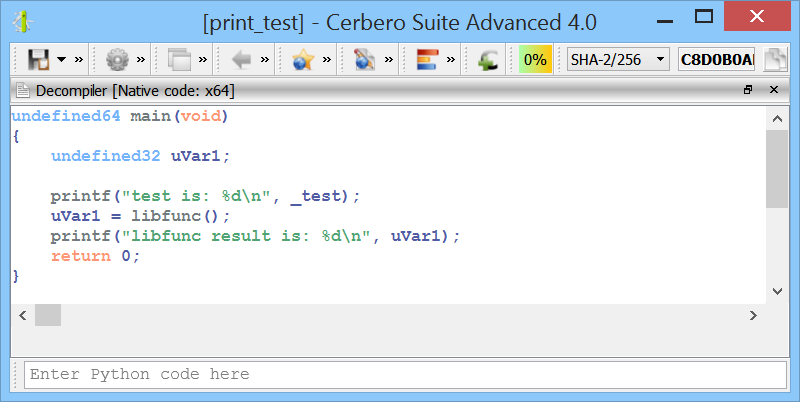
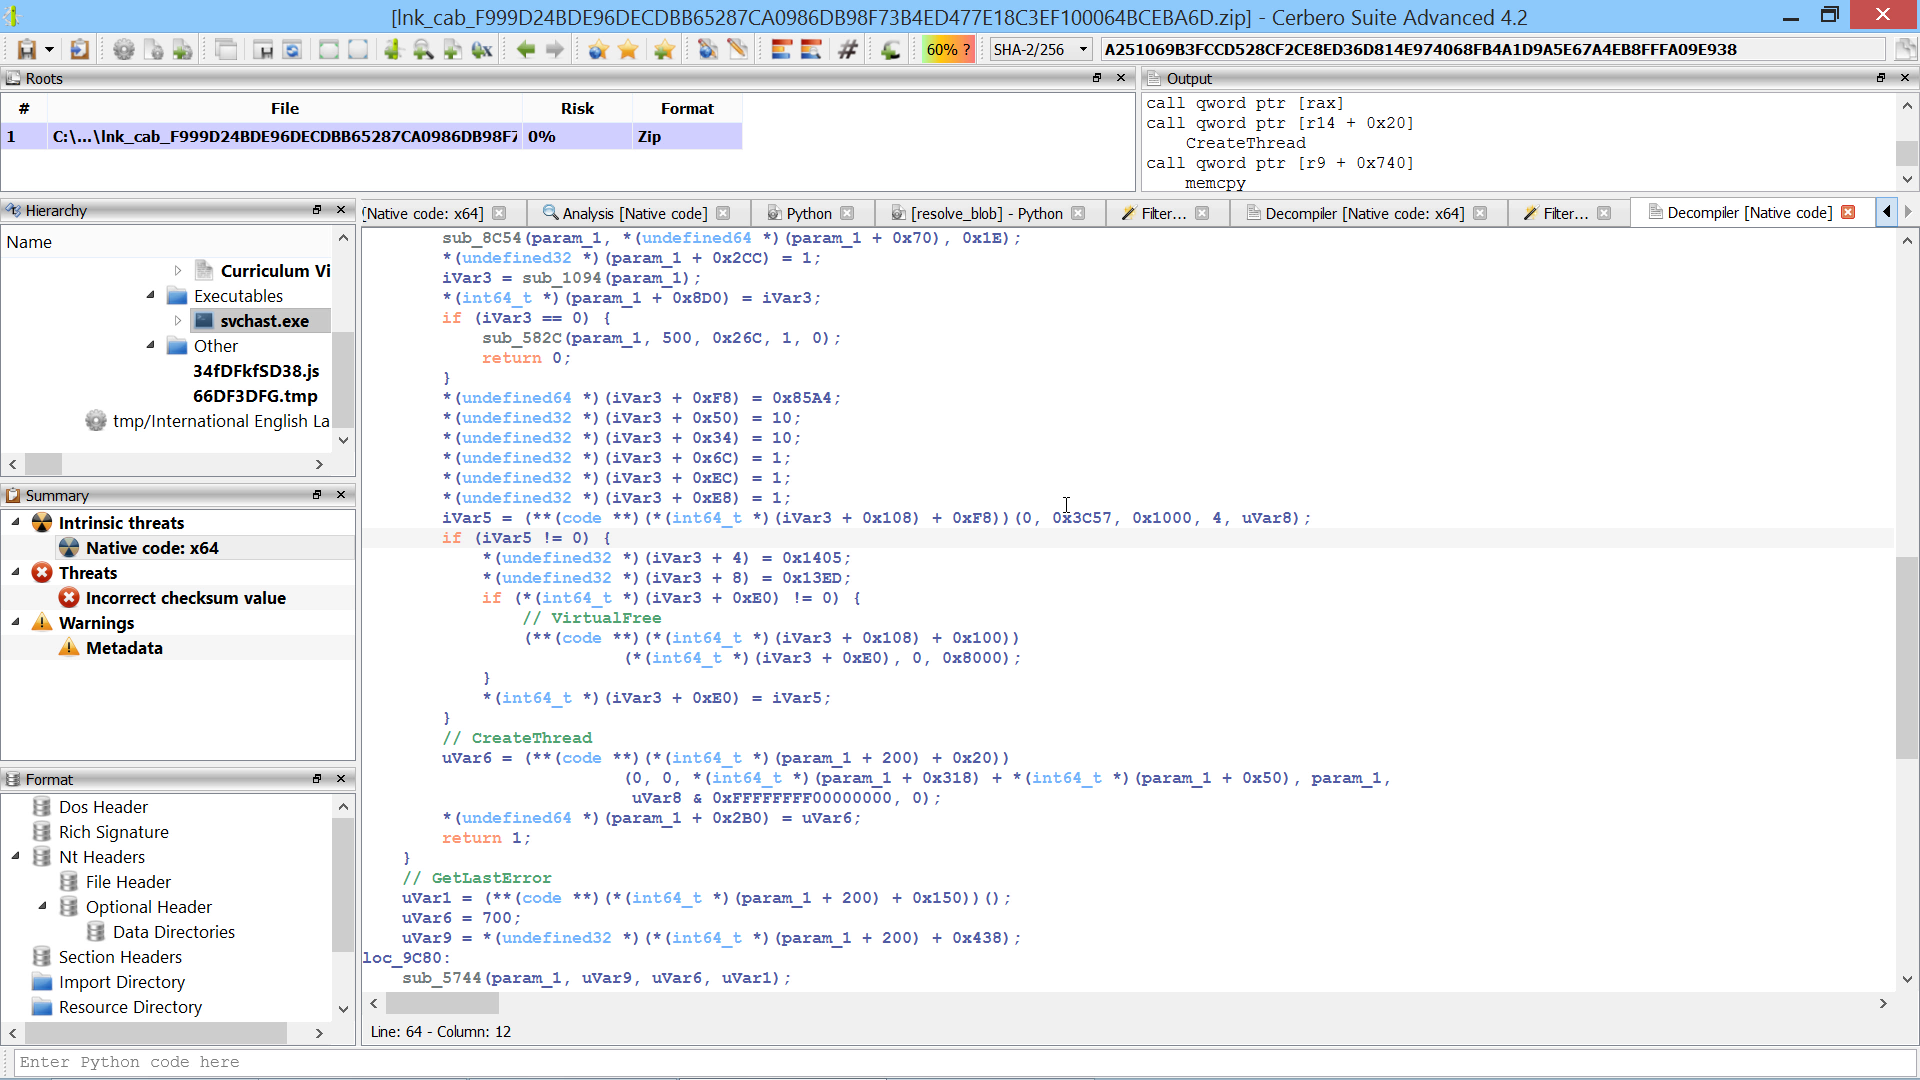
You can find the original analysis for this malware at malwarebytes. As a bonus, in the video we show how to improve the static analysis of the final payload by resolving API calls.
This script converts the decrypted blob hashes into a call index → api name dictionary.
blob = bytes([
0x6B, 0x65, 0x72, 0x6E, 0x65, 0x6C, 0x33, 0x32, 0x2E, 0x64, 0x6C, 0x6C, 0x00, 0x31, 0x33, 0x38,
0x36, 0x35, 0x31, 0x35, 0x38, 0x33, 0x38, 0x00, 0x31, 0x33, 0x30, 0x30, 0x36, 0x38, 0x33, 0x31,
0x31, 0x34, 0x00, 0x2D, 0x32, 0x30, 0x39, 0x30, 0x39, 0x37, 0x30, 0x37, 0x38, 0x36, 0x00, 0x2D,
0x31, 0x30, 0x37, 0x36, 0x33, 0x33, 0x30, 0x35, 0x31, 0x36, 0x00, 0x36, 0x38, 0x32, 0x36, 0x35,
0x37, 0x37, 0x34, 0x37, 0x00, 0x2D, 0x31, 0x31, 0x32, 0x31, 0x31, 0x39, 0x38, 0x30, 0x38, 0x30,
0x00, 0x2D, 0x39, 0x32, 0x32, 0x37, 0x39, 0x35, 0x39, 0x34, 0x39, 0x00, 0x2D, 0x35, 0x37, 0x39,
0x39, 0x32, 0x39, 0x31, 0x30, 0x38, 0x00, 0x39, 0x37, 0x30, 0x39, 0x31, 0x30, 0x32, 0x33, 0x34,
0x00, 0x39, 0x38, 0x32, 0x34, 0x34, 0x34, 0x35, 0x37, 0x30, 0x00, 0x31, 0x33, 0x33, 0x39, 0x39,
0x37, 0x32, 0x38, 0x32, 0x36, 0x00, 0x31, 0x33, 0x35, 0x31, 0x35, 0x30, 0x37, 0x31, 0x36, 0x32,
0x00, 0x38, 0x33, 0x36, 0x36, 0x35, 0x36, 0x30, 0x32, 0x36, 0x00, 0x38, 0x34, 0x38, 0x31, 0x39,
0x30, 0x33, 0x36, 0x32, 0x00, 0x31, 0x32, 0x33, 0x39, 0x33, 0x30, 0x38, 0x39, 0x35, 0x34, 0x00,
0x31, 0x32, 0x35, 0x30, 0x38, 0x34, 0x33, 0x32, 0x39, 0x30, 0x00, 0x2D, 0x31, 0x36, 0x35, 0x34,
0x36, 0x34, 0x36, 0x37, 0x33, 0x35, 0x00, 0x2D, 0x38, 0x34, 0x38, 0x34, 0x30, 0x30, 0x33, 0x33,
0x38, 0x00, 0x32, 0x30, 0x38, 0x35, 0x34, 0x38, 0x30, 0x34, 0x35, 0x39, 0x00, 0x2D, 0x36, 0x35,
0x32, 0x32, 0x33, 0x31, 0x35, 0x33, 0x37, 0x00, 0x33, 0x38, 0x39, 0x36, 0x30, 0x38, 0x37, 0x38,
0x37, 0x00, 0x2D, 0x38, 0x38, 0x35, 0x38, 0x30, 0x35, 0x33, 0x36, 0x30, 0x00, 0x2D, 0x32, 0x30,
0x34, 0x39, 0x36, 0x33, 0x31, 0x30, 0x30, 0x38, 0x00, 0x2D, 0x32, 0x35, 0x31, 0x31, 0x33, 0x31,
0x30, 0x33, 0x32, 0x00, 0x2D, 0x31, 0x37, 0x33, 0x38, 0x37, 0x33, 0x33, 0x32, 0x32, 0x30, 0x00,
0x2D, 0x32, 0x31, 0x31, 0x31, 0x31, 0x37, 0x30, 0x32, 0x31, 0x34, 0x00, 0x31, 0x34, 0x37, 0x31,
0x33, 0x34, 0x32, 0x30, 0x33, 0x39, 0x00, 0x36, 0x35, 0x36, 0x38, 0x39, 0x38, 0x36, 0x34, 0x36,
0x00, 0x31, 0x34, 0x37, 0x33, 0x31, 0x32, 0x31, 0x30, 0x35, 0x30, 0x00, 0x33, 0x35, 0x35, 0x32,
0x35, 0x31, 0x34, 0x38, 0x39, 0x00, 0x31, 0x38, 0x31, 0x38, 0x33, 0x37, 0x33, 0x35, 0x30, 0x37,
0x00, 0x2D, 0x38, 0x30, 0x33, 0x37, 0x38, 0x36, 0x36, 0x34, 0x31, 0x00, 0x31, 0x31, 0x38, 0x32,
0x36, 0x34, 0x39, 0x34, 0x34, 0x34, 0x00, 0x39, 0x31, 0x37, 0x30, 0x35, 0x34, 0x36, 0x32, 0x37,
0x00, 0x2D, 0x31, 0x39, 0x36, 0x35, 0x30, 0x37, 0x35, 0x34, 0x39, 0x37, 0x00, 0x32, 0x31, 0x31,
0x30, 0x32, 0x30, 0x36, 0x30, 0x38, 0x36, 0x00, 0x2D, 0x31, 0x30, 0x38, 0x37, 0x31, 0x32, 0x30,
0x32, 0x36, 0x34, 0x00, 0x36, 0x30, 0x35, 0x39, 0x36, 0x30, 0x39, 0x35, 0x38, 0x00, 0x33, 0x39,
0x37, 0x36, 0x36, 0x35, 0x37, 0x33, 0x37, 0x00, 0x31, 0x35, 0x33, 0x39, 0x37, 0x31, 0x30, 0x33,
0x37, 0x35, 0x00, 0x39, 0x35, 0x38, 0x37, 0x38, 0x36, 0x32, 0x32, 0x37, 0x00, 0x38, 0x32, 0x31,
0x39, 0x38, 0x30, 0x39, 0x34, 0x37, 0x00, 0x2D, 0x31, 0x37, 0x39, 0x39, 0x37, 0x38, 0x30, 0x38,
0x32, 0x37, 0x00, 0x31, 0x34, 0x30, 0x38, 0x30, 0x35, 0x39, 0x31, 0x34, 0x36, 0x00, 0x2D, 0x32,
0x31, 0x32, 0x37, 0x36, 0x38, 0x35, 0x36, 0x33, 0x35, 0x00, 0x31, 0x33, 0x36, 0x39, 0x31, 0x30,
0x33, 0x34, 0x34, 0x36, 0x00, 0x32, 0x39, 0x38, 0x32, 0x37, 0x30, 0x30, 0x34, 0x39, 0x00, 0x31,
0x34, 0x33, 0x37, 0x39, 0x33, 0x34, 0x37, 0x39, 0x31, 0x00, 0x2D, 0x31, 0x33, 0x39, 0x32, 0x33,
0x34, 0x39, 0x36, 0x31, 0x38, 0x00, 0x6E, 0x74, 0x64, 0x6C, 0x6C, 0x2E, 0x64, 0x6C, 0x6C, 0x00,
0x2D, 0x31, 0x39, 0x36, 0x38, 0x38, 0x35, 0x32, 0x38, 0x31, 0x37, 0x00, 0x2D, 0x31, 0x31, 0x33,
0x35, 0x39, 0x32, 0x35, 0x30, 0x32, 0x36, 0x00, 0x39, 0x36, 0x31, 0x30, 0x31, 0x34, 0x33, 0x32,
0x35, 0x00, 0x2D, 0x35, 0x39, 0x33, 0x32, 0x35, 0x30, 0x38, 0x33, 0x00, 0x2D, 0x38, 0x35, 0x31,
0x36, 0x32, 0x34, 0x32, 0x33, 0x38, 0x00, 0x31, 0x34, 0x35, 0x34, 0x38, 0x34, 0x33, 0x36, 0x36,
0x32, 0x00, 0x2D, 0x31, 0x34, 0x36, 0x37, 0x34, 0x38, 0x34, 0x33, 0x30, 0x35, 0x00, 0x75, 0x73,
0x65, 0x72, 0x33, 0x32, 0x2E, 0x64, 0x6C, 0x6C, 0x00, 0x2D, 0x35, 0x33, 0x31, 0x31, 0x33, 0x31,
0x35, 0x39, 0x37, 0x00, 0x2D, 0x35, 0x33, 0x35, 0x30, 0x34, 0x36, 0x36, 0x30, 0x35, 0x00, 0x2D,
0x31, 0x34, 0x36, 0x33, 0x30, 0x34, 0x35, 0x39, 0x32, 0x37, 0x00, 0x77, 0x73, 0x32, 0x5F, 0x33,
0x32, 0x2E, 0x64, 0x6C, 0x6C, 0x00, 0x2D, 0x38, 0x35, 0x33, 0x30, 0x36, 0x32, 0x37, 0x38, 0x34,
0x00, 0x2D, 0x38, 0x34, 0x33, 0x36, 0x33, 0x30, 0x34, 0x30, 0x30, 0x00, 0x2D, 0x38, 0x31, 0x38,
0x31, 0x36, 0x34, 0x31, 0x37, 0x33, 0x00, 0x31, 0x38, 0x35, 0x31, 0x33, 0x38, 0x33, 0x37, 0x38,
0x33, 0x00, 0x31, 0x35, 0x33, 0x34, 0x32, 0x31, 0x36, 0x35, 0x36, 0x38, 0x00, 0x2D, 0x37, 0x31,
0x38, 0x39, 0x31, 0x34, 0x36, 0x38, 0x38, 0x00, 0x31, 0x38, 0x33, 0x31, 0x32, 0x39, 0x31, 0x32,
0x35, 0x33, 0x00, 0x31, 0x33, 0x32, 0x38, 0x31, 0x37, 0x32, 0x30, 0x38, 0x32, 0x00, 0x2D, 0x38,
0x31, 0x35, 0x35, 0x39, 0x34, 0x31, 0x35, 0x33, 0x00, 0x31, 0x36, 0x34, 0x37, 0x38, 0x38, 0x39,
0x38, 0x39, 0x37, 0x00, 0x2D, 0x31, 0x31, 0x35, 0x30, 0x37, 0x31, 0x34, 0x34, 0x31, 0x36, 0x00,
0x2D, 0x36, 0x32, 0x32, 0x37, 0x30, 0x32, 0x34, 0x34, 0x38, 0x00, 0x2D, 0x35, 0x30, 0x39, 0x36,
0x34, 0x39, 0x39, 0x39, 0x36, 0x00, 0x2D, 0x32, 0x30, 0x39, 0x39, 0x32, 0x32, 0x37, 0x30, 0x35,
0x33, 0x00, 0x2D, 0x32, 0x30, 0x39, 0x37, 0x38, 0x31, 0x34, 0x33, 0x34, 0x39, 0x00, 0x2D, 0x35,
0x37, 0x33, 0x39, 0x32, 0x34, 0x36, 0x34, 0x35, 0x00, 0x2D, 0x31, 0x37, 0x35, 0x34, 0x39, 0x32,
0x32, 0x33, 0x32, 0x31, 0x00, 0x2D, 0x31, 0x37, 0x35, 0x34, 0x39, 0x32, 0x32, 0x33, 0x32, 0x34,
0x00, 0x31, 0x35, 0x32, 0x36, 0x33, 0x36, 0x38, 0x34, 0x31, 0x32, 0x00, 0x31, 0x32, 0x39, 0x36,
0x37, 0x36, 0x30, 0x31, 0x31, 0x35, 0x00, 0x31, 0x34, 0x34, 0x37, 0x37, 0x31, 0x37, 0x36, 0x32,
0x37, 0x00, 0x2D, 0x38, 0x37, 0x37, 0x33, 0x33, 0x31, 0x37, 0x34, 0x39, 0x00, 0x31, 0x33, 0x33,
0x32, 0x39, 0x32, 0x36, 0x37, 0x30, 0x37, 0x00, 0x32, 0x30, 0x30, 0x36, 0x32, 0x33, 0x31, 0x30,
0x39, 0x31, 0x00, 0x41, 0x64, 0x76, 0x61, 0x70, 0x69, 0x33, 0x32, 0x2E, 0x64, 0x6C, 0x6C, 0x00,
0x31, 0x36, 0x30, 0x32, 0x33, 0x36, 0x32, 0x39, 0x30, 0x30, 0x00, 0x31, 0x39, 0x34, 0x33, 0x30,
0x38, 0x38, 0x38, 0x30, 0x35, 0x00, 0x31, 0x35, 0x39, 0x35, 0x31, 0x36, 0x37, 0x31, 0x37, 0x00,
0x38, 0x32, 0x37, 0x31, 0x39, 0x39, 0x36, 0x33, 0x33, 0x00, 0x2D, 0x31, 0x35, 0x32, 0x31, 0x35,
0x39, 0x39, 0x31, 0x30, 0x37, 0x00, 0x39, 0x37, 0x38, 0x36, 0x39, 0x32, 0x39, 0x36, 0x39, 0x00,
0x37, 0x34, 0x32, 0x38, 0x33, 0x36, 0x35, 0x31, 0x33, 0x00, 0x37, 0x34, 0x30, 0x34, 0x37, 0x37,
0x31, 0x38, 0x35, 0x00, 0x31, 0x33, 0x38, 0x31, 0x31, 0x36, 0x33, 0x36, 0x36, 0x39, 0x00, 0x52,
0x70, 0x63, 0x72, 0x74, 0x34, 0x2E, 0x64, 0x6C, 0x6C, 0x00, 0x31, 0x38, 0x36, 0x36, 0x33, 0x34,
0x32, 0x38, 0x36, 0x33, 0x00, 0x57, 0x69, 0x6E, 0x68, 0x74, 0x74, 0x70, 0x2E, 0x64, 0x6C, 0x6C,
0x00, 0x33, 0x30, 0x38, 0x36, 0x31, 0x33, 0x31, 0x36, 0x38, 0x00, 0x31, 0x38, 0x34, 0x34, 0x38,
0x37, 0x33, 0x32, 0x33, 0x35, 0x00, 0x2D, 0x36, 0x32, 0x36, 0x33, 0x34, 0x32, 0x36, 0x33, 0x00,
0x32, 0x36, 0x38, 0x39, 0x38, 0x32, 0x38, 0x34, 0x36, 0x00, 0x31, 0x39, 0x35, 0x34, 0x30, 0x32,
0x32, 0x34, 0x38, 0x35, 0x00, 0x32, 0x33, 0x35, 0x36, 0x39, 0x38, 0x35, 0x39, 0x39, 0x00, 0x35,
0x34, 0x31, 0x37, 0x35, 0x37, 0x33, 0x35, 0x39, 0x00, 0x31, 0x31, 0x34, 0x32, 0x32, 0x31, 0x30,
0x39, 0x38, 0x30, 0x00, 0x2D, 0x33, 0x31, 0x34, 0x36, 0x35, 0x30, 0x32, 0x38, 0x00, 0x2D, 0x36,
0x30, 0x39, 0x31, 0x37, 0x39, 0x32, 0x31, 0x00, 0x2D, 0x36, 0x34, 0x35, 0x33, 0x37, 0x30, 0x34,
0x38, 0x39, 0x00, 0x35, 0x38, 0x36, 0x36, 0x30, 0x38, 0x39, 0x31, 0x36, 0x00, 0x38, 0x31, 0x33,
0x35, 0x33, 0x35, 0x38, 0x36, 0x37, 0x00, 0x2D, 0x32, 0x31, 0x33, 0x31, 0x33, 0x31, 0x32, 0x31,
0x35, 0x38, 0x00, 0x2D, 0x32, 0x31, 0x33, 0x30, 0x36, 0x30, 0x33, 0x32, 0x38, 0x34, 0x00, 0x31,
0x35, 0x32, 0x37, 0x33, 0x39, 0x30, 0x30, 0x32, 0x00, 0x49, 0x70, 0x68, 0x6C, 0x70, 0x61, 0x70,
0x69, 0x2E, 0x64, 0x6C, 0x6C, 0x00, 0x38, 0x30, 0x36, 0x34, 0x37, 0x33, 0x33, 0x35, 0x36, 0x00,
0x43, 0x72, 0x79, 0x70, 0x74, 0x33, 0x32, 0x2E, 0x64, 0x6C, 0x6C, 0x00, 0x31, 0x34, 0x33, 0x34,
0x31, 0x38, 0x33, 0x31, 0x38, 0x39, 0x00, 0x2D, 0x31, 0x32, 0x30, 0x38, 0x36, 0x30, 0x33, 0x32,
0x00, 0x53, 0x68, 0x6C, 0x77, 0x61, 0x70, 0x69, 0x2E, 0x64, 0x6C, 0x6C, 0x00, 0x2D, 0x31, 0x31,
0x36, 0x30, 0x32, 0x39, 0x30, 0x30, 0x37, 0x30, 0x00, 0x55, 0x72, 0x6C, 0x6D, 0x6F, 0x6E, 0x2E,
0x64, 0x6C, 0x6C, 0x00, 0x2D, 0x37, 0x37, 0x36, 0x37, 0x36, 0x35, 0x30, 0x36, 0x34, 0x00, 0x6D,
0x73, 0x76, 0x63, 0x72, 0x74, 0x2E, 0x64, 0x6C, 0x6C, 0x00, 0x31, 0x38, 0x30, 0x31, 0x31, 0x32,
0x30, 0x31, 0x31, 0x35, 0x00, 0x31, 0x36, 0x35, 0x36, 0x39, 0x34, 0x35, 0x34, 0x39, 0x35, 0x00,
0x31, 0x32, 0x36, 0x36, 0x38, 0x37, 0x31, 0x33, 0x34, 0x37, 0x00, 0x31, 0x32, 0x36, 0x32, 0x31,
0x35, 0x32, 0x35, 0x36, 0x33, 0x00, 0x2D, 0x31, 0x34, 0x34, 0x31, 0x36, 0x31, 0x33, 0x32, 0x32,
0x32, 0x00, 0x2D, 0x37, 0x31, 0x38, 0x33, 0x31, 0x36, 0x37, 0x33, 0x36, 0x00, 0x2D, 0x33, 0x34,
0x35, 0x38, 0x31, 0x37, 0x37, 0x39, 0x38, 0x00, 0x2D, 0x33, 0x34, 0x37, 0x31, 0x39, 0x38, 0x35,
0x32, 0x38, 0x00, 0x31, 0x38, 0x30, 0x37, 0x36, 0x35, 0x37, 0x39, 0x36, 0x38, 0x00, 0x31, 0x31,
0x36, 0x30, 0x31, 0x39, 0x39, 0x30, 0x39, 0x38, 0x00, 0x2D, 0x39, 0x38, 0x37, 0x32, 0x38, 0x34,
0x36, 0x30, 0x38, 0x00, 0x31, 0x31, 0x31, 0x32, 0x39, 0x31, 0x31, 0x38, 0x33, 0x32, 0x00, 0x2D,
0x35, 0x32, 0x30, 0x37, 0x30, 0x31, 0x30, 0x33, 0x31, 0x00, 0x2D, 0x35, 0x32, 0x30, 0x37, 0x30,
0x34, 0x37, 0x31, 0x31, 0x00, 0x00
])
from Pro.Core import *
from Pro.PE import *
from Pro.ccast import *
ror = lambda val, r_bits, max_bits: \
((val & (2**max_bits-1)) >> r_bits%max_bits) | \
(val << (max_bits-(r_bits%max_bits)) & (2**max_bits-1))
def getAPIs(dllpath):
apis = {}
c = createContainerFromFile(dllpath)
dll = PEObject()
if not dll.Load(c):
print("error: couldn't load dll")
return apis
ordbase = dll.ExportDirectory().Num("Base")
functions = dll.ExportDirectoryFunctions()
names = dll.ExportDirectoryNames()
nameords = dll.ExportDirectoryNameOrdinals()
n = functions.Count()
it = functions.iterator()
for x in range(n):
func = it.next()
ep = func.Num(0)
if ep == 0:
continue
apiord = str(ordbase + x)
n2 = nameords.Count()
it2 = nameords.iterator()
name_found = False
for y in range(n2):
no = it2.next()
if no.Num(0) == x:
name = names.At(y)
offs = dll.RvaToOffset(name.Num(0))
name, ret = dll.ReadUInt8String(offs, 500)
apiname = name.decode("ascii")
apis[apiname] = apiord
apis[apiord] = apiname
name_found = True
break
if not name_found:
apis[apiord] = apiord
return apis
def hash(name):
x = 0
for c in name:
x = ror(x, 0xD, 32)
x += ord(c)
x = ror(x, 0xD, 32)
return x
def hashAPIs(apis):
hapis = {}
for i, name in apis.items():
hapis[hash(name)] = name
return hapis
def walkBlob():
i = 0
idxs = {}
pos = 0
while i < len(blob):
e = blob.find(b"\x00", i)
if i == e:
break
s = blob[i:e].decode("ascii")
i = e + 1
if "." in s:
dllname = s
apis = getAPIs("C:\\Windows\\System32\\" + dllname)
apis = hashAPIs(apis)
else:
x = dword(int(s))
apiname = apis[x]
idxs[pos] = apiname
pos += 0x10
print(apiname)
return idxs
idxs = walkBlob()
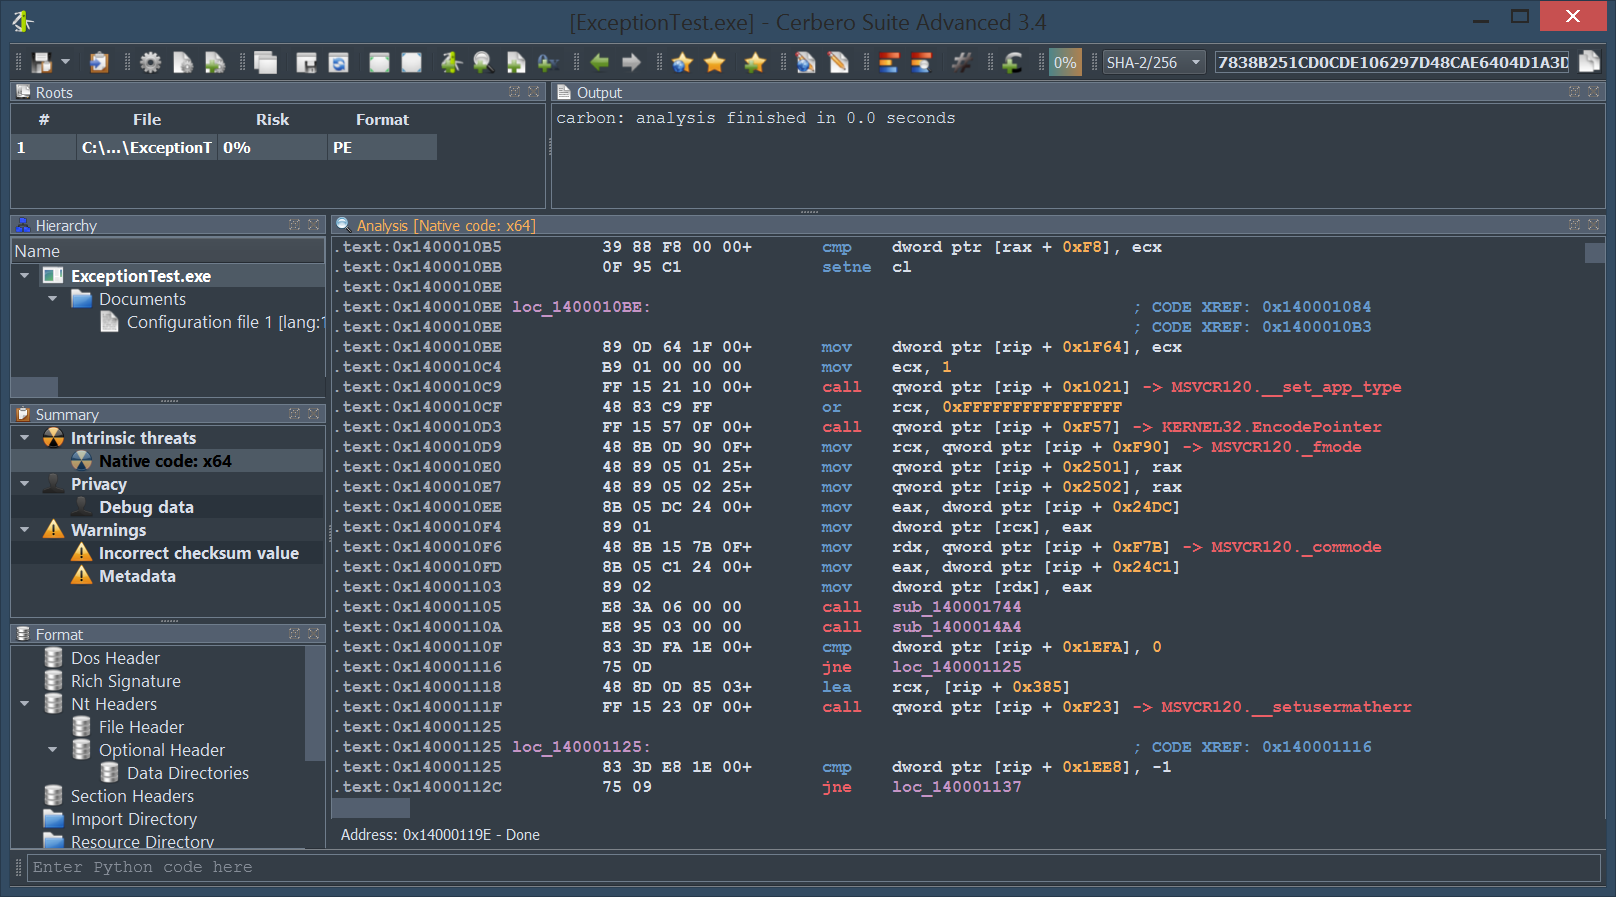
print(idxs) This script uses the index dictionary from the previous script to comment register-based call instructions in the disassembly with the resolved API name.
idxs = {0: 'VirtualAlloc', 16: 'Sleep', 32: 'CreateThread', 48: 'CloseHandle', 64: 'ReadFile', 80: 'CreateFileA', 96: 'WriteFile', 112: 'GetFileSize', 128: 'lstrlenA', 144: 'lstrlenW', 160: 'lstrcpyA', 176: 'lstrcpyW', 192: 'lstrcatA', 208: 'lstrcatW', 224: 'lstrcmpA', 240: 'lstrcmpW', 256: 'VirtualFree', 272: 'WaitForSingleObject', 288: 'TerminateThread', 304: 'GetTickCount', 320: 'FormatMessageA', 336: 'GetLastError', 352: 'EnterCriticalSection', 368: 'LeaveCriticalSection', 384: 'InitializeCriticalSection', 400: 'DeleteCriticalSection', 416: 'LocalFree', 432: 'MultiByteToWideChar', 448: 'WideCharToMultiByte', 464: 'GetComputerNameW', 480: 'GetModuleFileNameW', 496: 'GetCurrentProcessId', 512: 'GetLocalTime', 528: 'QueryPerformanceFrequency', 544: 'QueryPerformanceCounter', 560: 'IsWow64Process', 576: 'GetCurrentProcess', 592: 'GetVersionExA', 608: 'GlobalFree', 624: 'VirtualFreeEx', 640: 'DuplicateHandle', 656: 'DebugBreak', 672: 'CreateEventW', 688: 'DeviceIoControl', 704: 'DeleteFileA', 720: 'GetTempPathA', 736: 'GetTempFileNameA', 752: 'SetErrorMode', 768: 'FreeLibrary', 784: 'RtlGetNtVersionNumbers', 800: 'RtlNtStatusToDosError', 816: 'RtlDecompressBuffer', 832: 'RtlCompressBuffer', 848: 'RtlGetCompressionWorkSpaceSize', 864: 'NtQuerySystemInformation', 880: 'NtQueryObject', 896: 'PeekMessageW', 912: 'GetMessageW', 928: 'PostThreadMessageW', 944: 'send', 960: 'recv', 976: 'closesocket', 992: 'WSAStartup', 1008: 'socket', 1024: 'bind', 1040: 'listen', 1056: 'accept', 1072: 'connect', 1088: 'WSACleanup', 1104: 'inet_addr', 1120: 'inet_ntoa', 1136: 'htons', 1152: 'getaddrinfo', 1168: 'freeaddrinfo', 1184: 'WSAAddressToStringA', 1200: 'setsockopt', 1216: 'getsockopt', 1232: 'recvfrom', 1248: 'sendto', 1264: 'shutdown', 1280: 'WSAGetLastError', 1296: 'select', 1312: 'getpeername', 1328: 'CryptAcquireContextW', 1344: 'CryptDestroyHash', 1360: 'CryptCreateHash', 1376: 'CryptHashData', 1392: 'CryptGetHashParam', 1408: 'CryptDeriveKey', 1424: 'CryptEncrypt', 1440: 'CryptDecrypt', 1456: 'GetUserNameW', 1472: 'UuidCreate', 1488: 'WinHttpGetIEProxyConfigForCurrentUser', 1504: 'WinHttpOpen', 1520: 'WinHttpGetProxyForUrl', 1536: 'WinHttpCloseHandle', 1552: 'WinHttpConnect', 1568: 'WinHttpOpenRequest', 1584: 'WinHttpAddRequestHeaders', 1600: 'WinHttpSendRequest', 1616: 'WinHttpWriteData', 1632: 'WinHttpQueryDataAvailable', 1648: 'WinHttpQueryOption', 1664: 'WinHttpReceiveResponse', 1680: 'WinHttpReadData', 1696: 'WinHttpSetOption', 1712: 'WinHttpSetCredentials', 1728: 'WinHttpQueryAuthSchemes', 1744: 'GetAdaptersInfo', 1760: 'CryptBinaryToStringA', 1776: 'CryptStringToBinaryA', 1792: 'StrStrIA', 1808: 'URLDownloadToFileA', 1824: 'memset', 1840: 'memmove', 1856: 'memcpy', 1872: 'memcmp', 1888: '_wcsicmp', 1904: 'time', 1920: 'strstr', 1936: 'atoi', 1952: '_itow', 1968: 'srand', 1984: 'rand', 2000: '_wcsnicmp', 2016: 'sprintf', 2032: 'printf'}

from Pro.UI import proContext
from Pro.Carbon import *
from Pro.capstone import *
import re

def commentAPIs():
    md = Cs(CS_ARCH_X86, CS_MODE_64)
    v = proContext().getCurrentView()
    ca = v.getCarbon()
    db = ca.getDB()
    e = caASEntry()
    e.end = 0
    while db.getNextASEntry(e.end, e):
        if e.type_id != CarbonType_I_x64:
            continue
        buf = ca.read(e.start, e.end - e.start)
        insns = md.disasm(buf, 0)
        i = next(insns, None)
        if i.mnemonic != "call":
            continue
        print(i.mnemonic, i.op_str)
        if i.op_str.find("rip") != -1:
            continue
        j = i.op_str.find("+ 0x")
        if j == -1:
            continue
        idx = int(i.op_str[j+2:-1], 16)
        if idx > 0x1000:
            continue
        apiname = idxs.get(idx, None)
        if not apiname:
            continue
        c = caComment()
        if db.getComment(e.start, c) and c.text:
            continue
        c.address = e.start
        c.text = apiname
        db.setComment(c)
        print("   ", apiname)
    # update the view
    v.update()

commentAPIs()