The upcoming 1.0.0 version of the Profiler introduces support for SQLite3 databases.
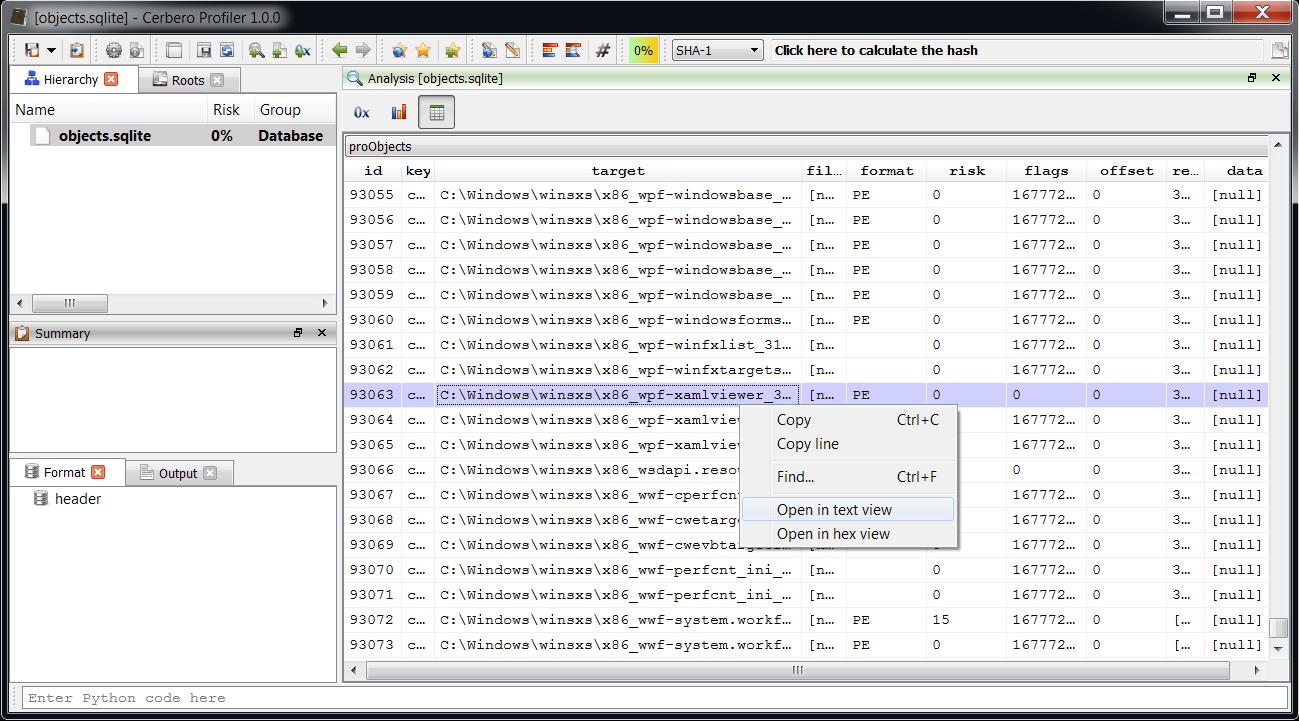
You’ll see that even viewing large tables is pleasantly fast. The SQL table control is available to the Python SDK as well: it can either be created via createView or inside a custom view with the tag sqltable.
Once the sql table view is created, it offers the following methods:
    getSQLColumns() -> NTString
    getSQLCondition() -> NTString
    getSQLTable() -> NTString
    setSQLTable(NTString const & table, NTString const & columns=NTString(), NTString const & condition=NTString()) -> bool
    setSQLTable(NTString const & table, NTString const & columns=NTString()) -> bool
    setSQLTable(NTString const & table) -> bool
    setSQLTableSelectVisible(bool b)
    setSQLite3Object(CFFObject obj)
So it’s possible to display a particular table in it or offer the possibility to the user to choose the table via setSQLTableSelectVisible.
The database can be accessed as well. The Profiler exposes its internal SQLite code in the homonymous module. It differs from the standard Python implementation and it matches the C API. For instance, to enumerate the table names in a database we can use this code:
from Pro.SQLite import *

db = obj.GetHandle() # retrieves the internal SQLite handle, never to be closed!

ret, stmt = sqlite3_prepare(db, "SELECT name FROM sqlite_master WHERE type = 'table'")
if sqlite3_step(stmt) == SQLITE_ROW:
    print(sqlite3_column_text(stmt, 0))
    sqlite3_finalize(stmt)
The handle returned by GetHandle grants only read access. In fact, to maximize speed and avoiding copy operations, the Profiler replaces the virtual file-system of the SQLite database in order for it to read directly from the CFFObject.
The exposed C API can be used to open external databases as well and will be used to access the main report database file in order to give plugins the capability to store and retrieve their own data.
Free pages inspection
When the database file contains free pages, it will be reported in the summary. Free pages usually contain deleted data and can therefore be of interest for forensic purposes.
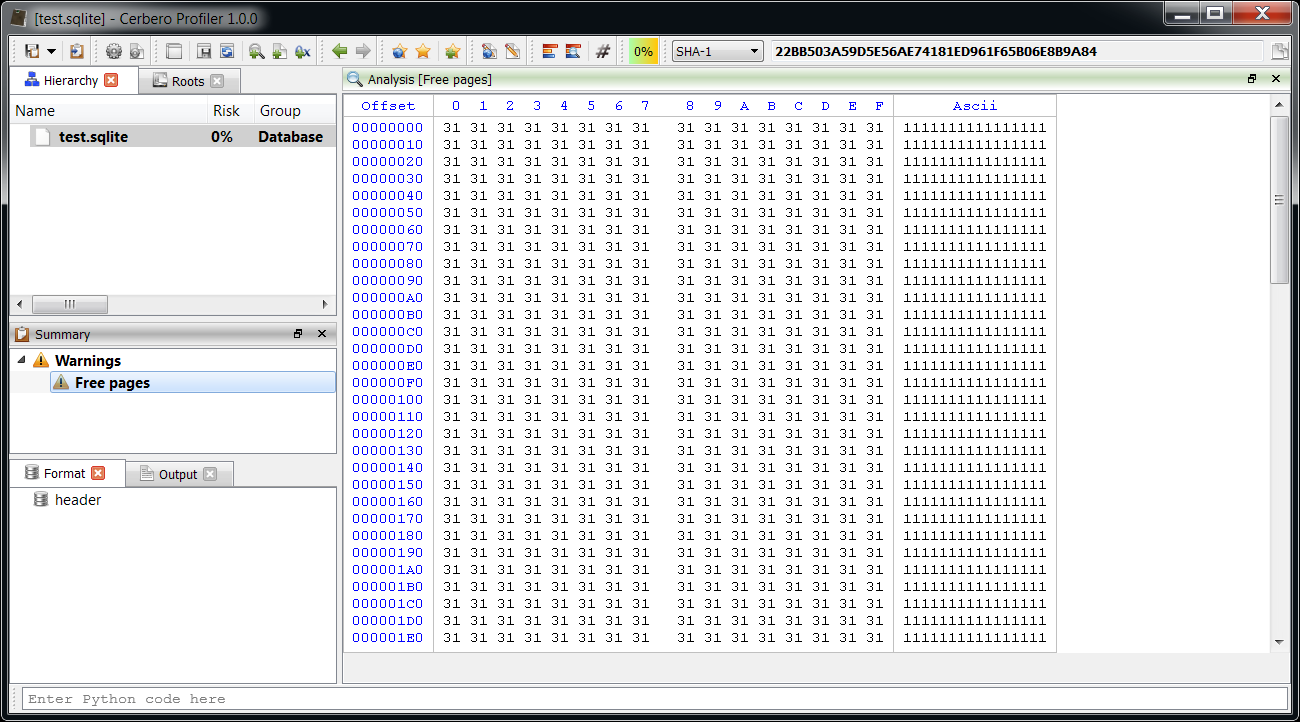
The image above shows a test database I’ve created. In it I created a few tables, and inserted some records containing repeated values (but keeping each record different). Then I deleted a specific record containing ‘1’s. The result is that the database now contains free pages and when inspecting them with the Profiler we can see a big part of the original data.
Keep in mind that data contained in free pages can be incomplete and is scattered. The free pages data can be retrieved programmatically as well through the method GetFreePages.
Stay tuned as there’s much more coming soon!