Profiler 2.4

Profiler 2.4 is out with the following news:
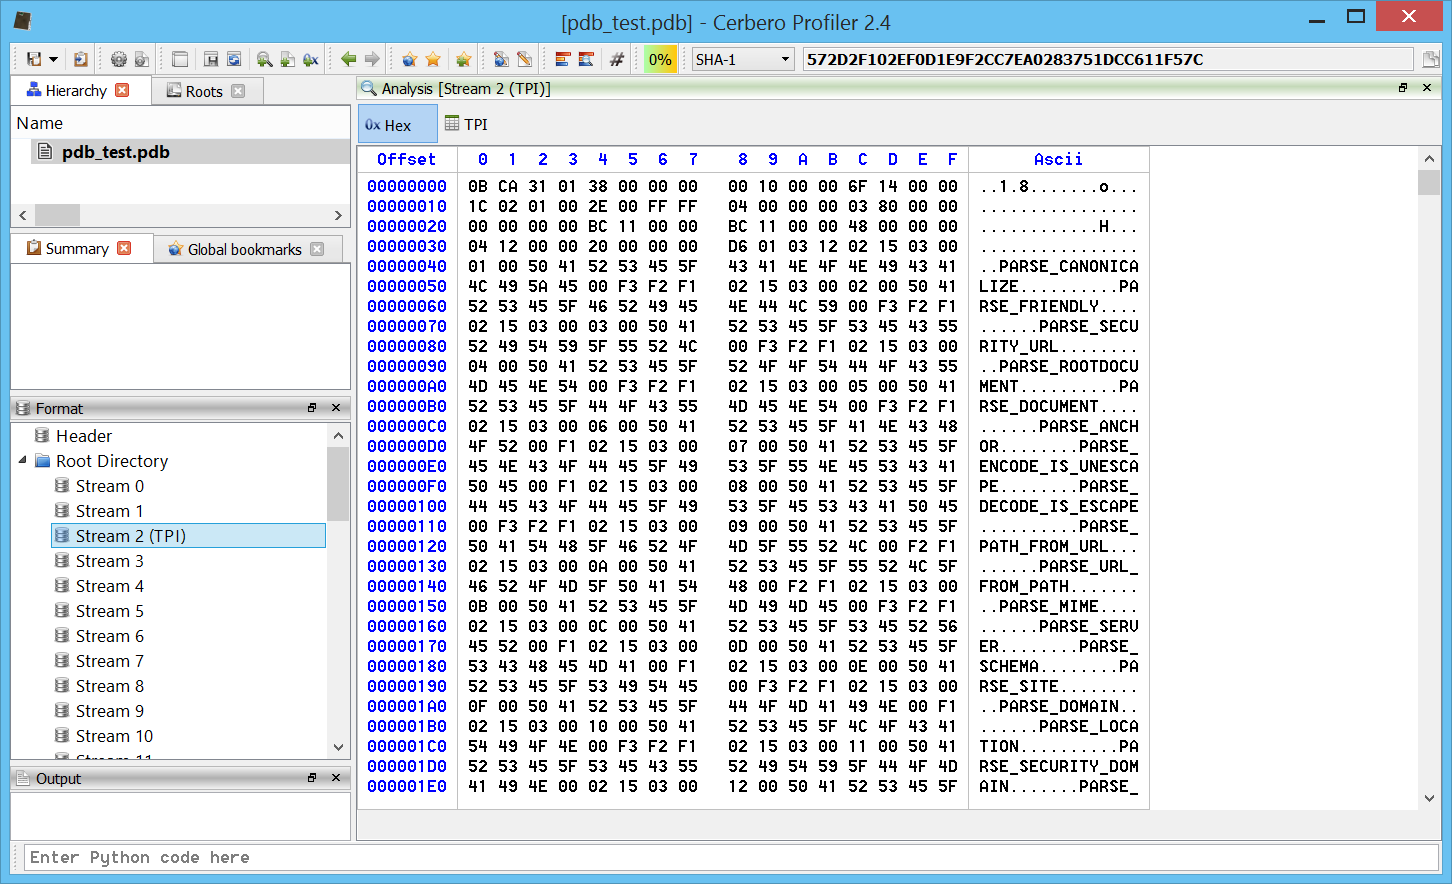
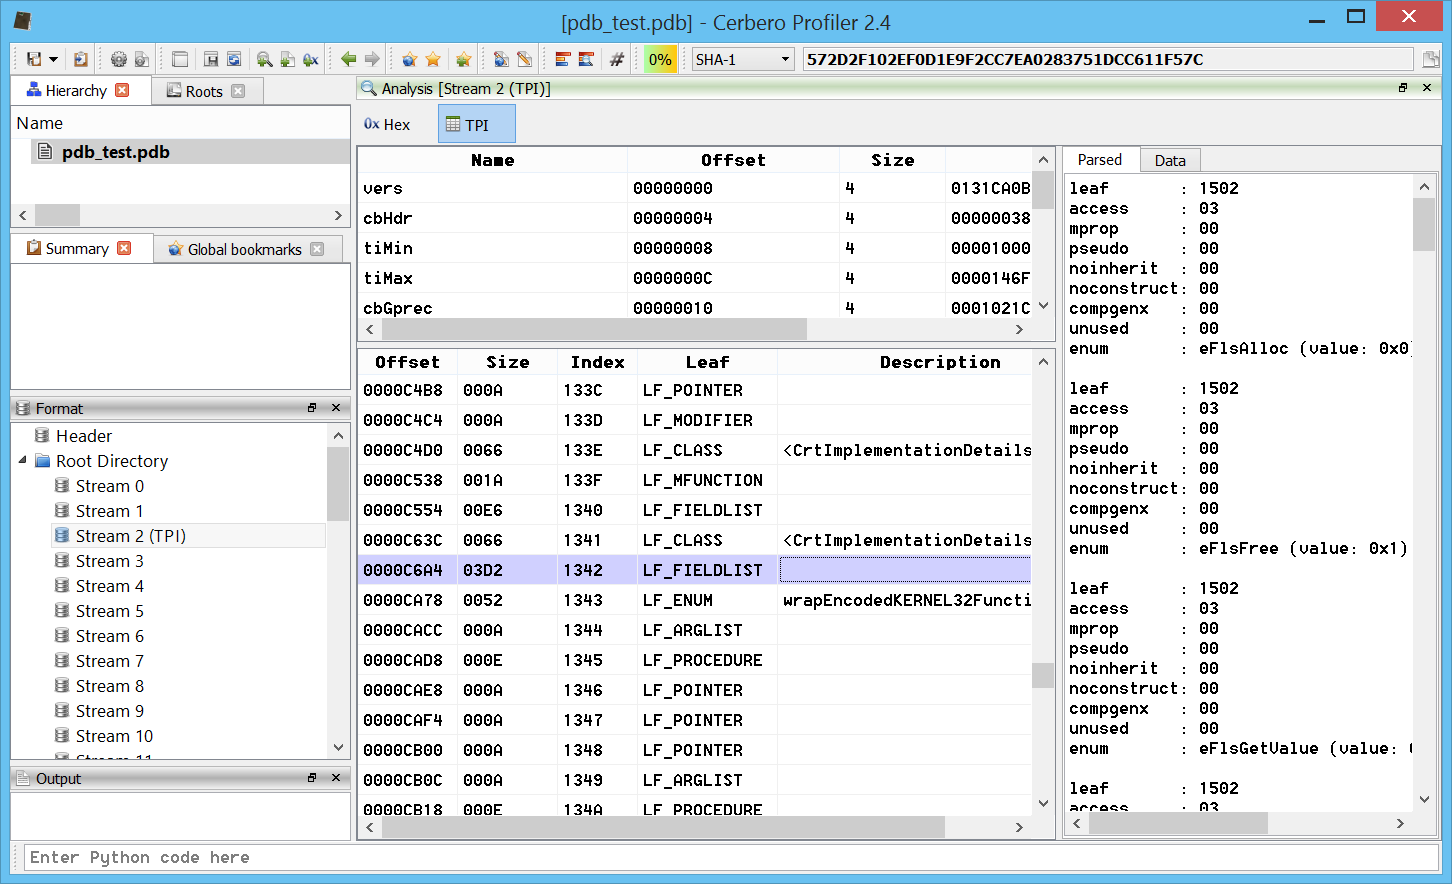
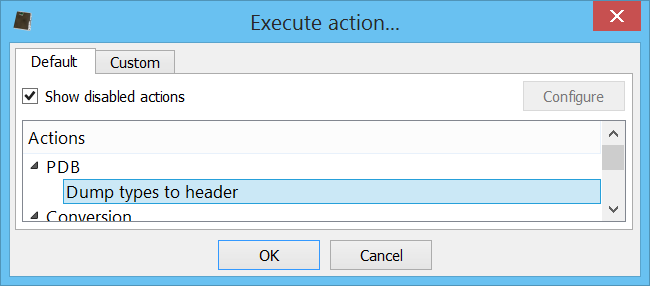
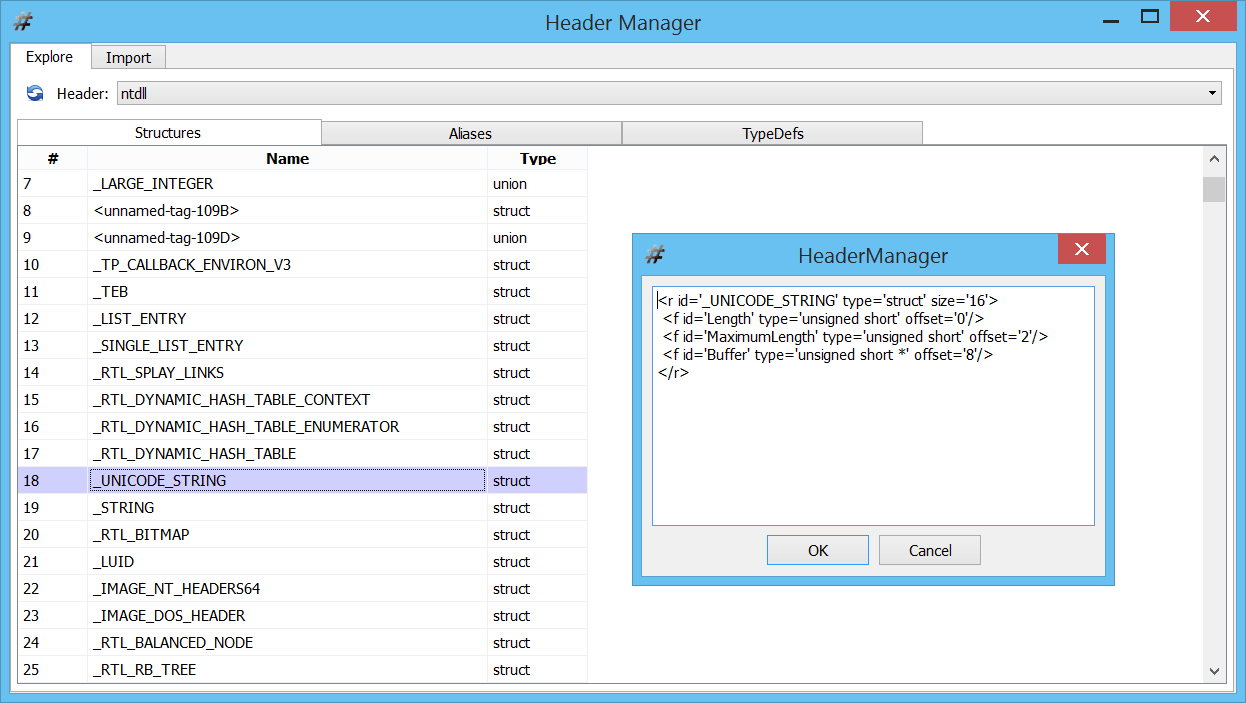
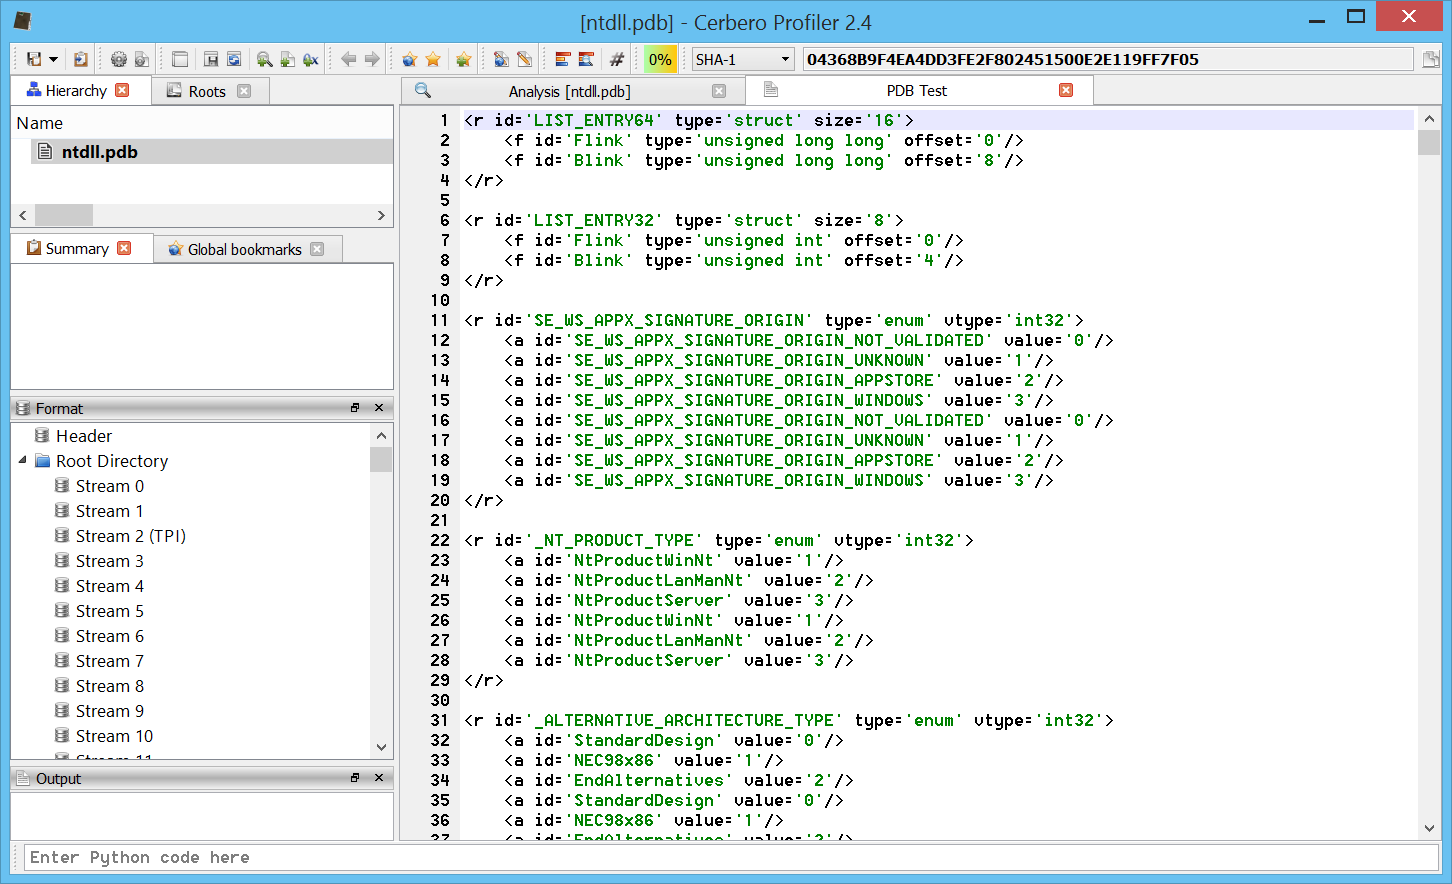
added initial support for PDB files (including export of types)
added support for Windows Encoded Scripts (VBE, JSE)
– introduced fixed xml structures
added automatic string decoding in struct tables
added Python string command line execution
– remember the last selected logic group
– fixed missing support for wchar_t in C types
– updated Qt to 5.4.1
– various bug fixes

While the most important newly introduced feature is the support for PDB files, here are some interesting new features:

Support for Windows Encoded Scripts (VBE, JSE)

Windows encoded scripts like VBE and JSE files (the encoded variants of VBS and JS script files) are now supported and automatically decoded.

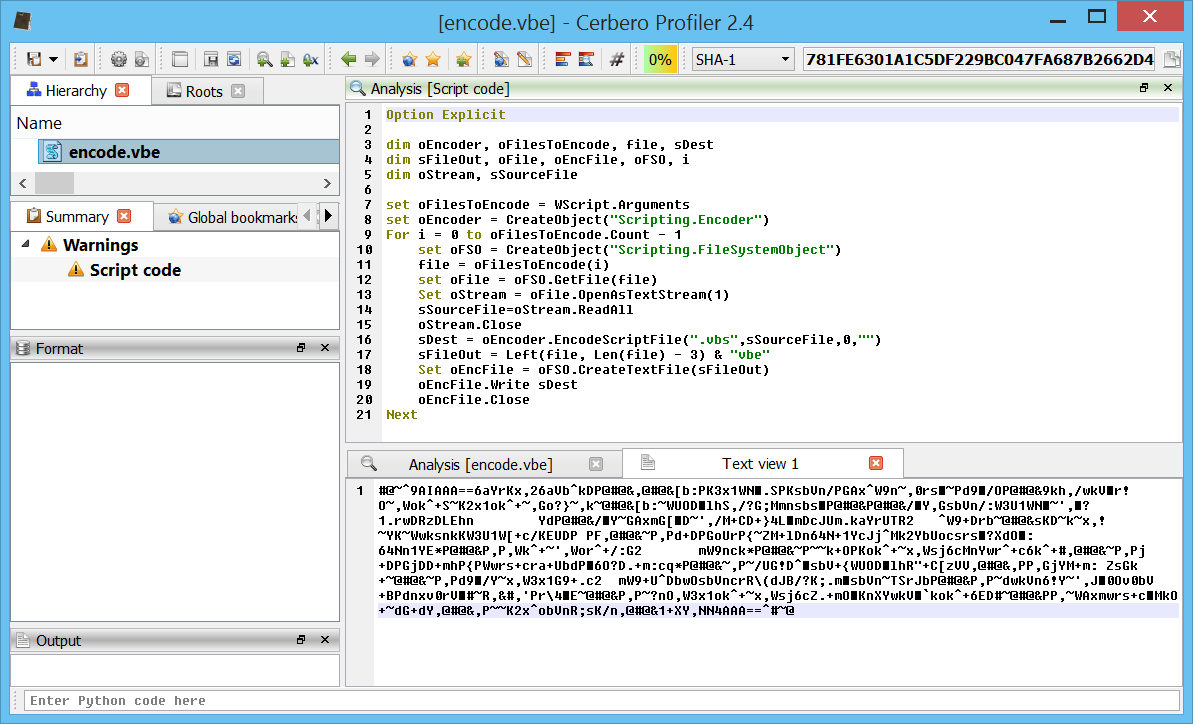
In the screen-shot you can see the decoded output of an encoded file (showed at the bottom).

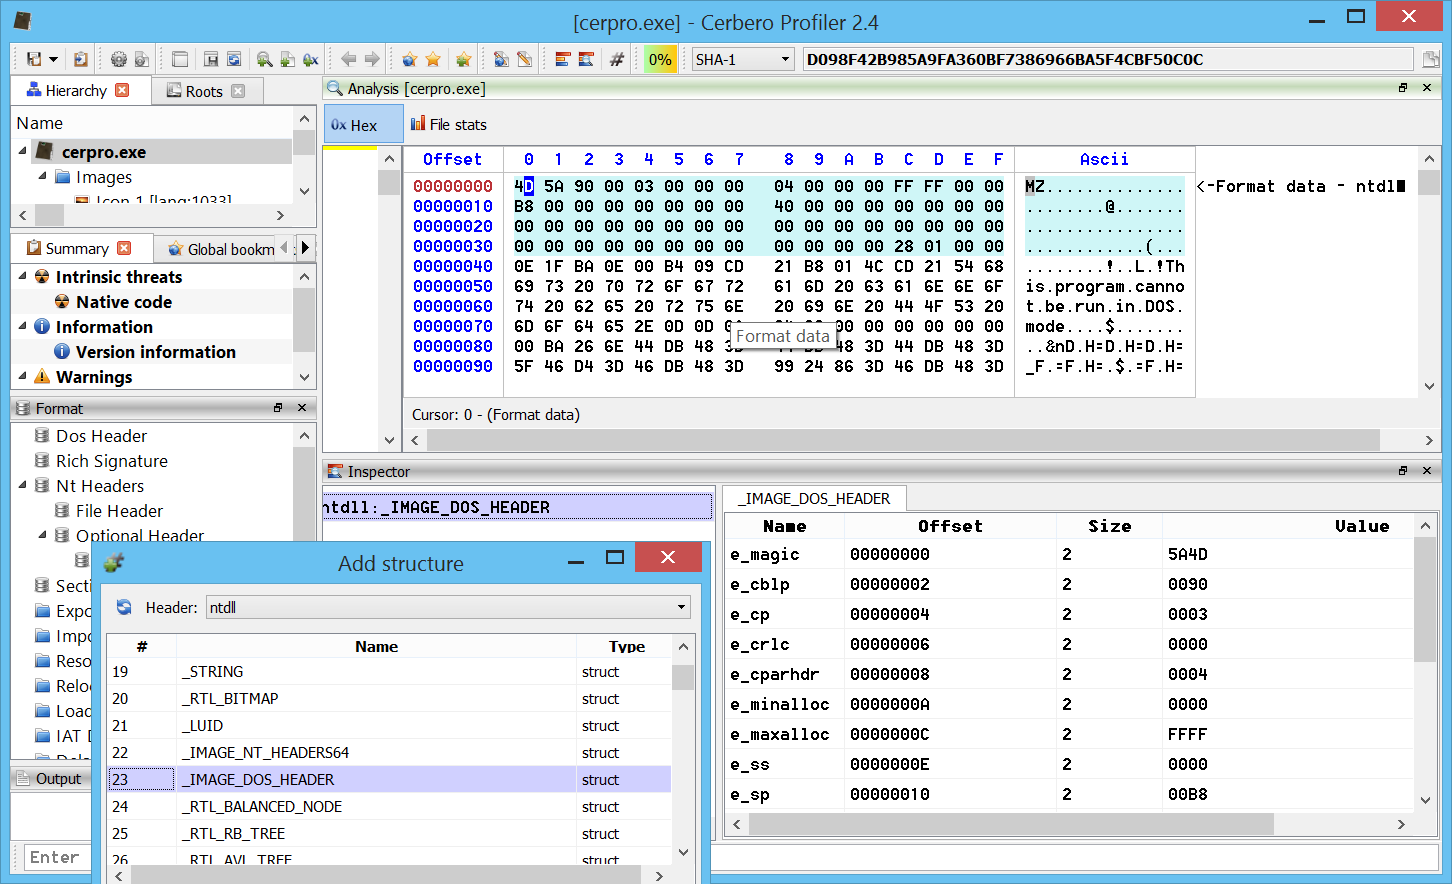
Automatic string decoding in struct tables

A very basic feature: byte-arrays in structures are automatically checked for strings and in case decoded.

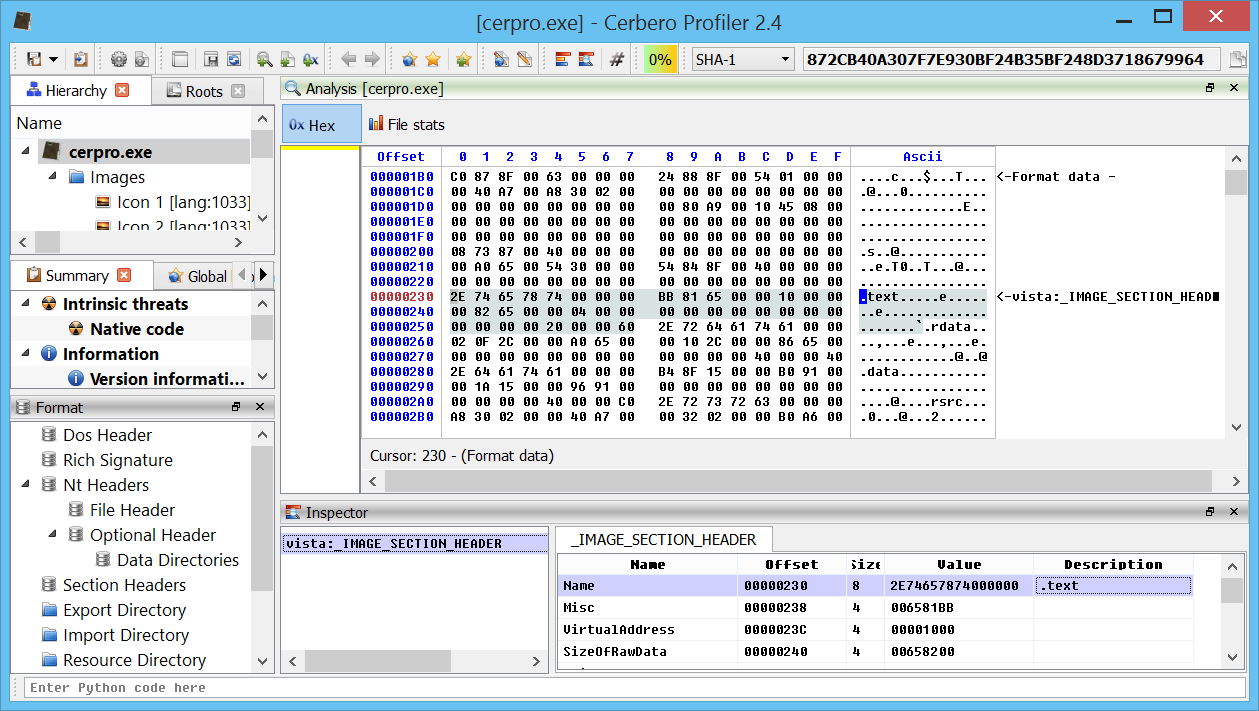
(notice the section name automatically displayed as ascii string)

Python string command line execution

Apart from executing script files passed as command line arguments, now it is also possible to execute Python statements directly passed as argument.

For instance:

cerpro -c -e "from Pro.Core import *;proCoreContext().msgBox(0, \"Hello world!\")"

The optional argument ‘-c’ specifies to not display the UI.

Enjoy!

PDB support (including export of types)

The main feature of the upcoming 2.4 version of Profiler is the initial support for the PDB format. Our code doesn’t rely on the Microsoft DIA SDK and thus works also on OS X and Linux.

Since the PDB format is undocumented, this task would’ve been extremely difficult without the fantastic work on PDBs of the never too much revered Sven B. Schreiber.

Let’s open a PDB file.

As you can see the streams in the PDB can be explored. The TPI stream (the one describing types) offers further inspection.

All the types contained in the PDB can be exported to a Profiler header by pressing Ctrl+R and executing the ‘Dump types to header’ action.

Now the types can be used from both the hex editor and the Python SDK.

We can explore the dumped header by using, as usual, the Header Manager tool.

The type showed above in the hex editor is simple. So let’s look what a more complex PDB type may look like.


The PDB code is also exposed to the SDK. This is a small snippet of code, which dumps all the types to a text buffer and then displays them in a text view.

from Pro.Core import *
from Pro.UI import *
from Pro.PDB import *

def showPDBTypes():
    ctx = proContext()
    out = proTextStream()
    out.setIndentSize(4)

    obj = ctx.currentScanProvider().getObject()
    tpi = obj.GetStreamObject(PDB_STREAM_ID_TPI)
    tpihdr = obj.TPIHeader(tpi)
    tiMin = tpihdr.Num("tiMin")
    tiMax = tpihdr.Num("tiMax")
    tctx = obj.CreateTypeContext(tpi)
    for ti in range(tiMin, tiMax):
        tctx.DumpType(out, ti)

    view = ctx.createView(ProView.Type_Text, "PDB Test")
    view.setLanguage("XML")
    view.setText(out.buffer)
    ctx.addView(view)

showPDBTypes()

In order to dump all types to a single header, you can use the DumpAllToHeader method.