Although there haven’t been customer requests for this, the upcoming 0.9.0 version of the Profiler adds support for .NET, which includes format, layout ranges and an MSIL disassembler.
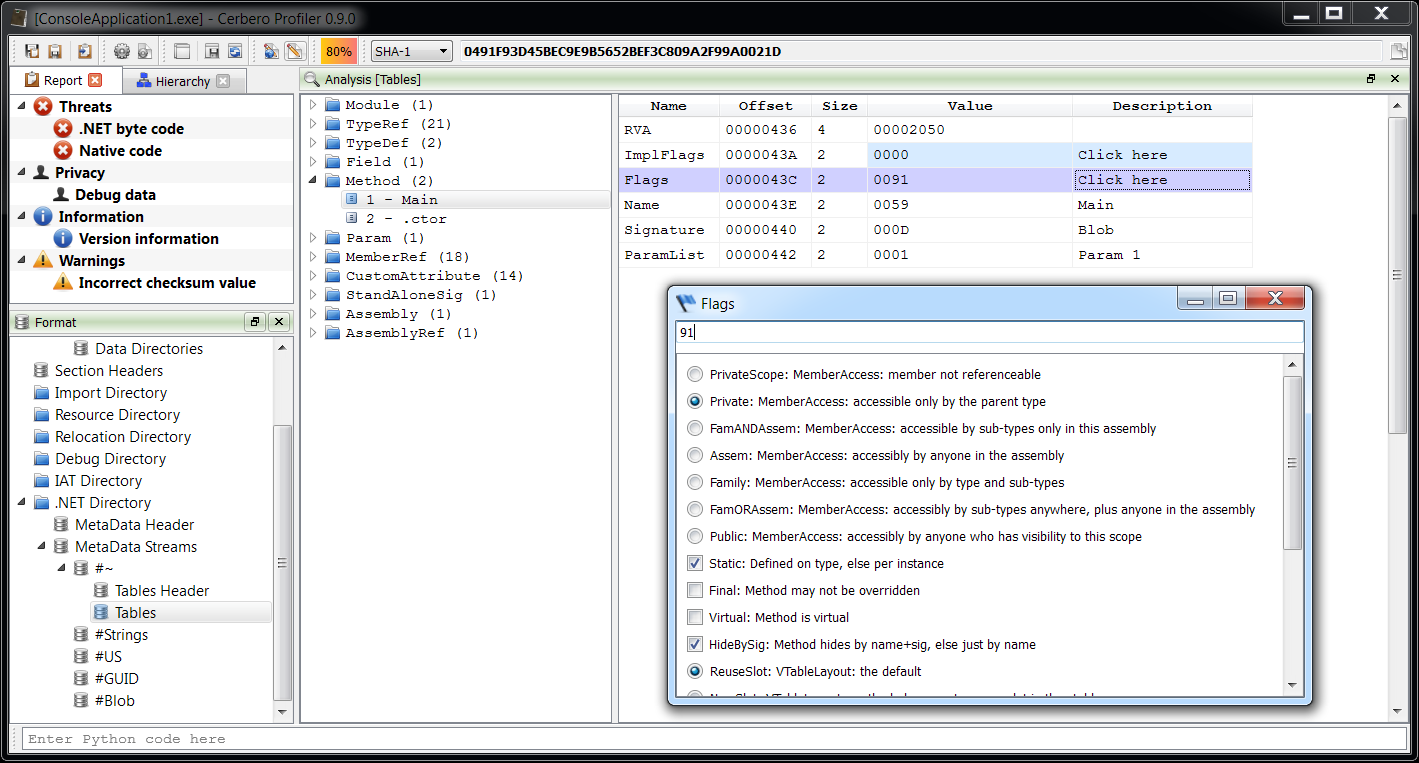
As usual, let’s begin with the format itself. Since some users probably have used CFF Explorer to inspect the .NET format in the past, I have kept the same format view in the Profiler as well.
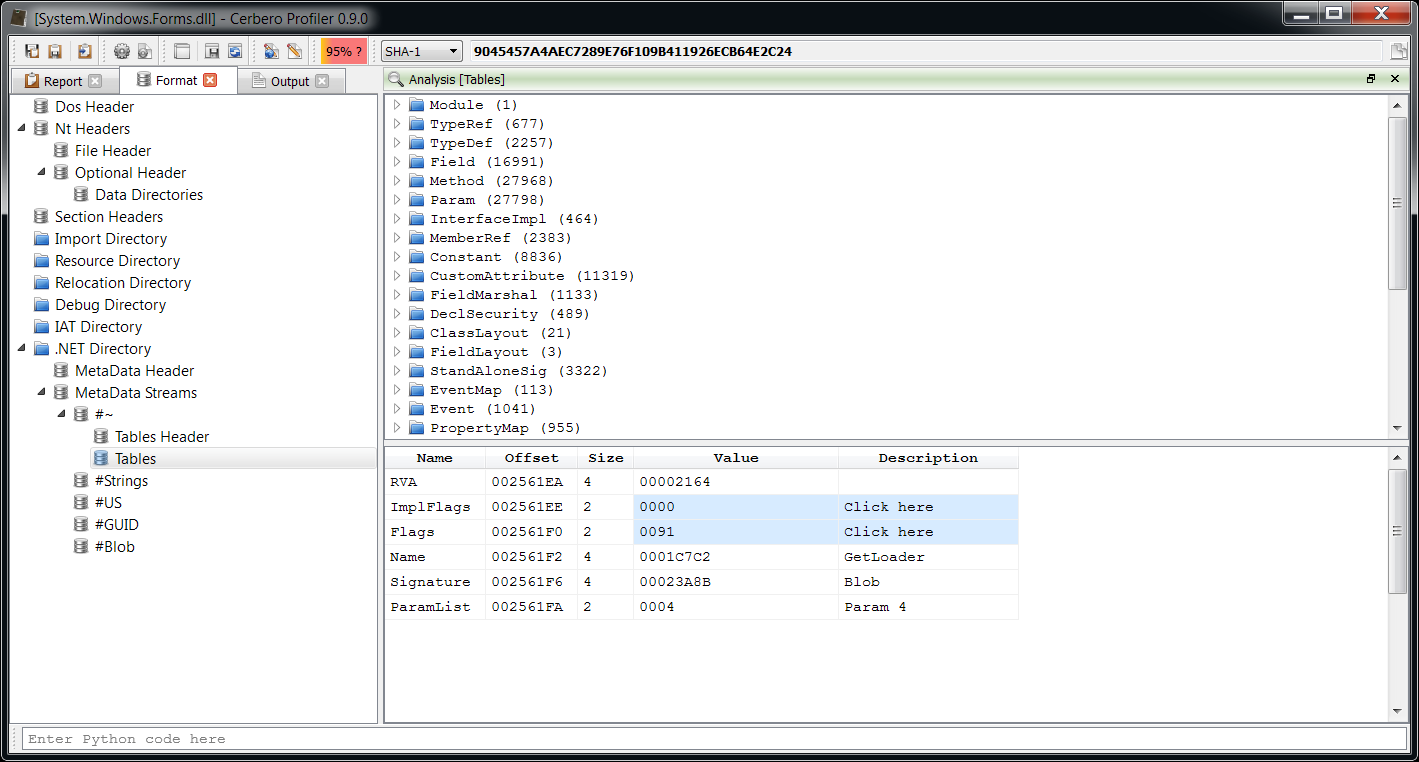
So how is it better than CFF Explorer? First of all, it’s very fast. There’s absolutely no wait time in opening a large metadata set as the following.
And then one handy feature which was not available in CFF Explorer, is the capability to display a second set of metadata. For instance, .NET native images (meaning those files in the assembly cache created with ngen.exe) contain two sets of metadata. The Profiler lets you inspect both sets.
Layout ranges cover all PE parts, so it was normal to add them for .NET as well. These are the ranges available for .NET:
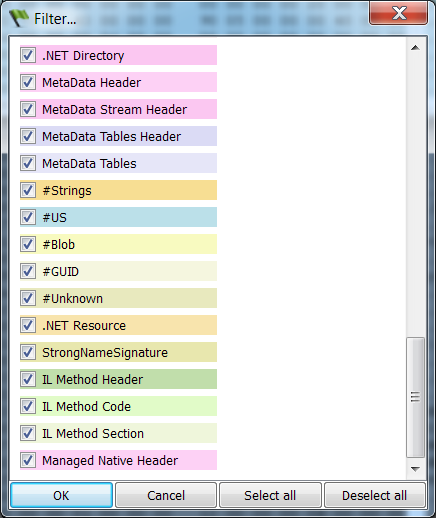
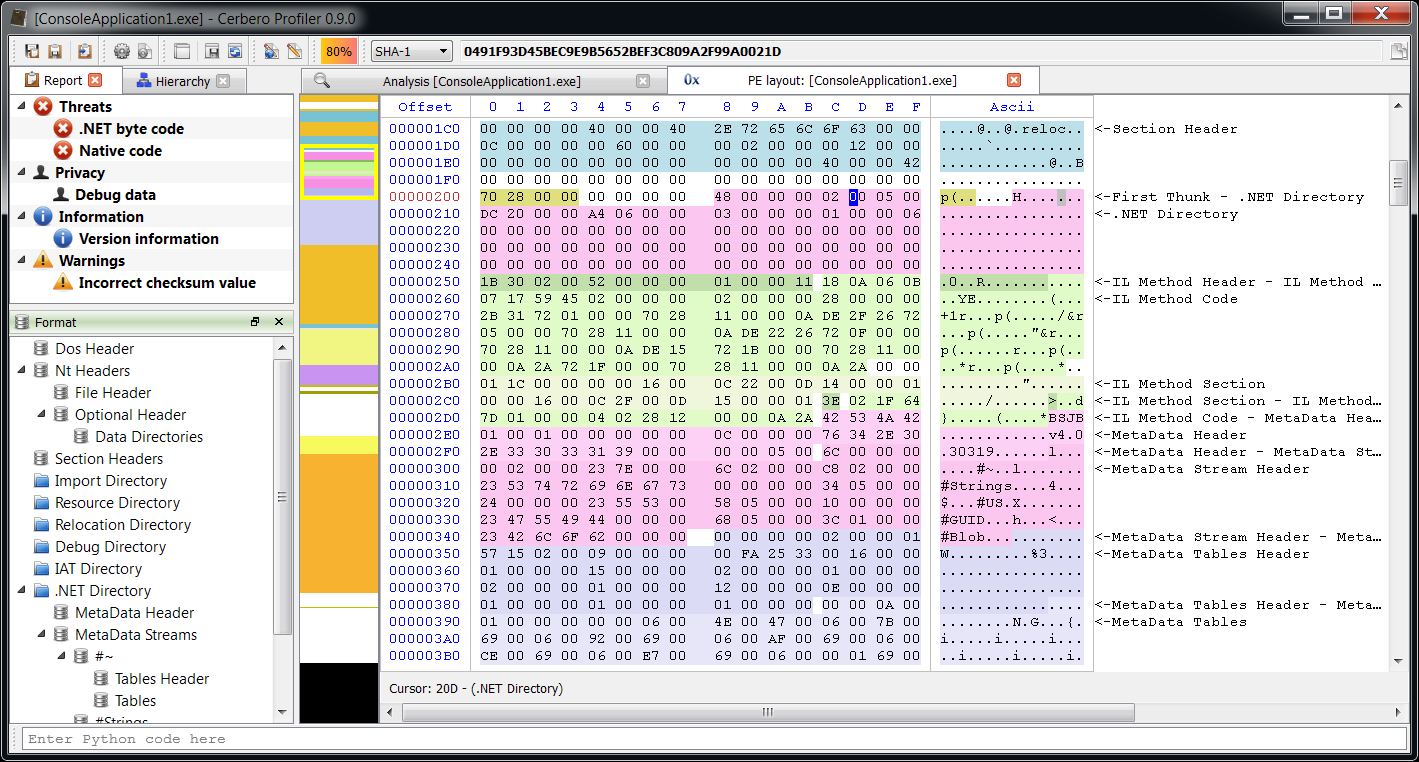
Let’s see them in the hex editor.
If you’re asking yourself why it’s all gray, it’s because more ranges are blended together, meaning that all .NET metadata is contained in the .text section of the PE and that section is marked as executable even if the assembly contains only MSIL code. While it doesn’t make much sense to mark as executable a region of data containing strings and tables, my best guess is that old versions of Windows had no in-built support for .NET in the loader, which is why assemblies contain a single ‘mscoree.dll’ import descriptor and the entry point is just a jmp to the only IAT thunk (_CorExeMain for executables, _CorDllMain for dlls). That API then loads the .NET framework if necessary. Since that single native jmp instruction requires a section in the PE marked as executable and because the granularity of sections is the same as virtual memory pages, it was probably considered a waste to use an entire memory page just for a jmp instruction and so the result is that everything is contained into a single executable section. This could probably be changed as new versions of the framework do not even run on older systems.
However, for our inspection purposes it suffice to get rid of the Code range by pressing Ctrl+Alt+F.
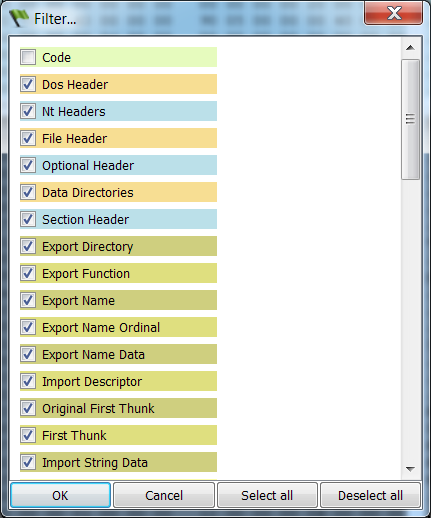
We can now inspect .NET layout ranges without the conflict. One nice aspect about it is that the code of IL methods is easy to distinguish between its header and extra sections.
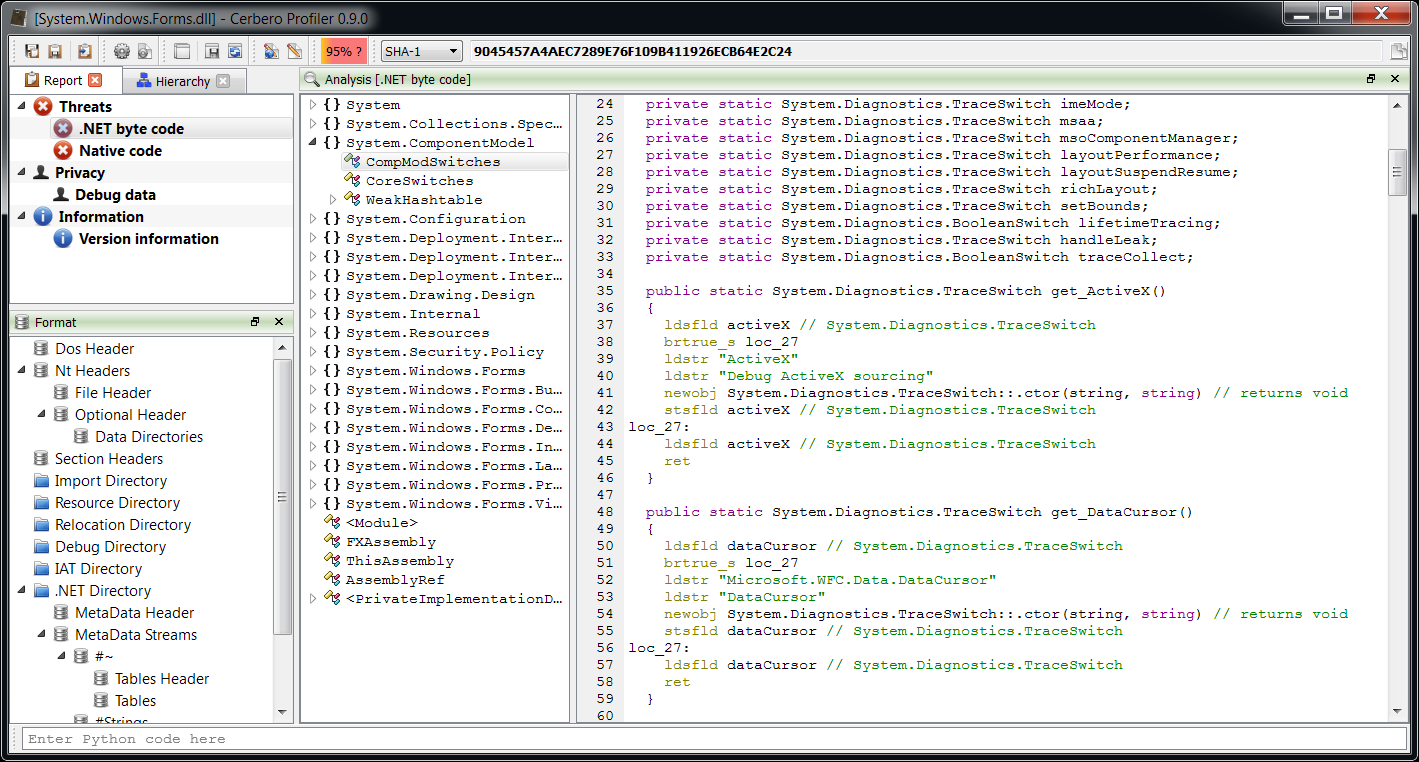
Included is also an IL disassembler. Its purpose is to let our customers quickly browse the contents of an assembly. As such readability was a priority and the output has been grouped for classes: I have always found it cumbersome in ILDasm to open every single method to inspect an assembly.
Here’s an output example:
  private static void Main(string [] args)
  {
    locals: int local_0,
            int local_1

    ldc_i4_2
    stloc_0 // int local_0
    ldloc_0 // int local_0
    stloc_1 // int local_1
    ldloc_1 // int local_1
    ldc_i4_1
    sub
    switch
      goto loc_22
      goto loc_60
    br_s loc_71
loc_22:
    try
    {
      ldstr "h"
      call System.Console::WriteLine(string) // returns void
      leave_s loc_81
    }
    catch (System.ArgumentNullException)
    {
      pop
      ldstr "null"
      call System.Console::WriteLine(string) // returns void
      leave_s loc_81
    }
    catch (System.ArgumentException)
    {
      pop
      ldstr "error"
      call System.Console::WriteLine(string) // returns void
      leave_s loc_81
    }
loc_60:
    ldstr "k"
    call System.Console::WriteLine(string) // returns void
    ret
loc_71:
    ldstr "c"
    call System.Console::WriteLine(string) // returns void
loc_81:
    ret
  }
And the original code:
        static void Main(string[] args)
        {
            int a = 2;
            switch (a)
            {
                case 1:
                    try
                    {
                        System.Console.WriteLine("h");
                    }
                    catch (ArgumentNullException)
                    {
                        System.Console.WriteLine("null");
                    }
                    catch (ArgumentException)
                    {
                        System.Console.WriteLine("error");
                    }
                    break;
                case 2:
                    System.Console.WriteLine("k");
                    break;
                default:
                    System.Console.WriteLine("c");
                    break;
            }
        }
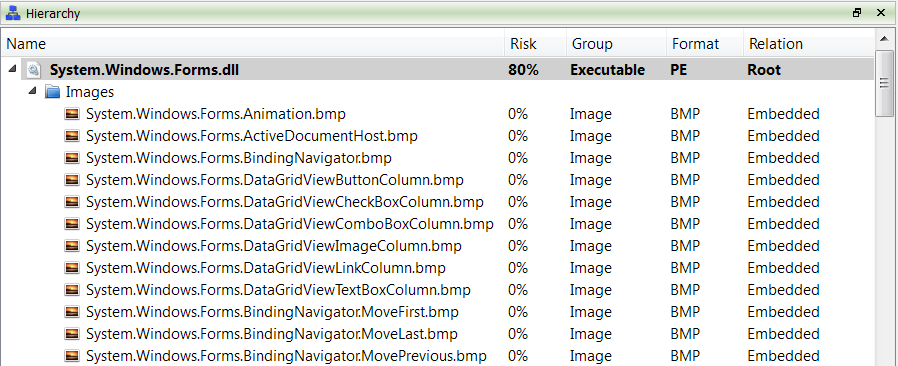
There’s one last thing worth mentioning. .NET manifest resources are displayed as sub-files.
However, the parsing of ‘.resources’ files was still too partial and thus won’t be included in 0.9.0.
From the last two posts you may have guessed the topic of the upcoming release. So stay tuned as there’s yet more to come.


pretty cool! but how to invoke this .NET layout ranges dialog (“Filter…”) ? since I cant find it :/
Thanks. It’s an action, Ctrl+R -> “Display layout”. 🙂
thanks, I probably would never found it in a million years…