We’re proud to announce the release of Cerbero Suite 4.0!
There are many new features, especially in the advanced version. Support for ARM32/ARM64 in Carbon and the inspection of Windows crash dumps stand out as two major additions.
All of our customers can upgrade at a 50% discount their licenses for the next 3 months! We value our customers and everyone who has bought a license since June should have already received a free upgrade for Cerbero Suite 4! If you fall in that category and haven’t received a new license, please check your spam folder and in case contact us at sales@cerbero.io. Everyone who has acquired a license before June, but in the last 3 months, will get an additional discount.
Starting today we’ll be contacting all of our existing customers and provide them with a discount coupon. If you don’t get an email from us in the next two days, please contact us at sales@cerbero.io!
This is the full list of news:
+ added Carbon loader for Windows user address space
+ added Carbon loader for Windows DMP files
+ added Carbon support for ARM32 and ARM64
+ added Carbon support for PDB symbols
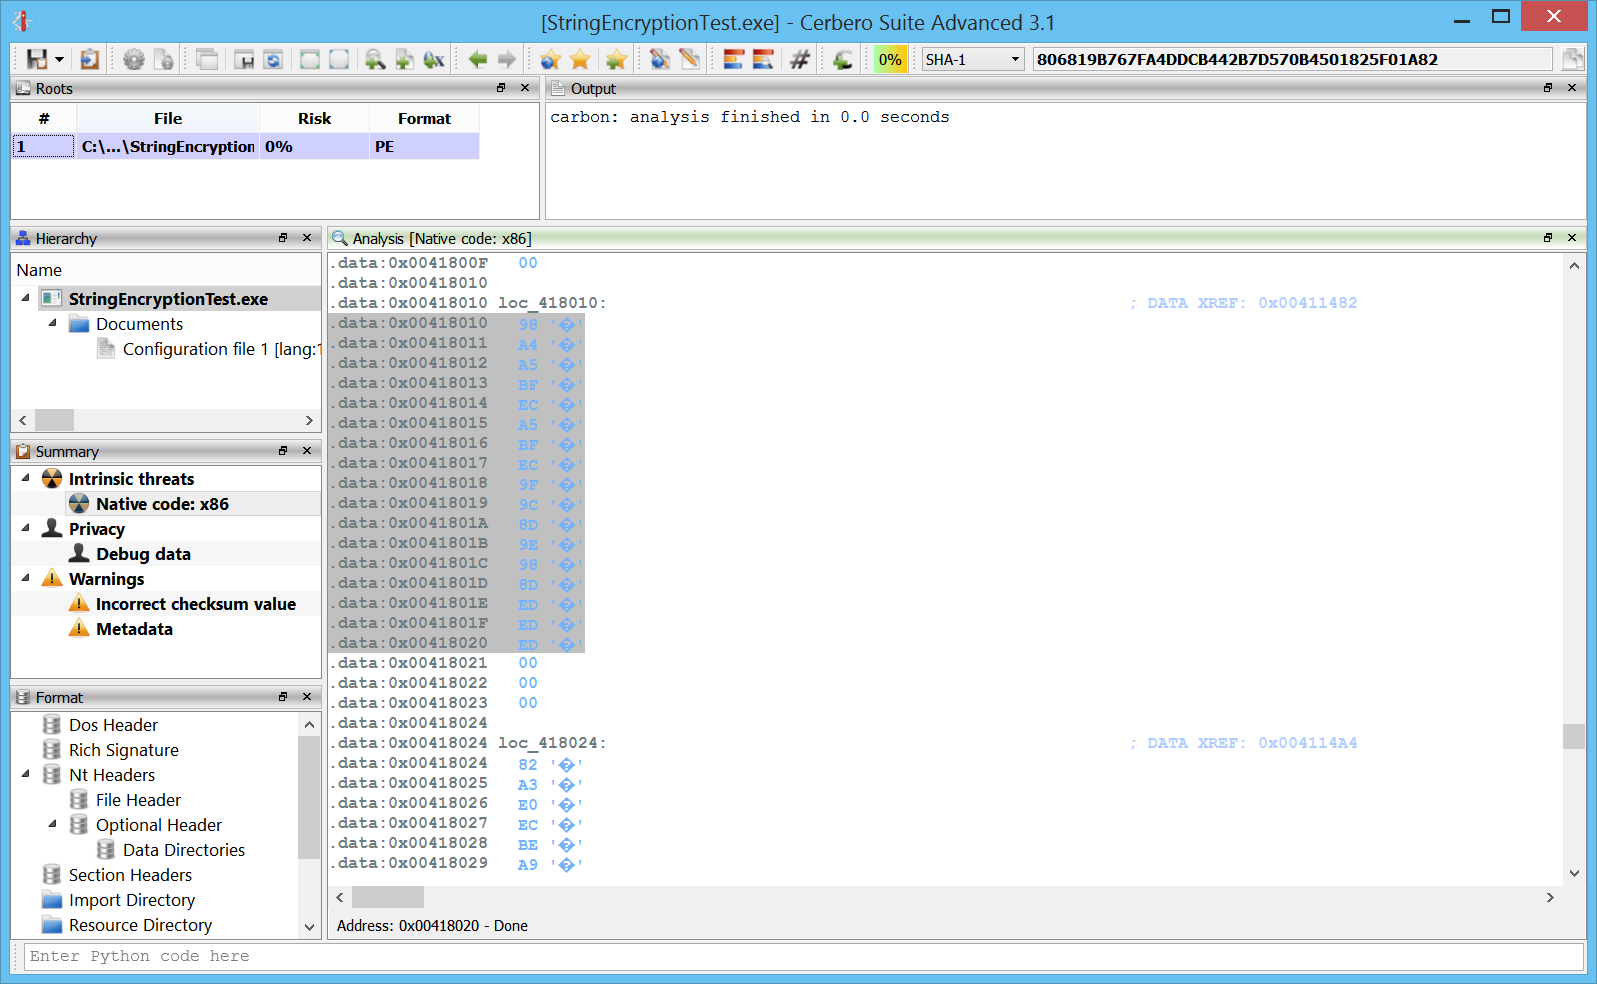
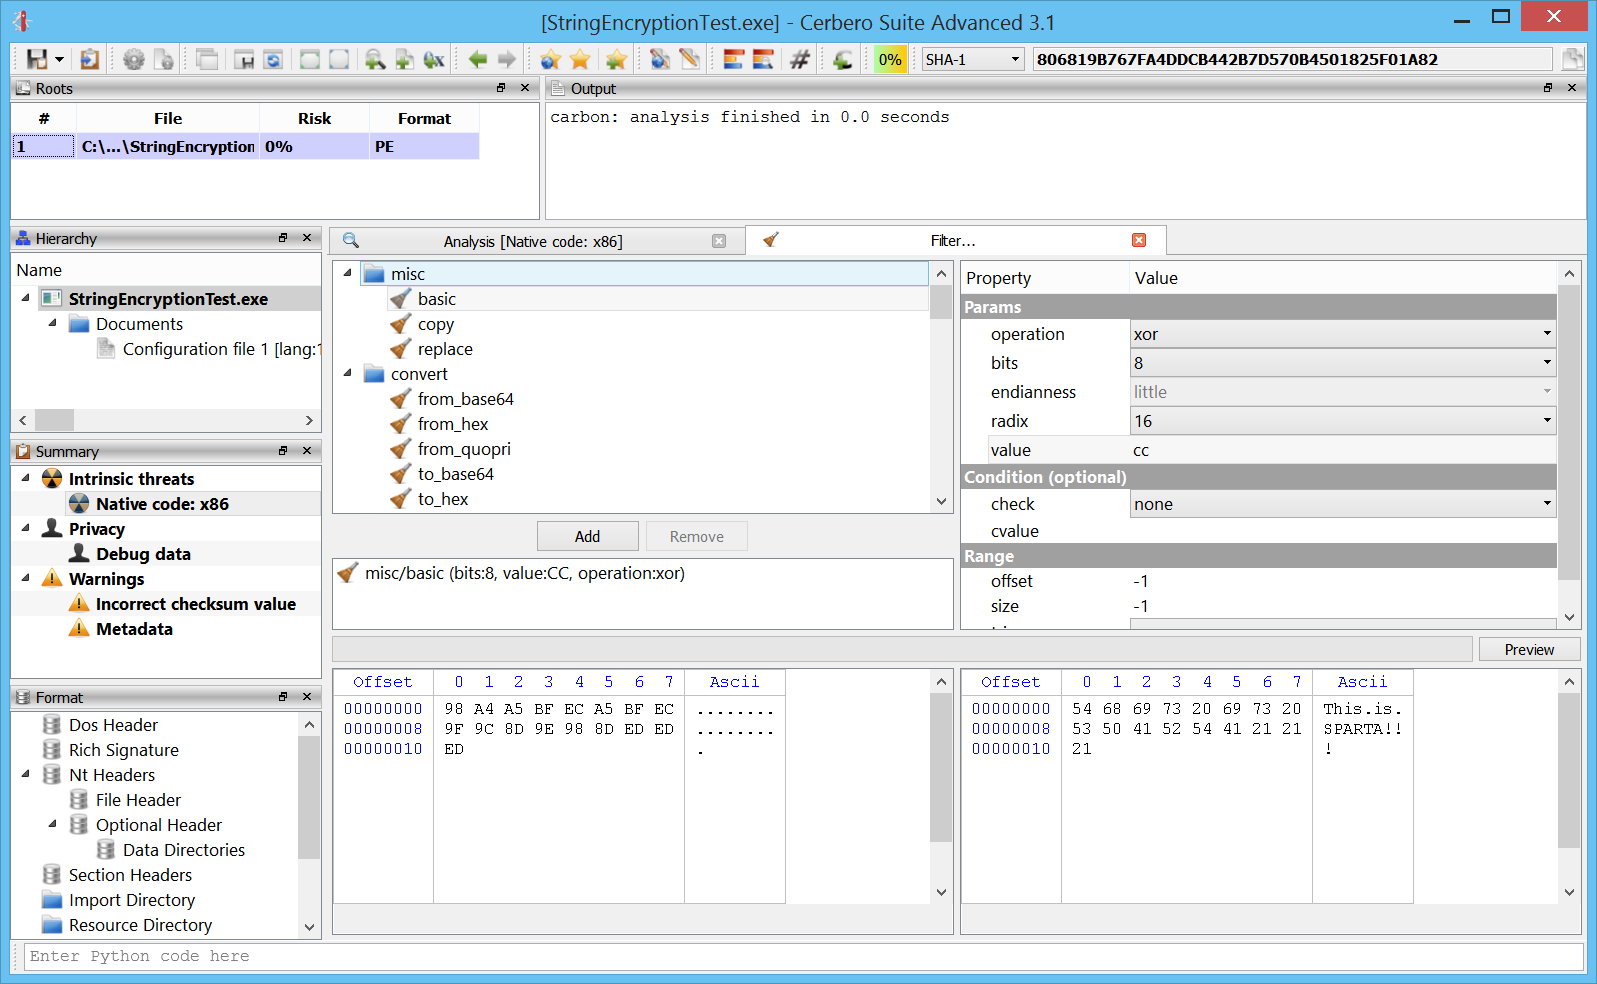
+ added support in Carbon to define data types
+ added memory analysis support for latest Windows 10 versions
– added Windows x64 setup
– added UI hook extensions
+ improved Windows memory analysis support
+ improved Windows DMP support
+ improved Carbon disassembly
+ improved Ghidra plugin and setup
+ improved decompiler output
– improved Hex Editor
– improved file stats view
– improved symbol demangling
– improved Python speed
– improved headers
– improved PE debug directory support
– improved PDB support
– improved dark mode support on macOS
– improved update check
– improved single view mode
– improved settings
– improved Python SDK
– updated SQLite to 3.32.0
– fixed bugs
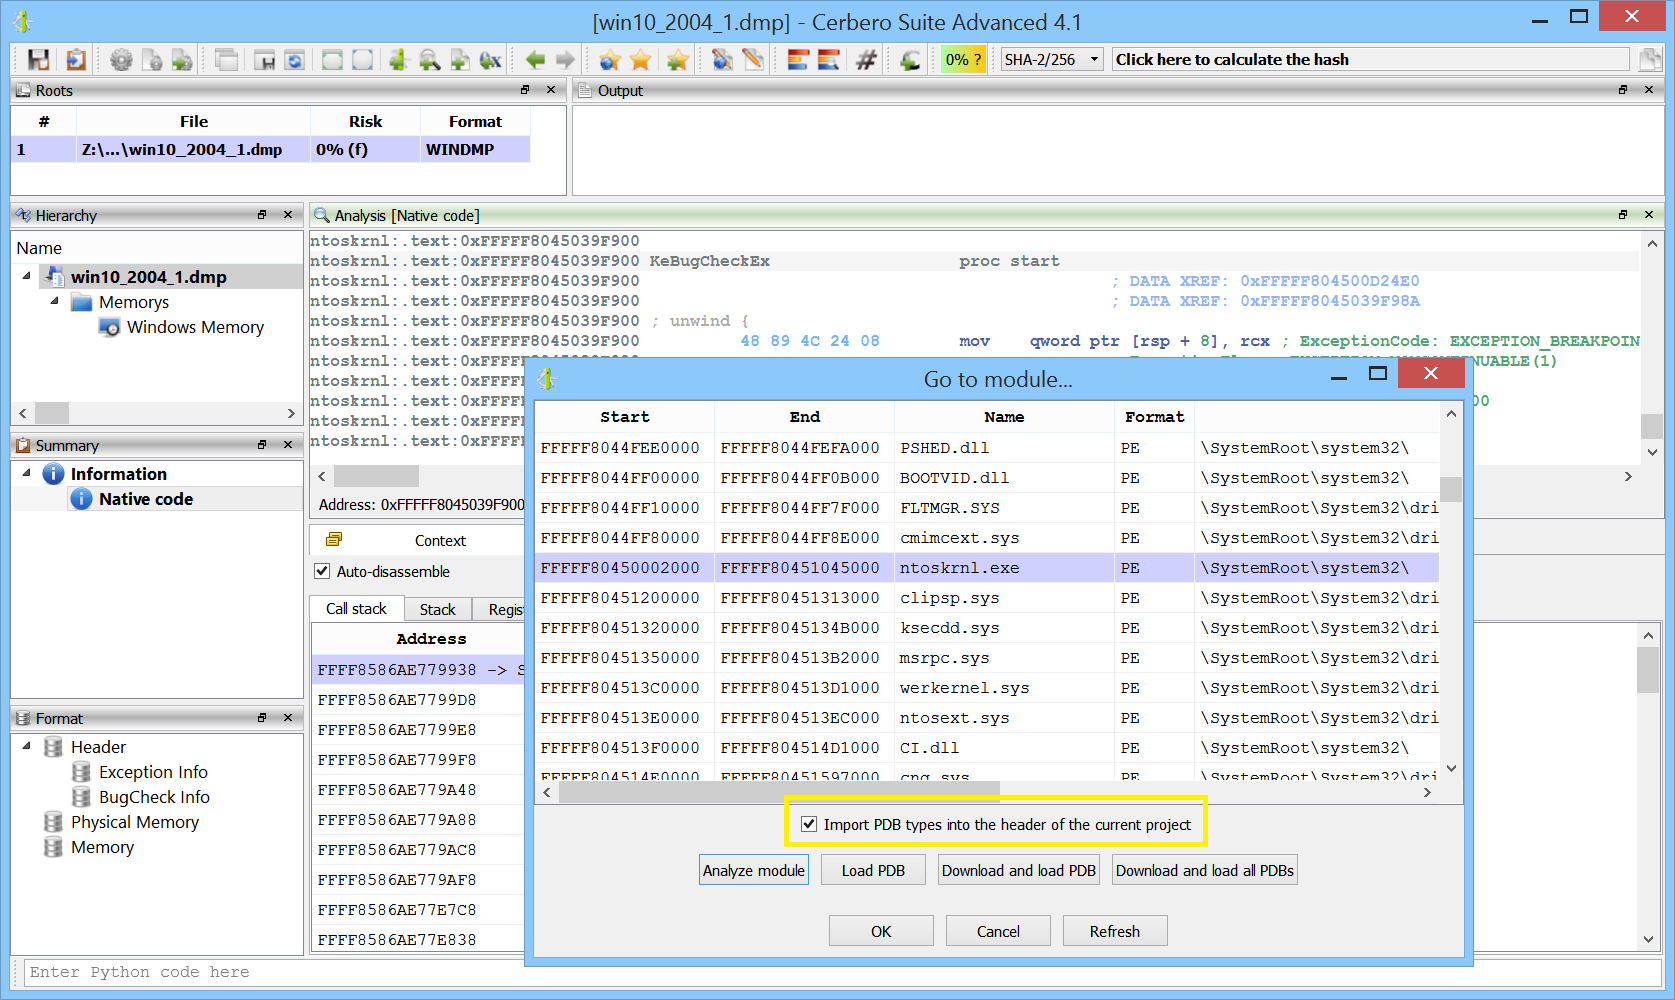
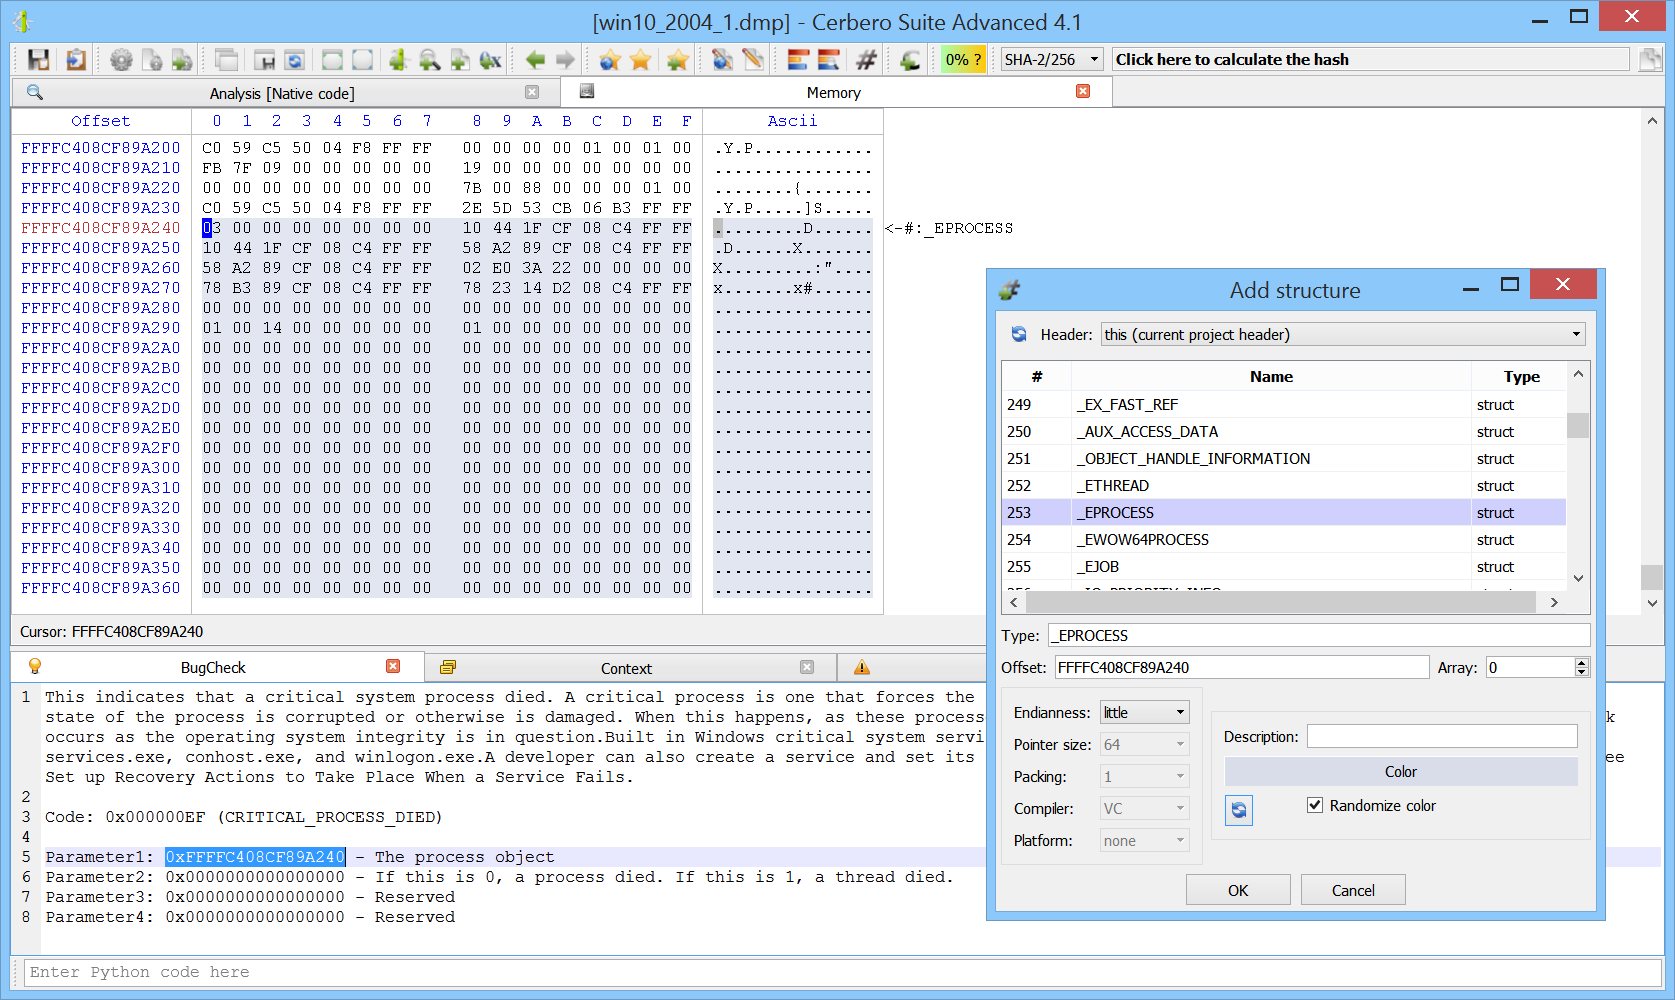
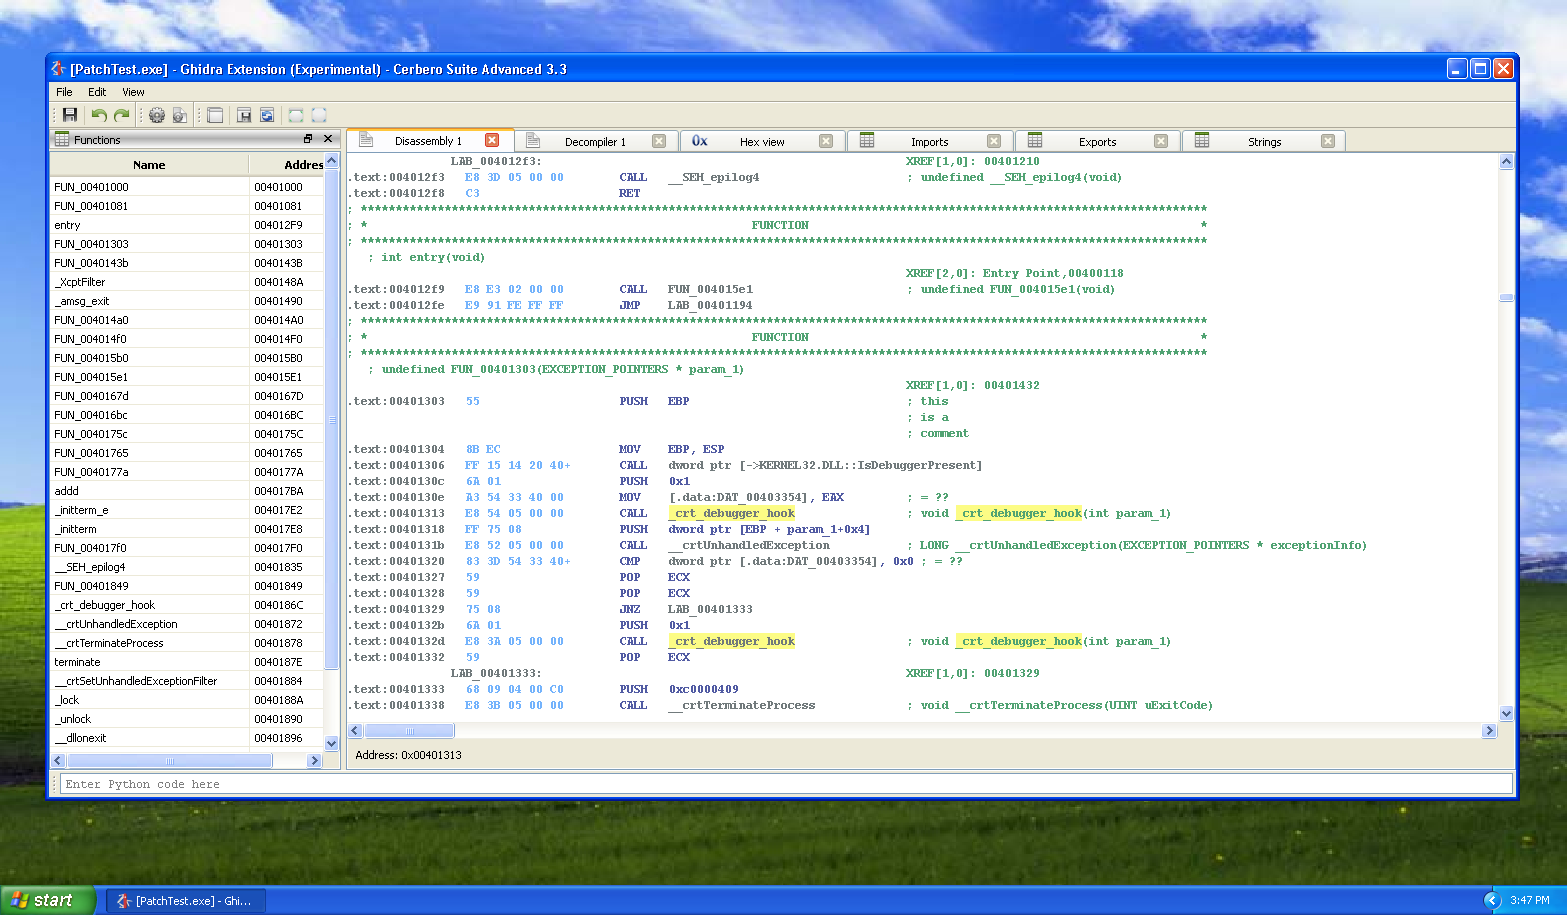
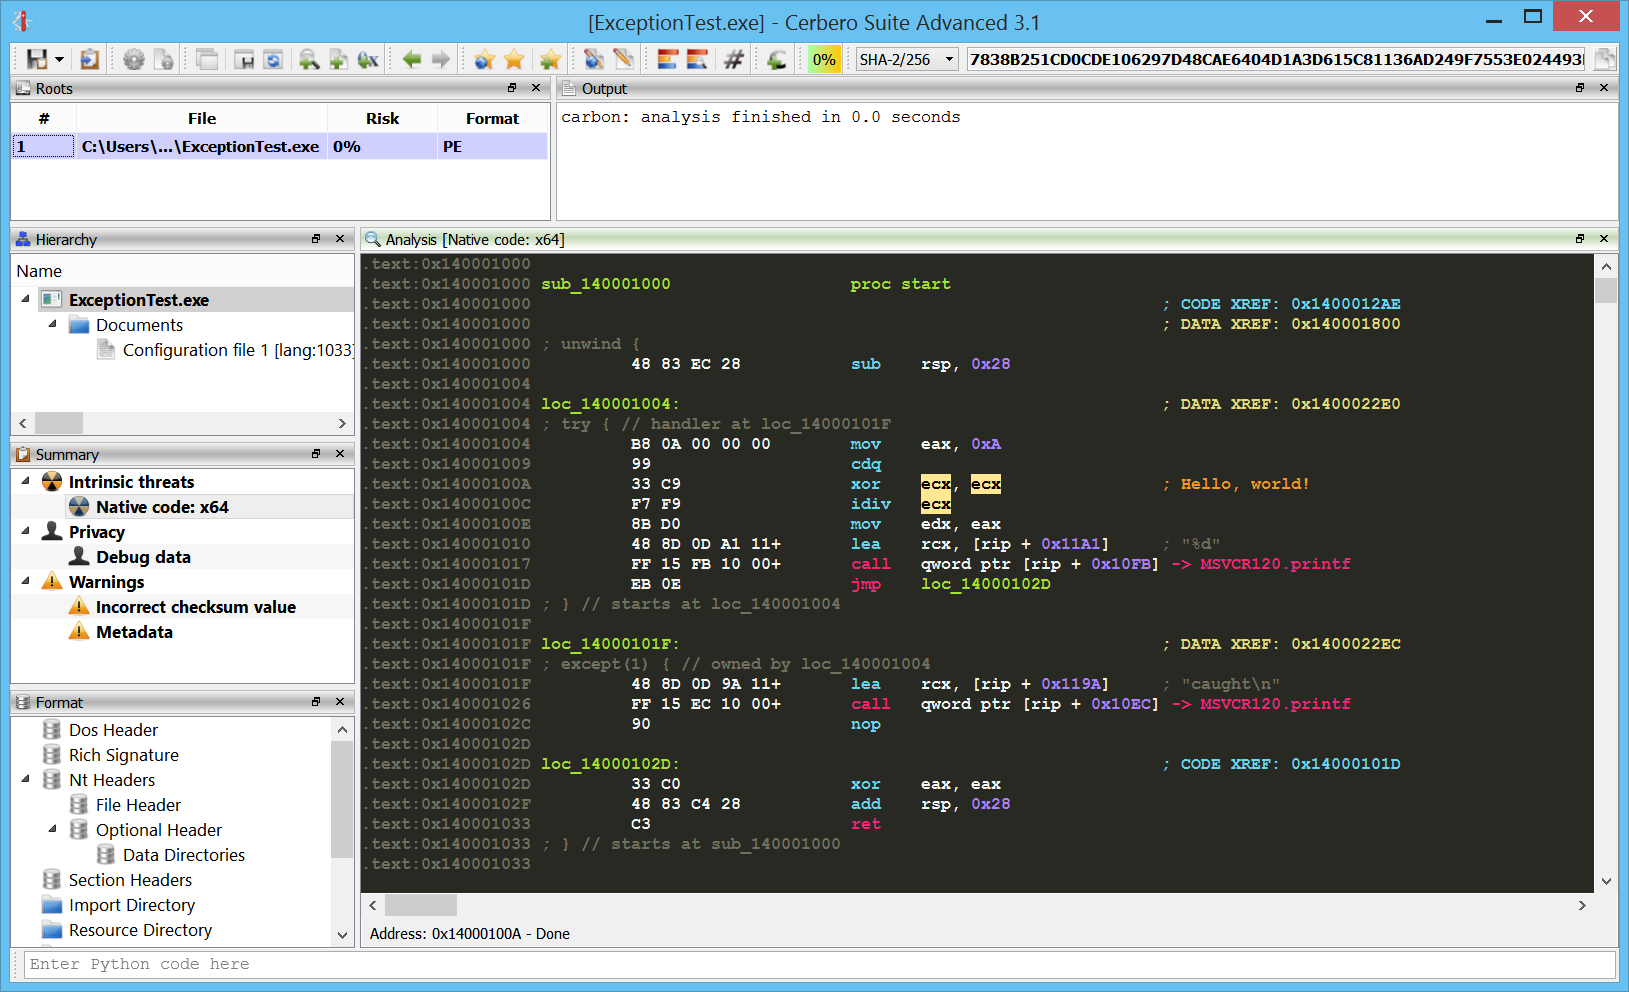
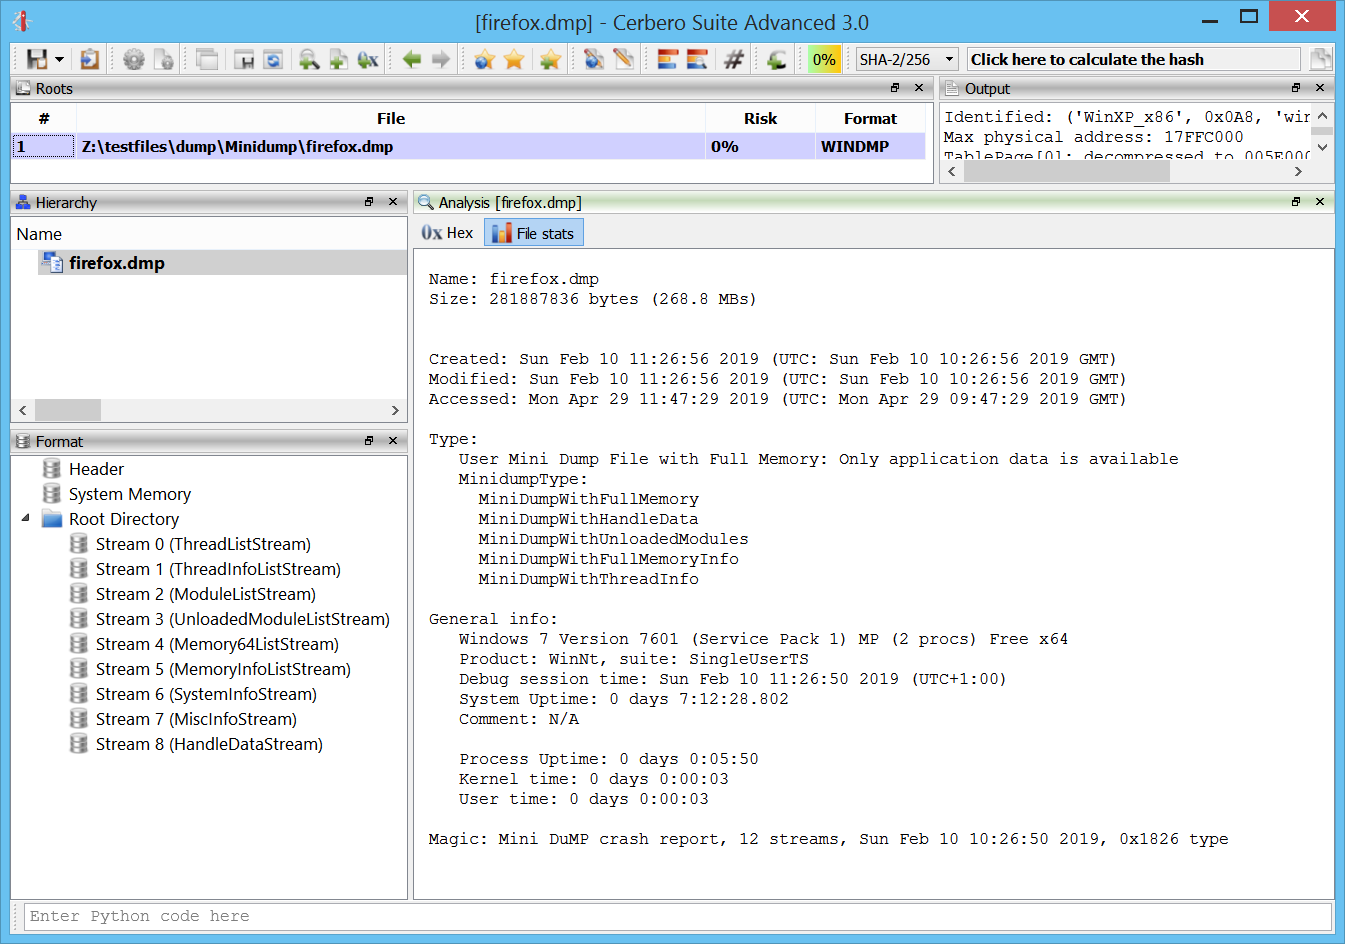
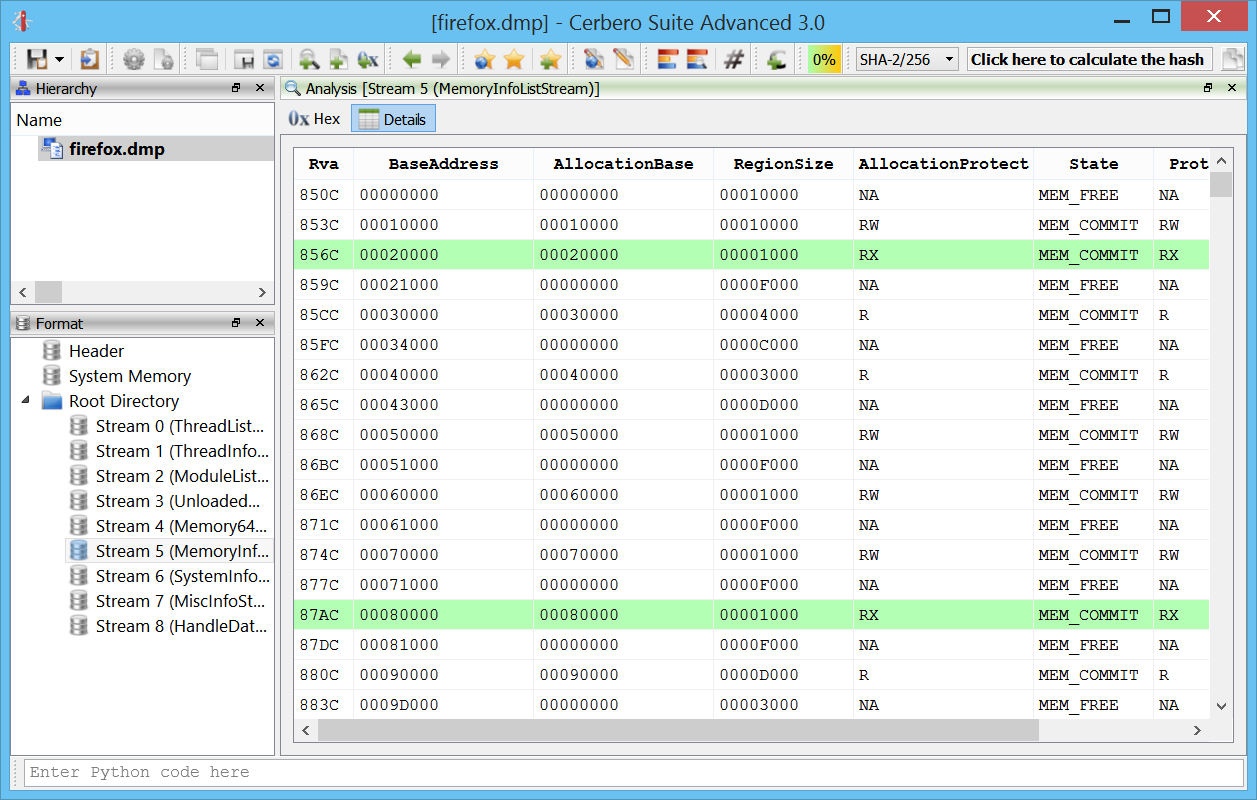
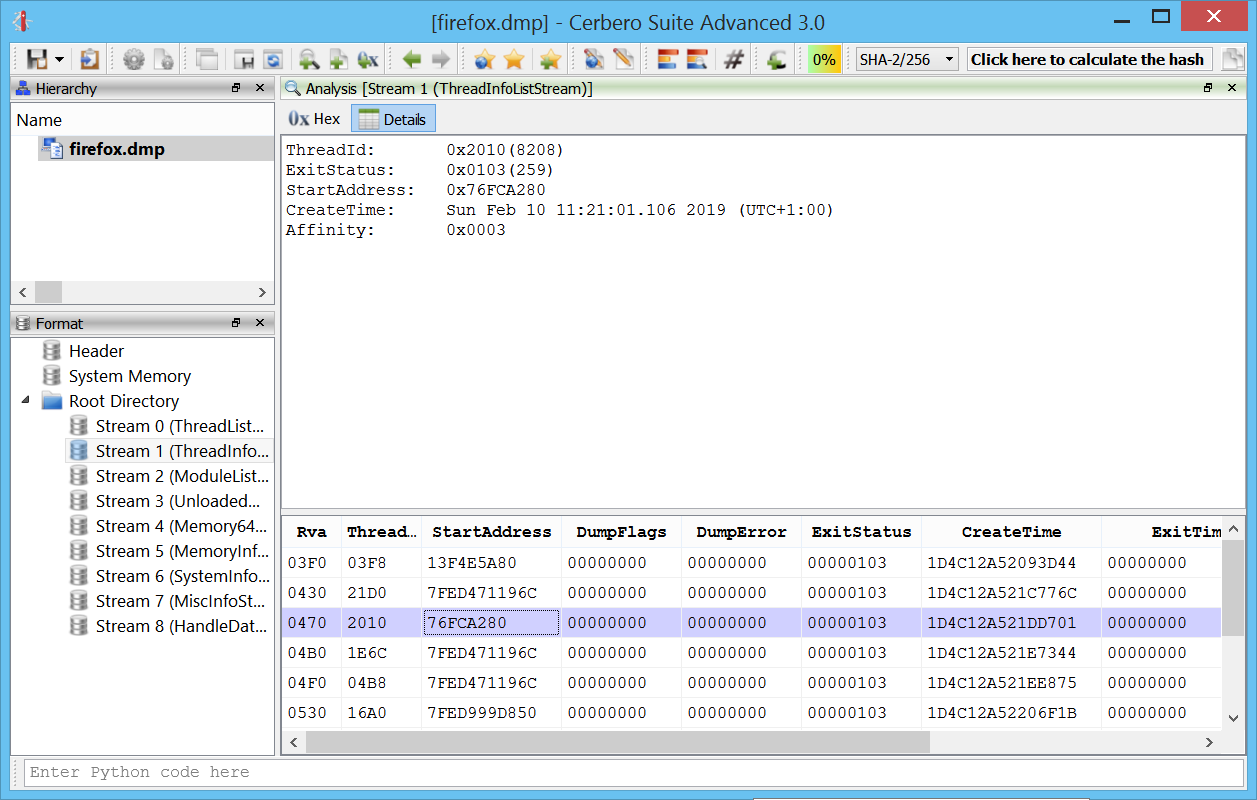
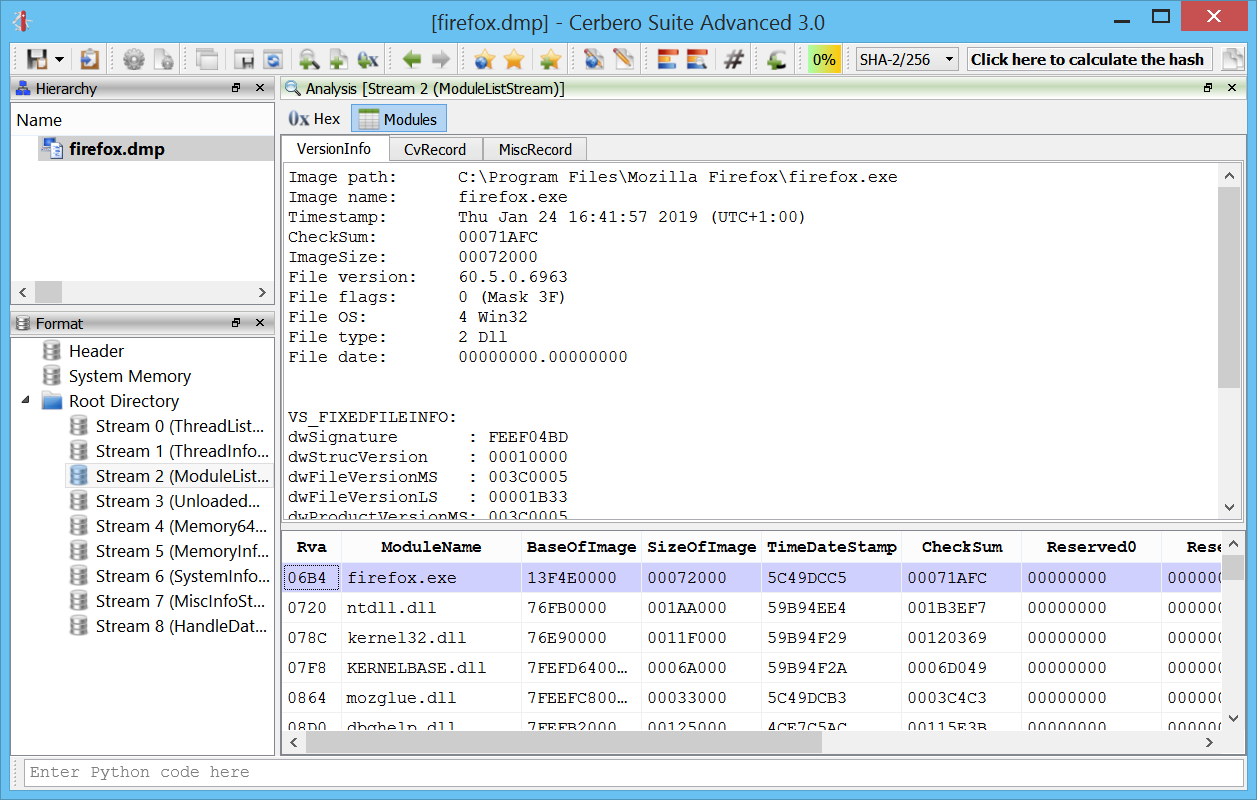
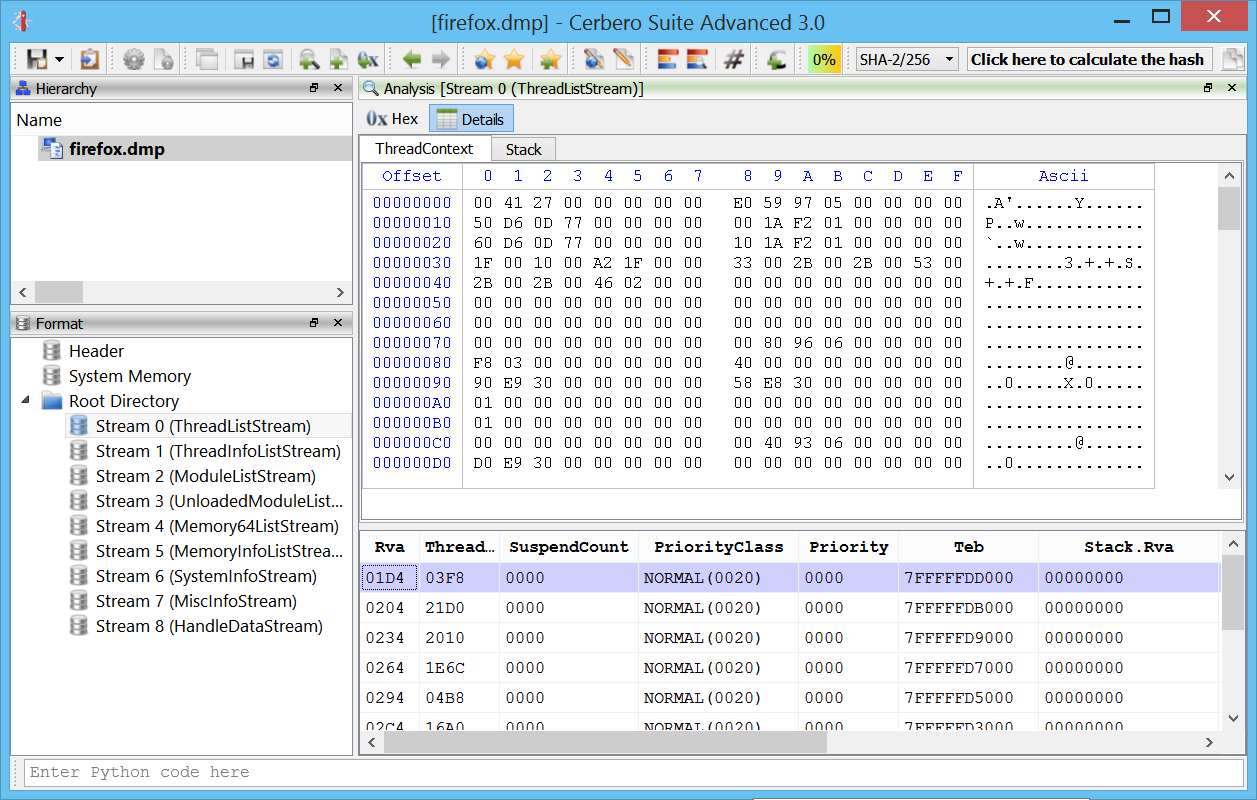
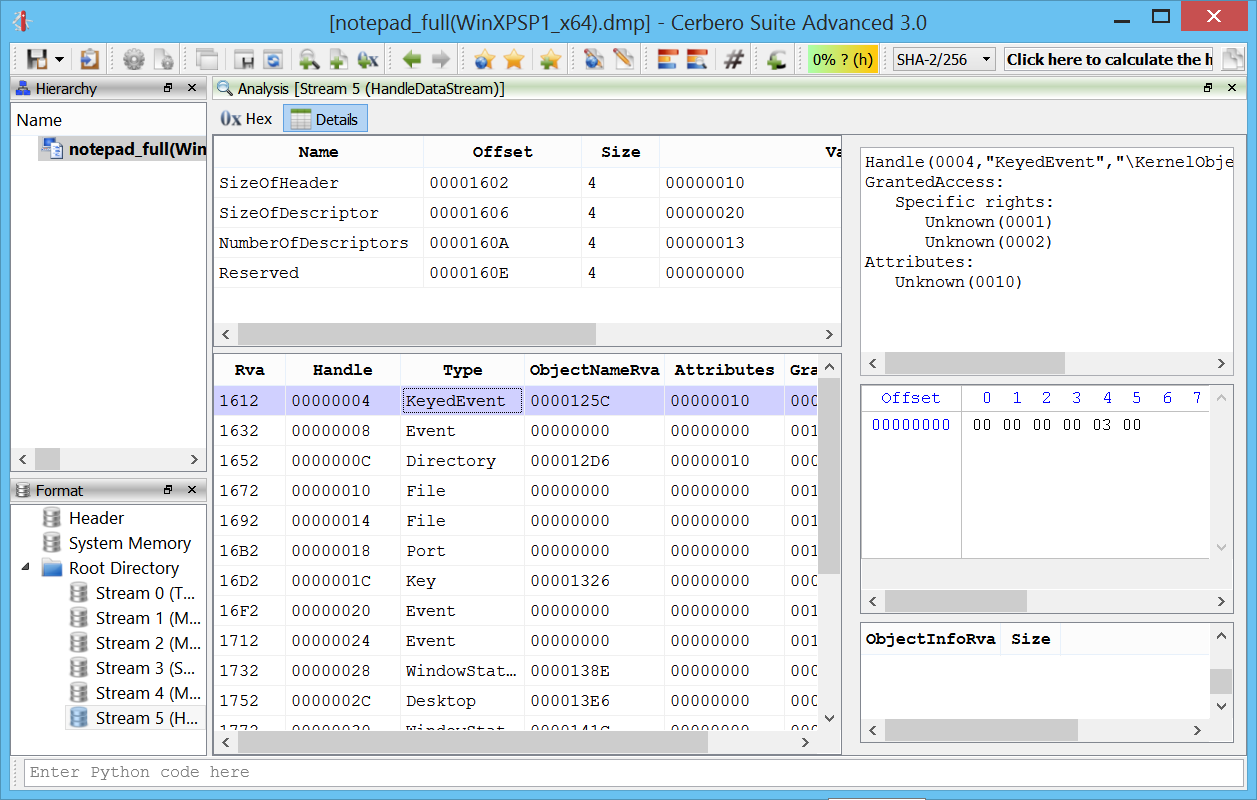
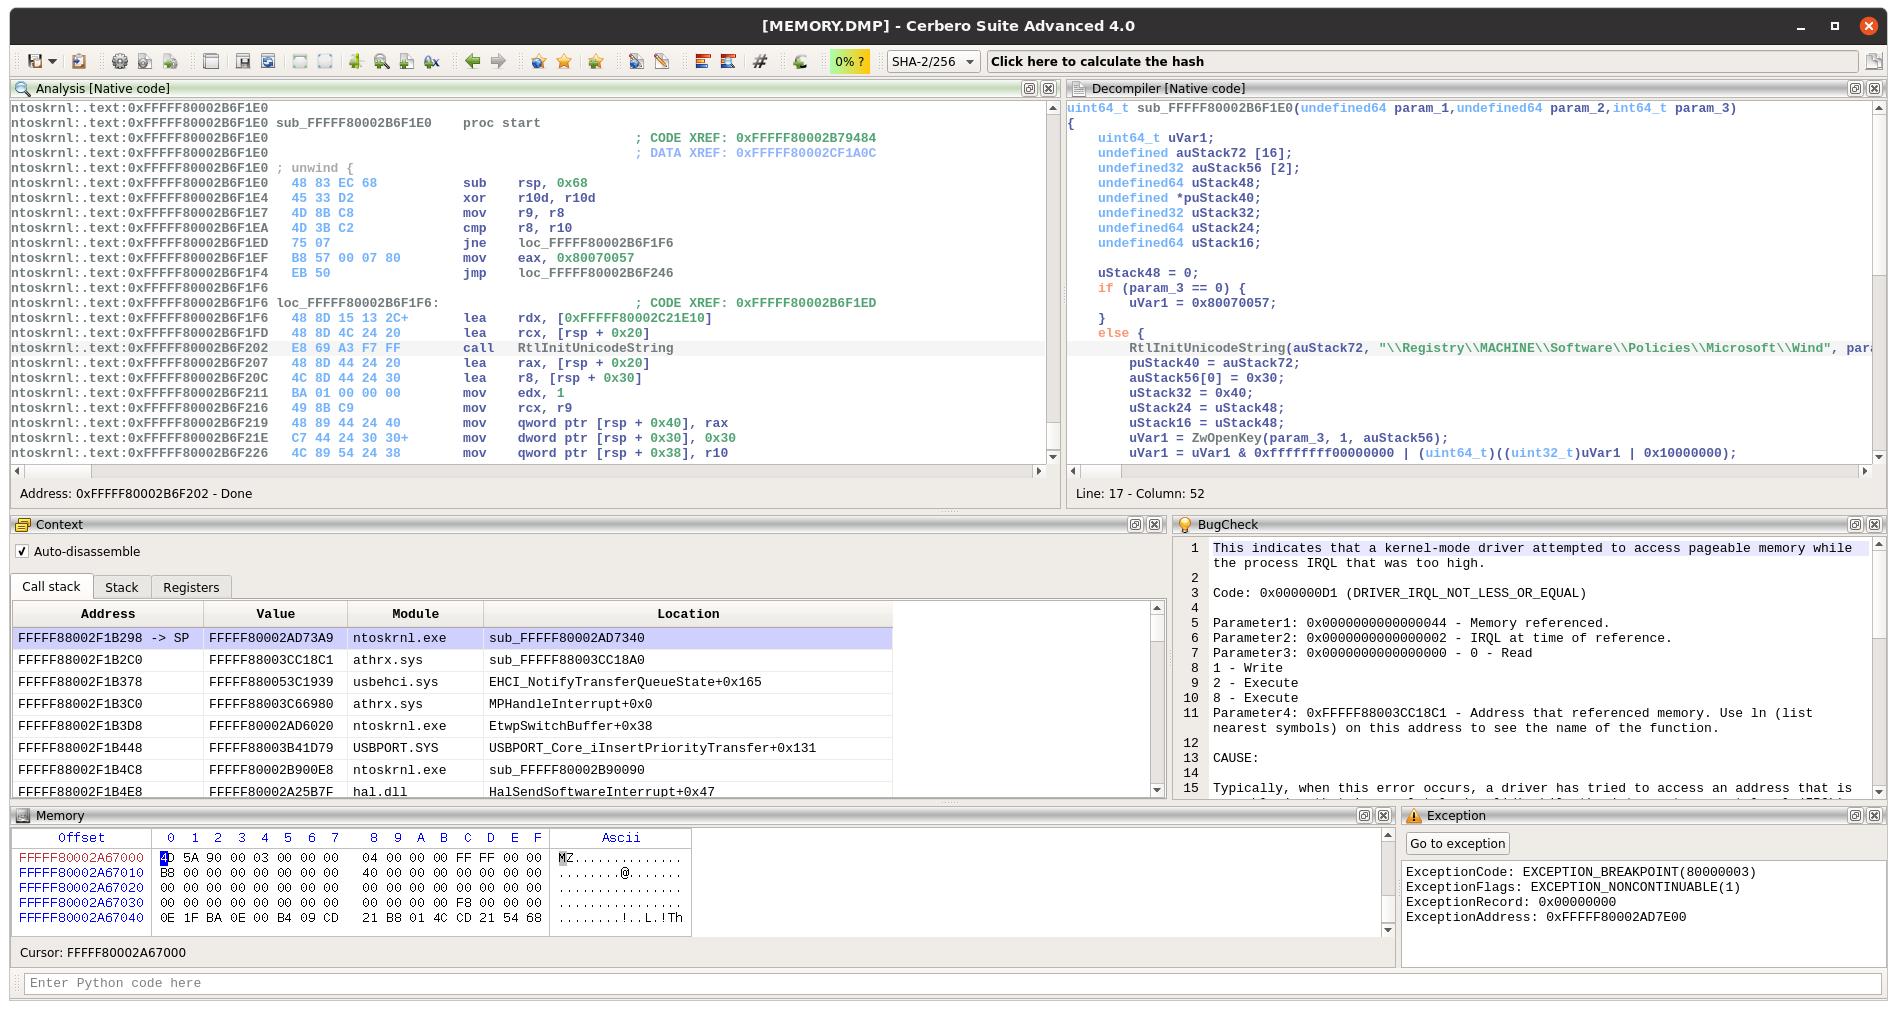
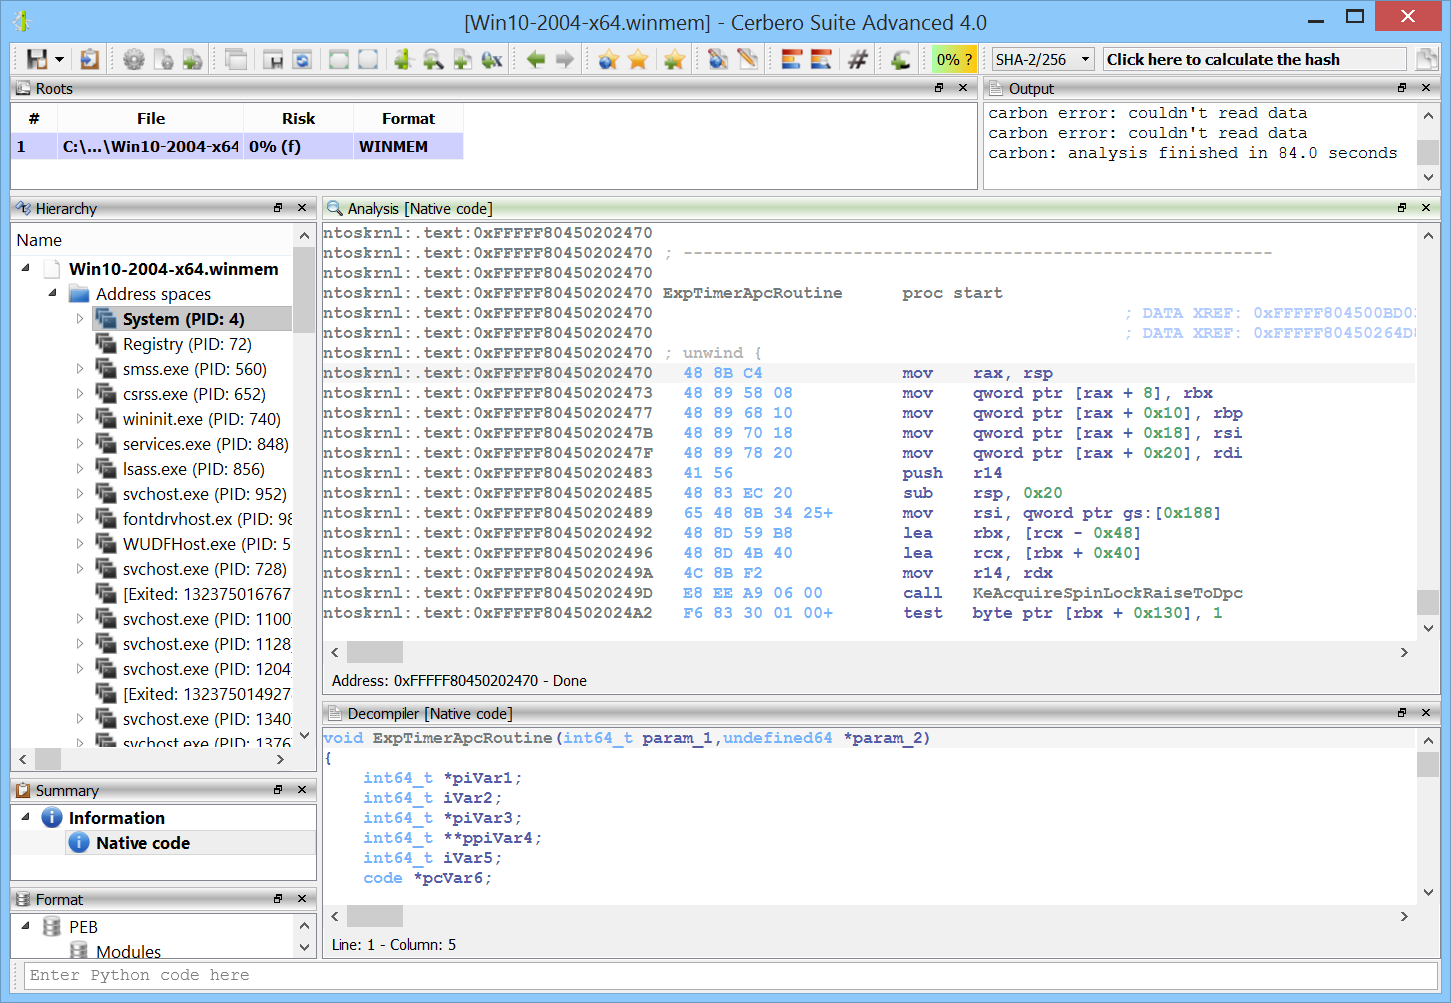
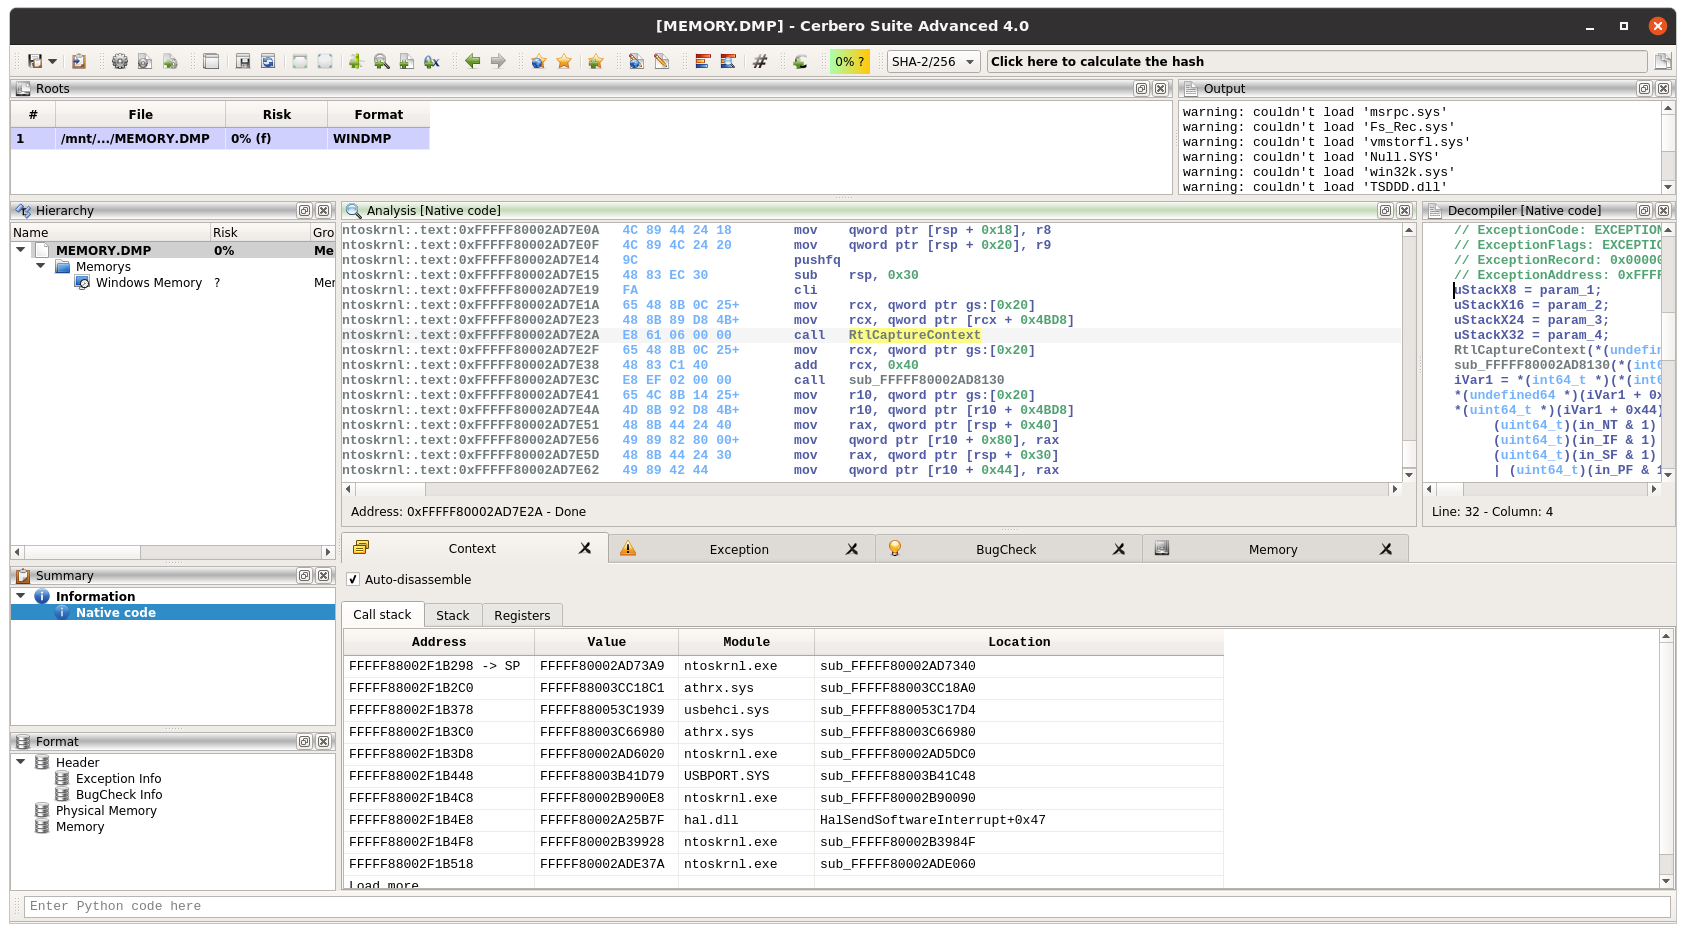
Windows crash dumps
Inspecting Windows crash dumps is important for many software developers. Cerbero Suite lets you easily inspect both kernel and mini-dumps. You can view the code, load PDB symbols, inspect the call stack, threads, exception information, bug check information, memory and much more.
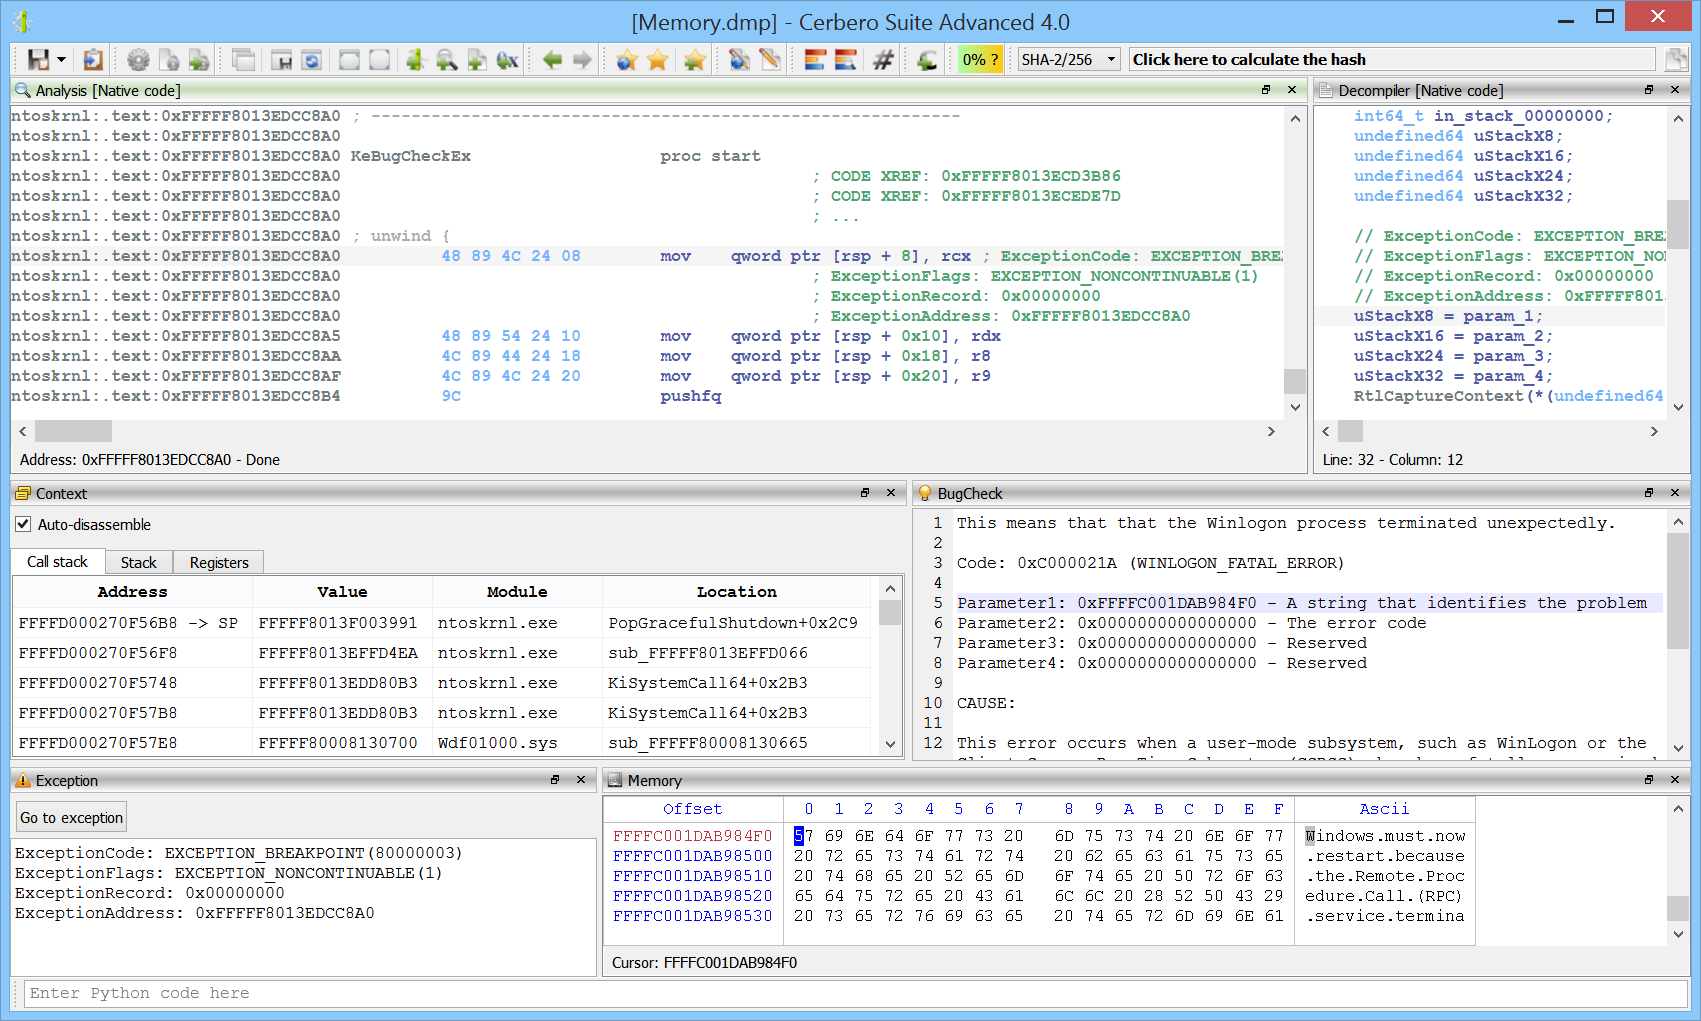
This feature does not rely on WinDBG and works on every supported platform!
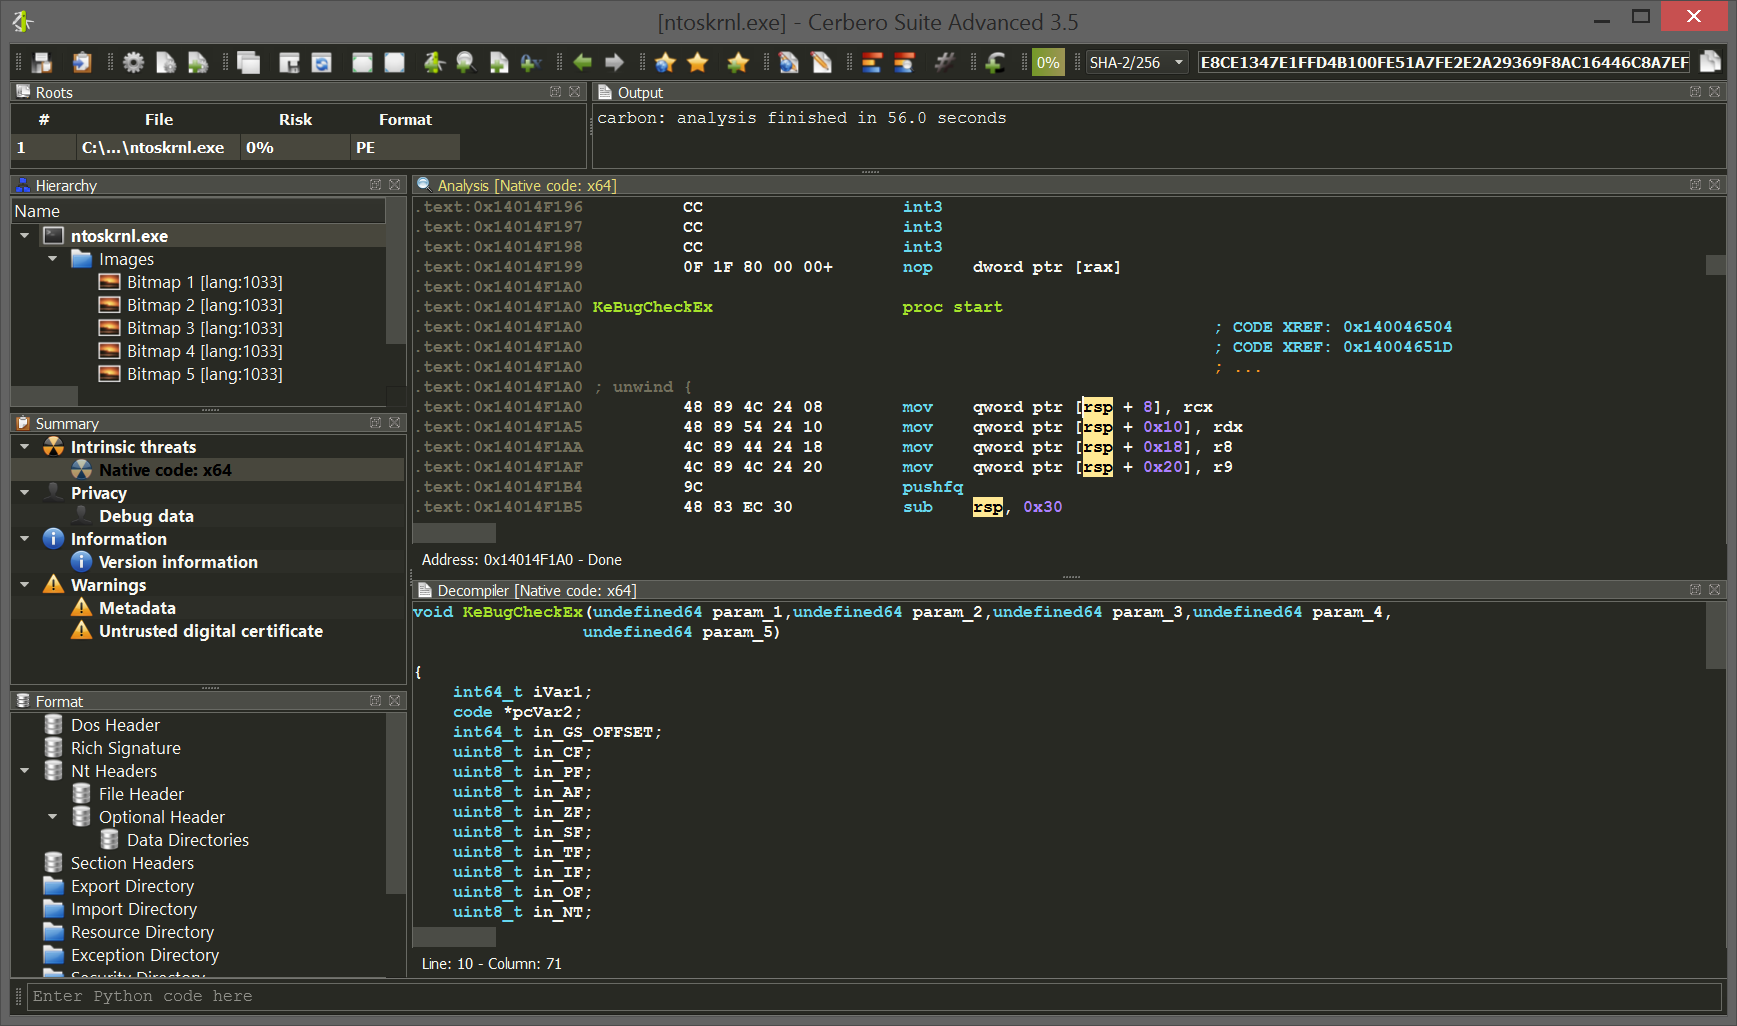
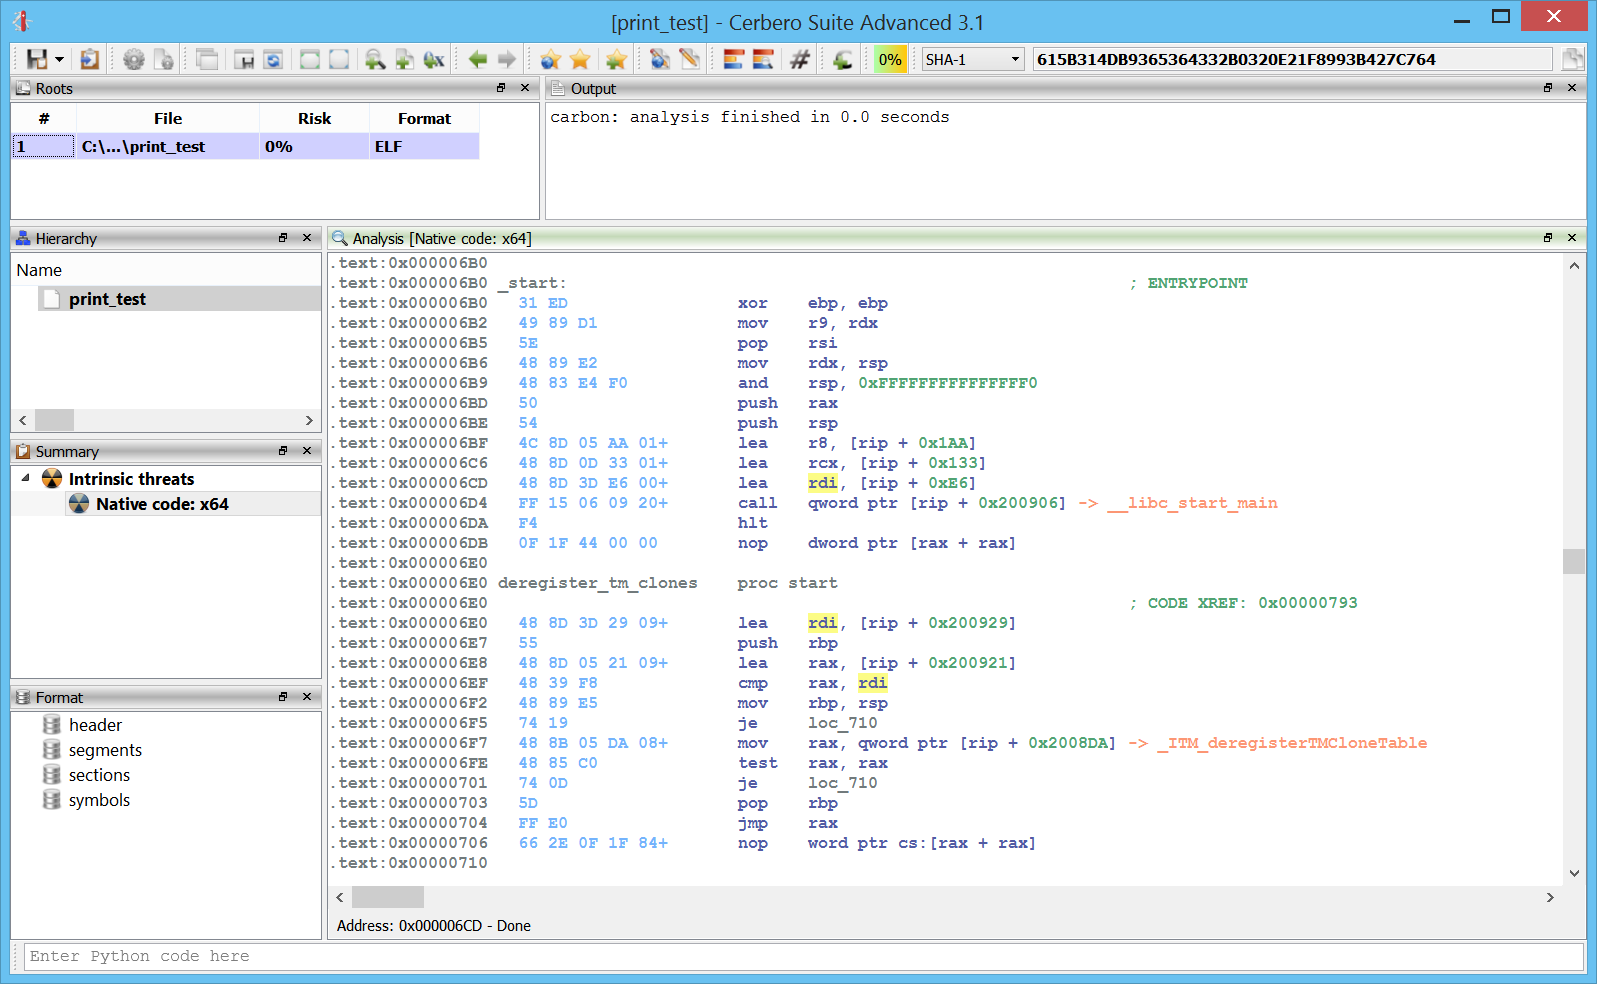
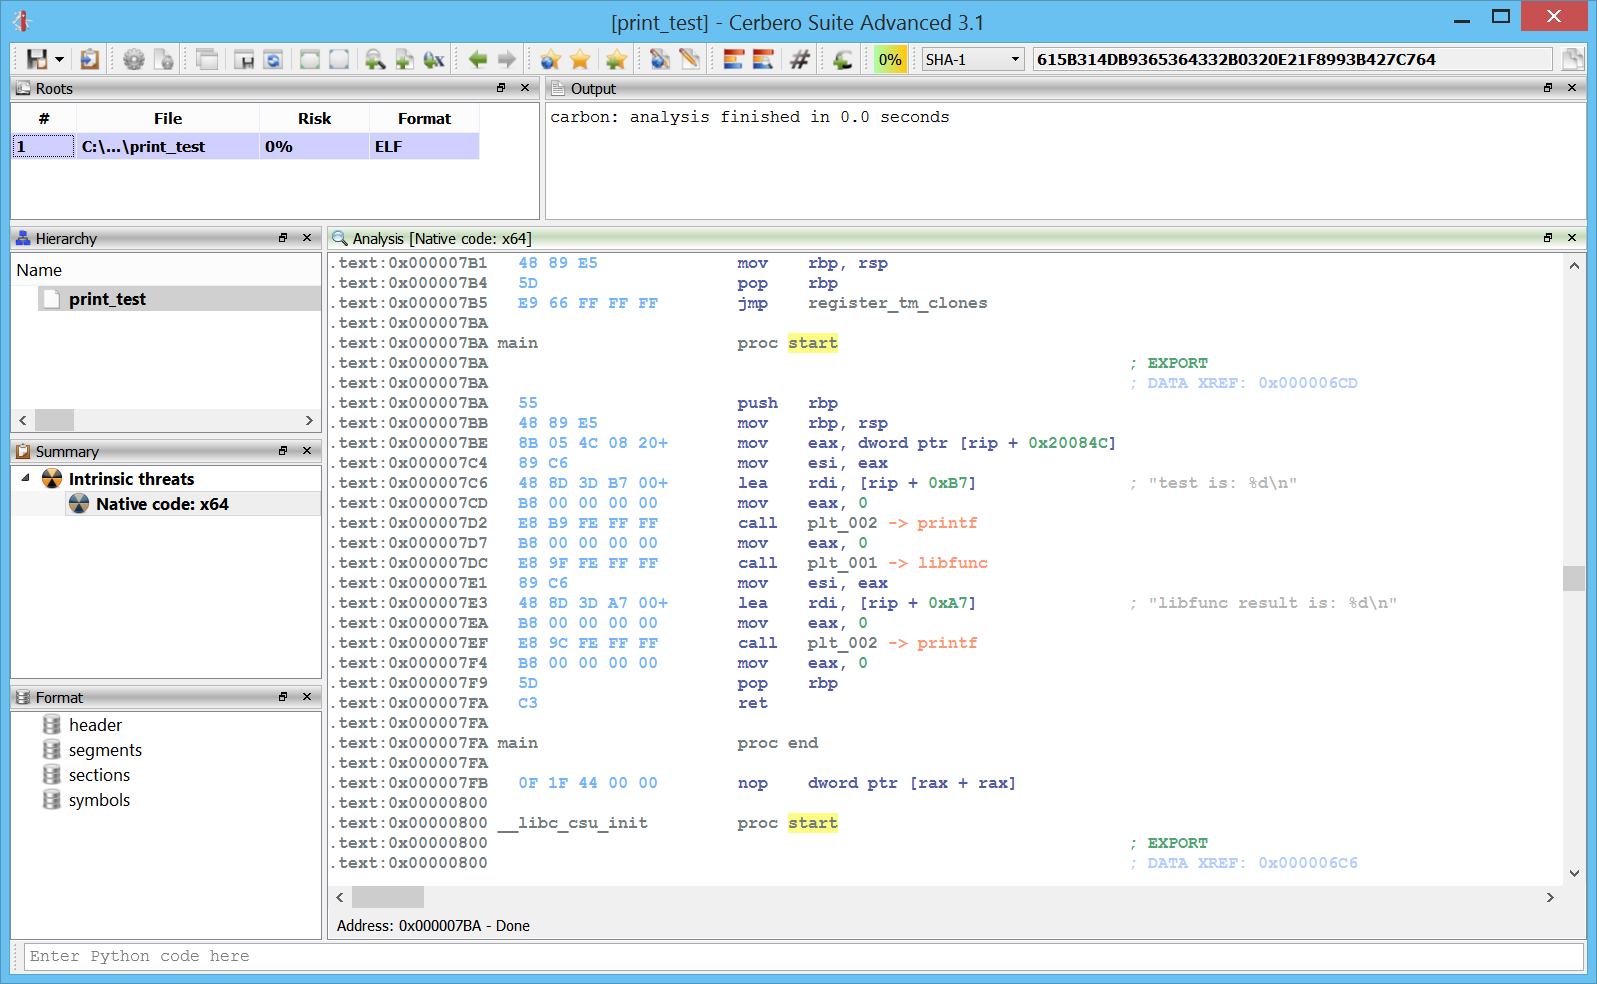
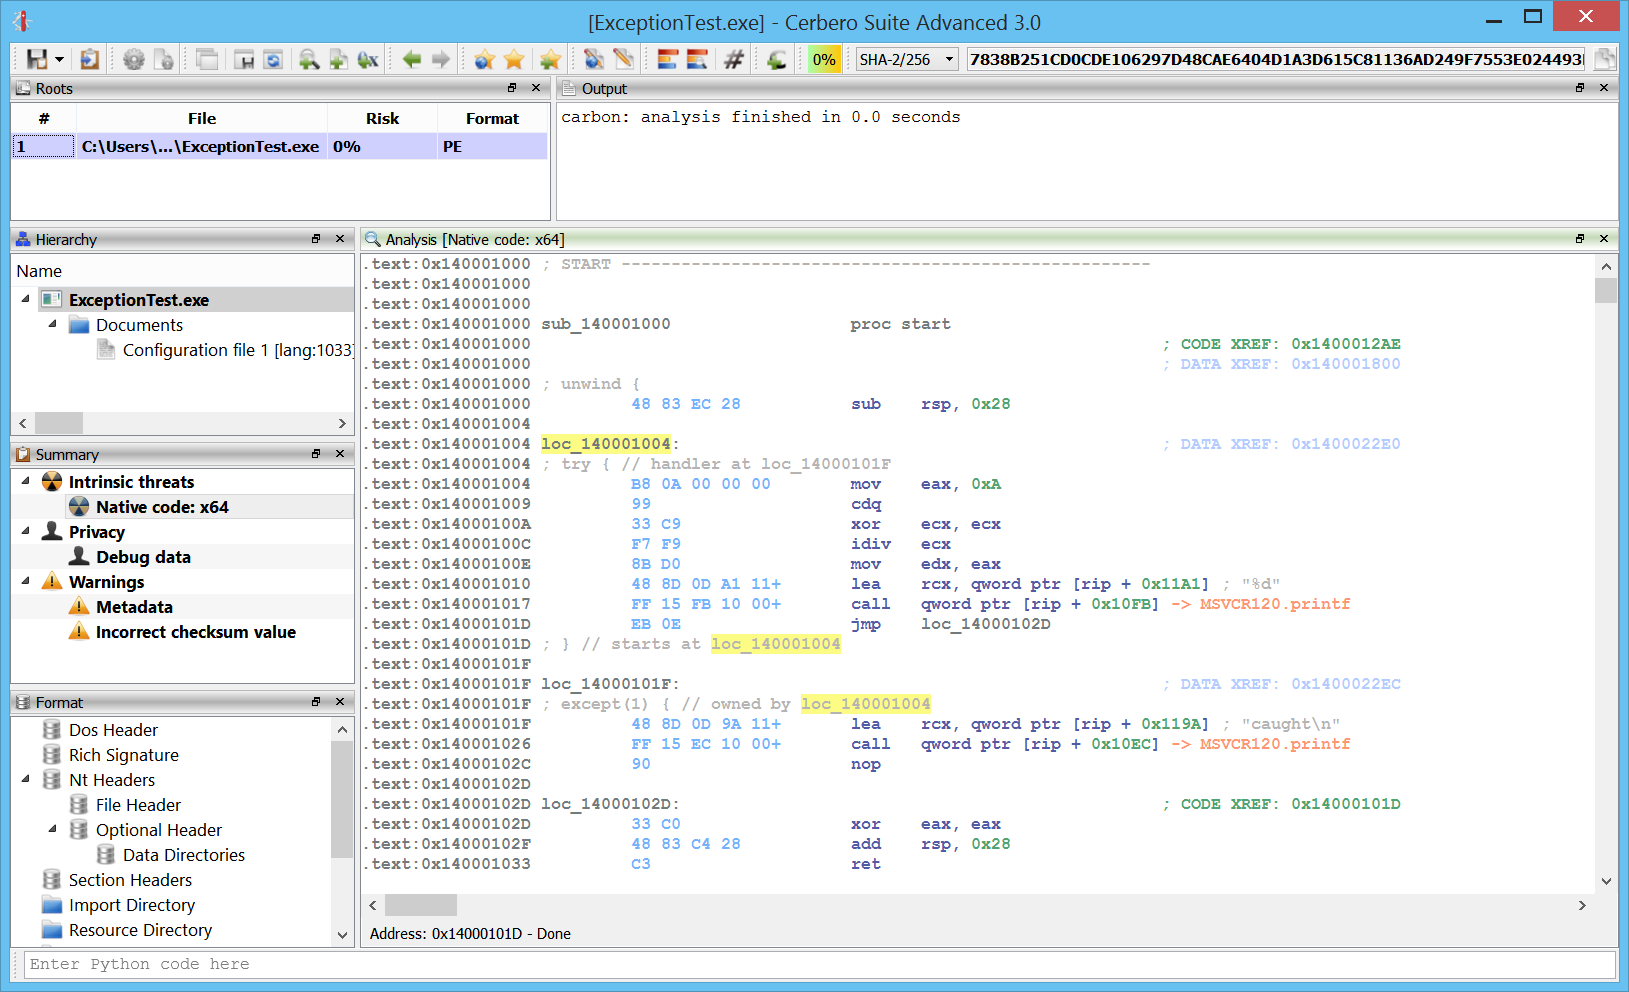
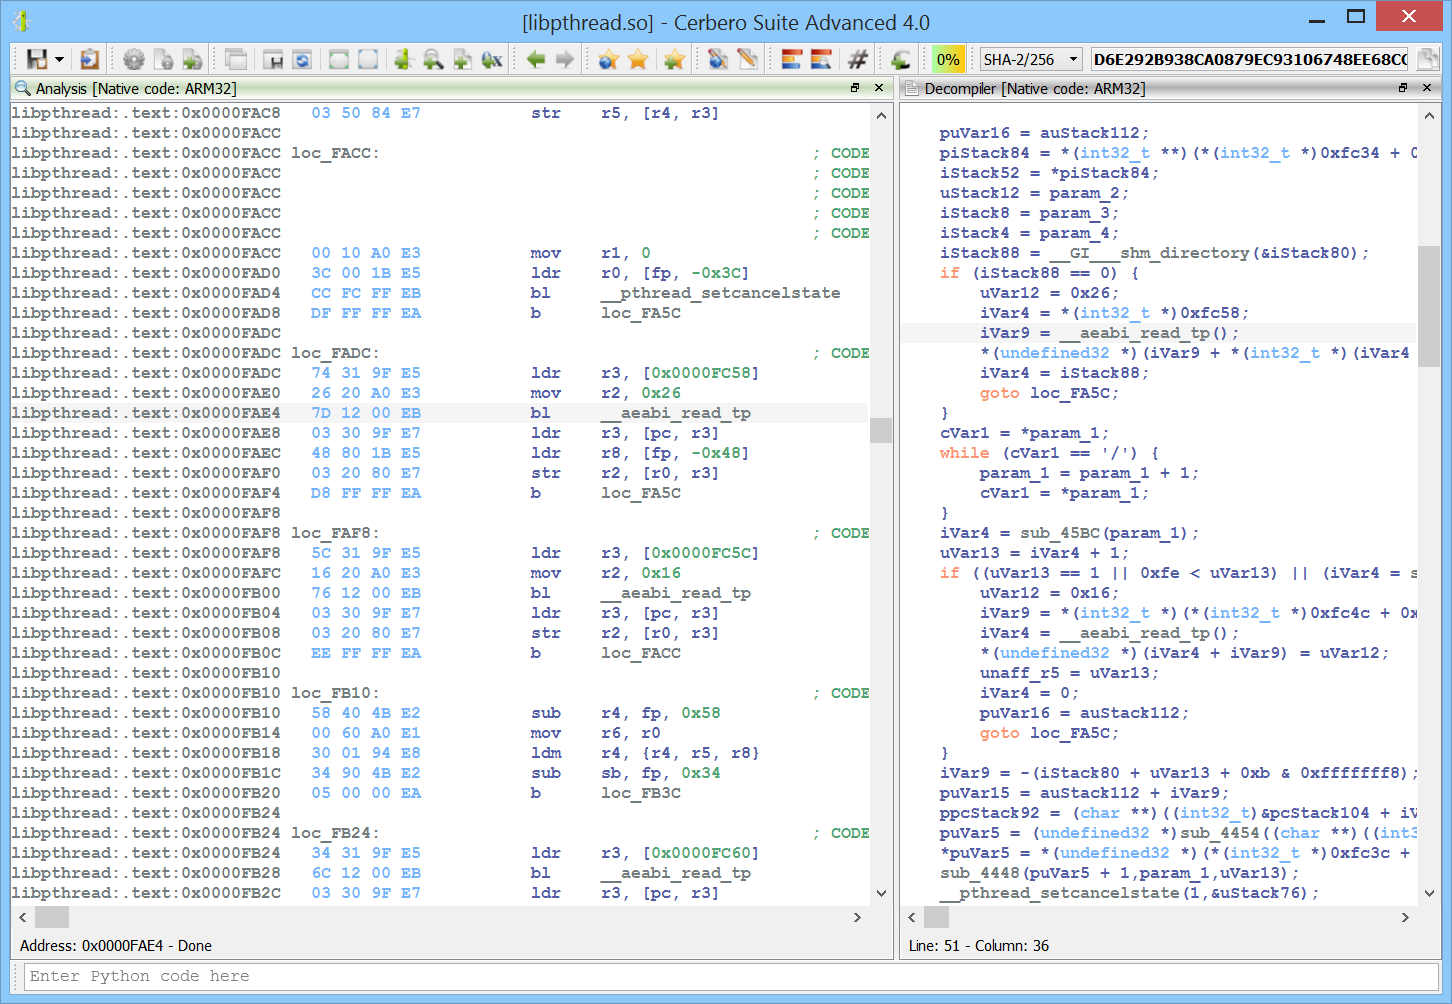
Carbon support for ARM32 and ARM64
ARM32 and ARM64 are now supported in Carbon and naturally also in the Sleigh decompiler!
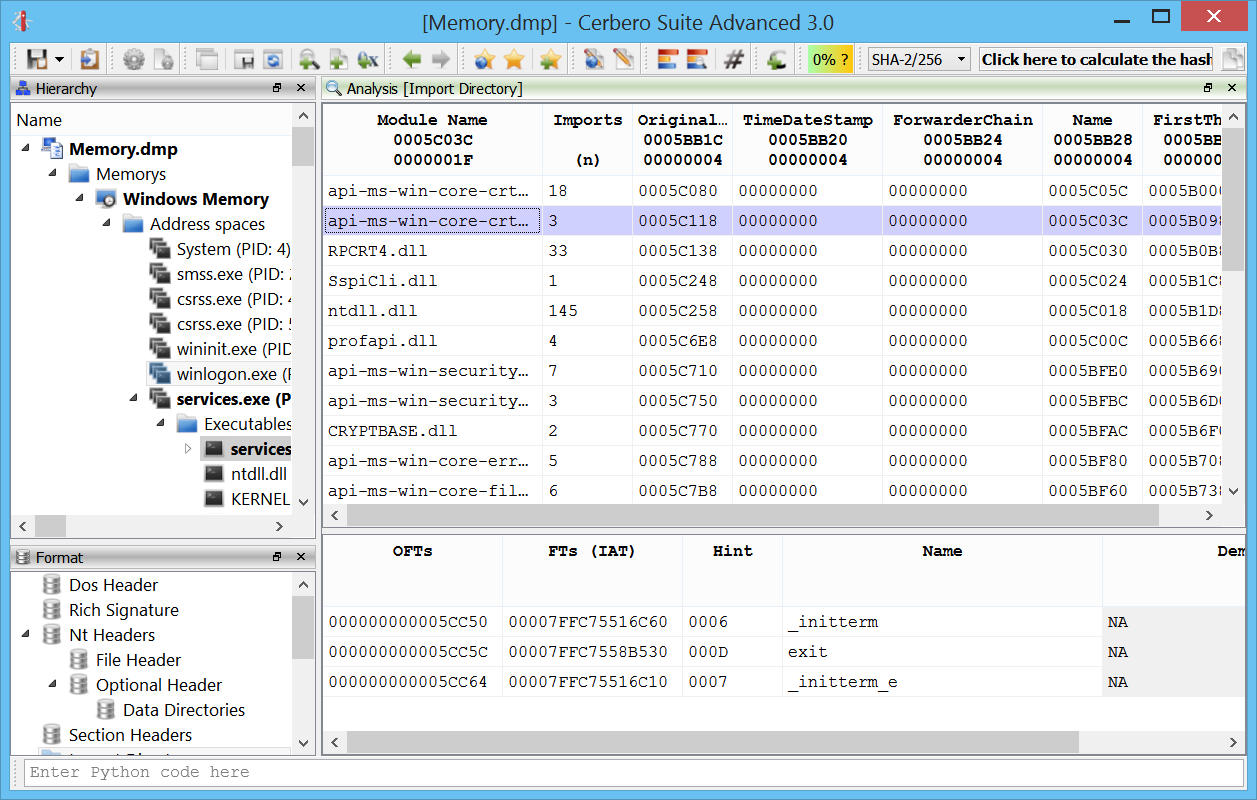
Carbon loader for Windows user address space
Every Windows address space can now be explored in Carbon, be it from a physical image or from a crash dump.

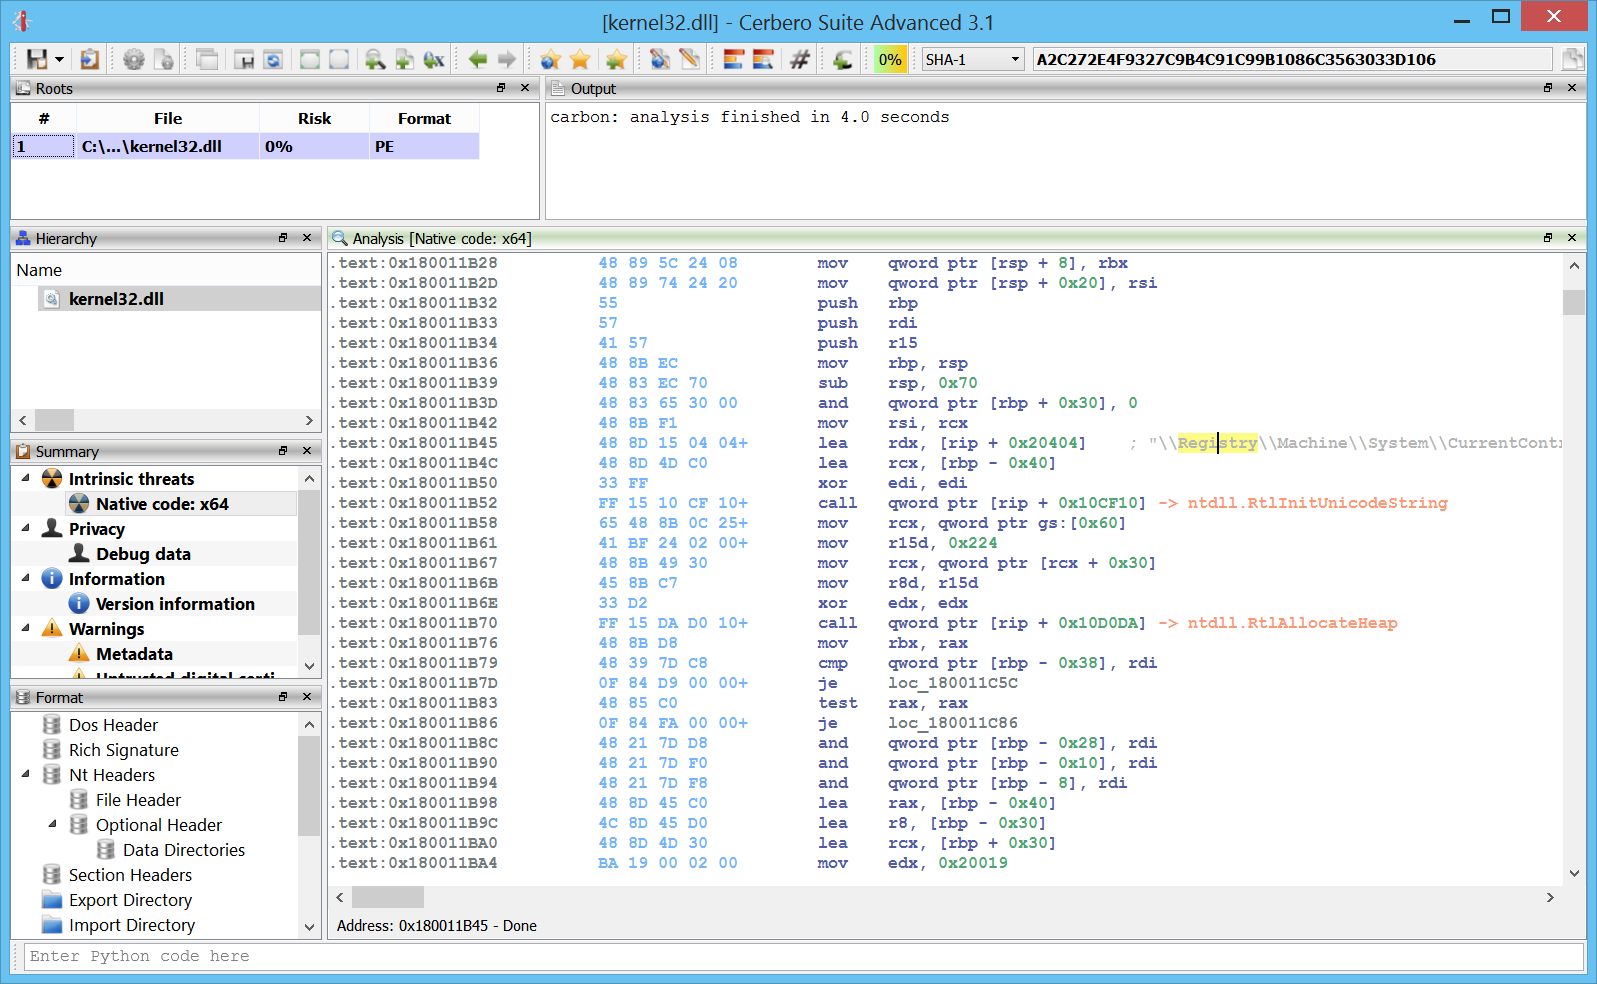
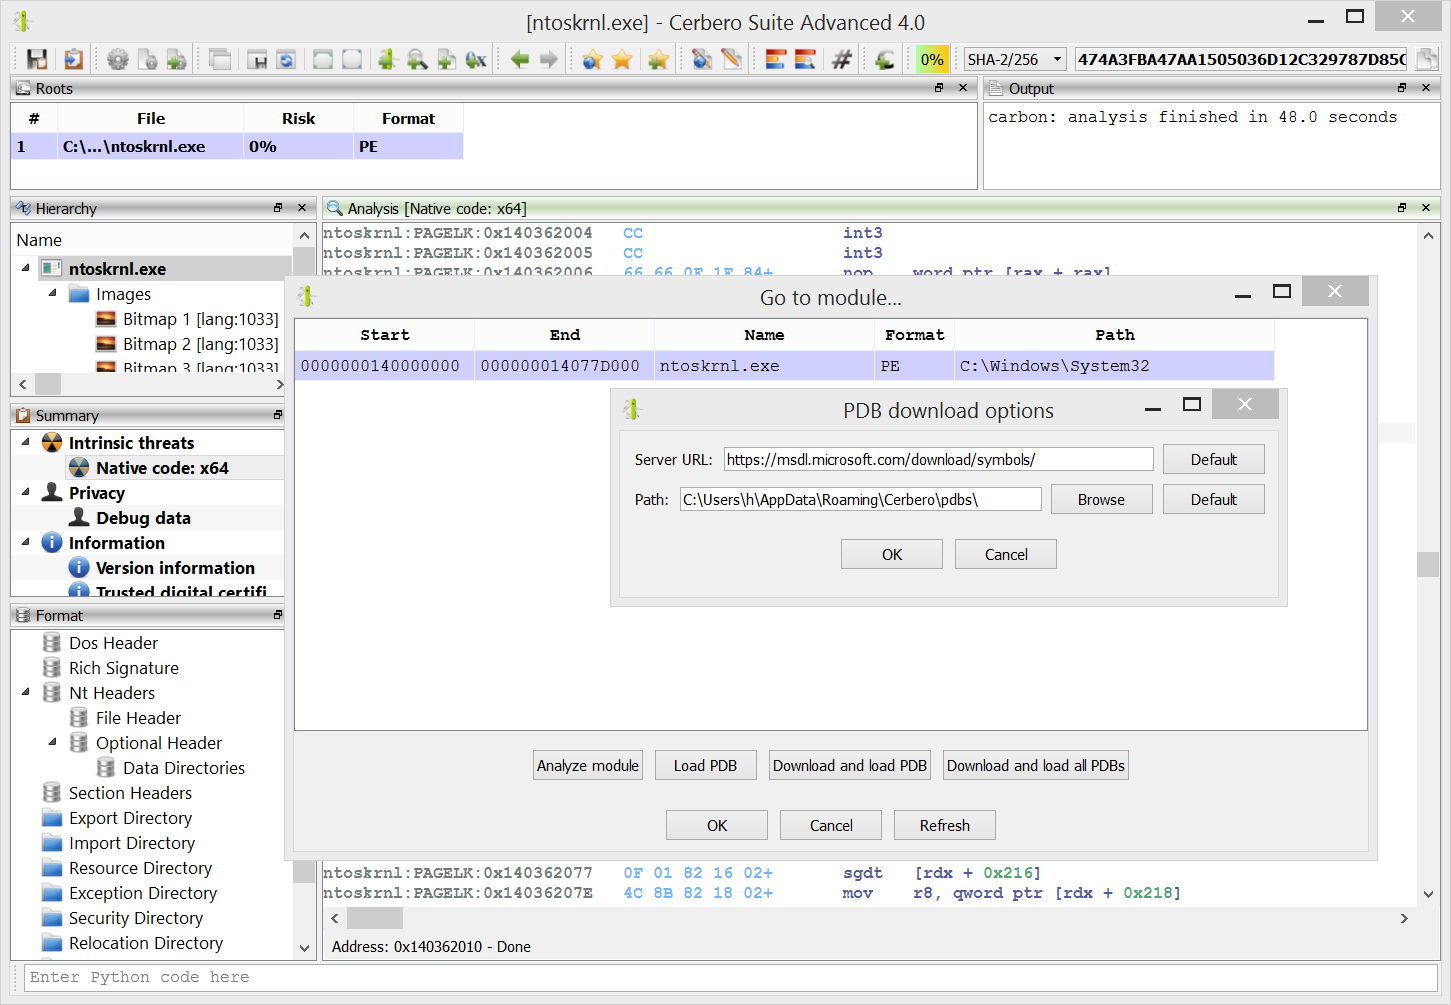
Carbon support for PDB symbols
PDB files can be automatically downloaded and imported into Carbon. This feature does not rely on Windows APIs and works on every supported platform.
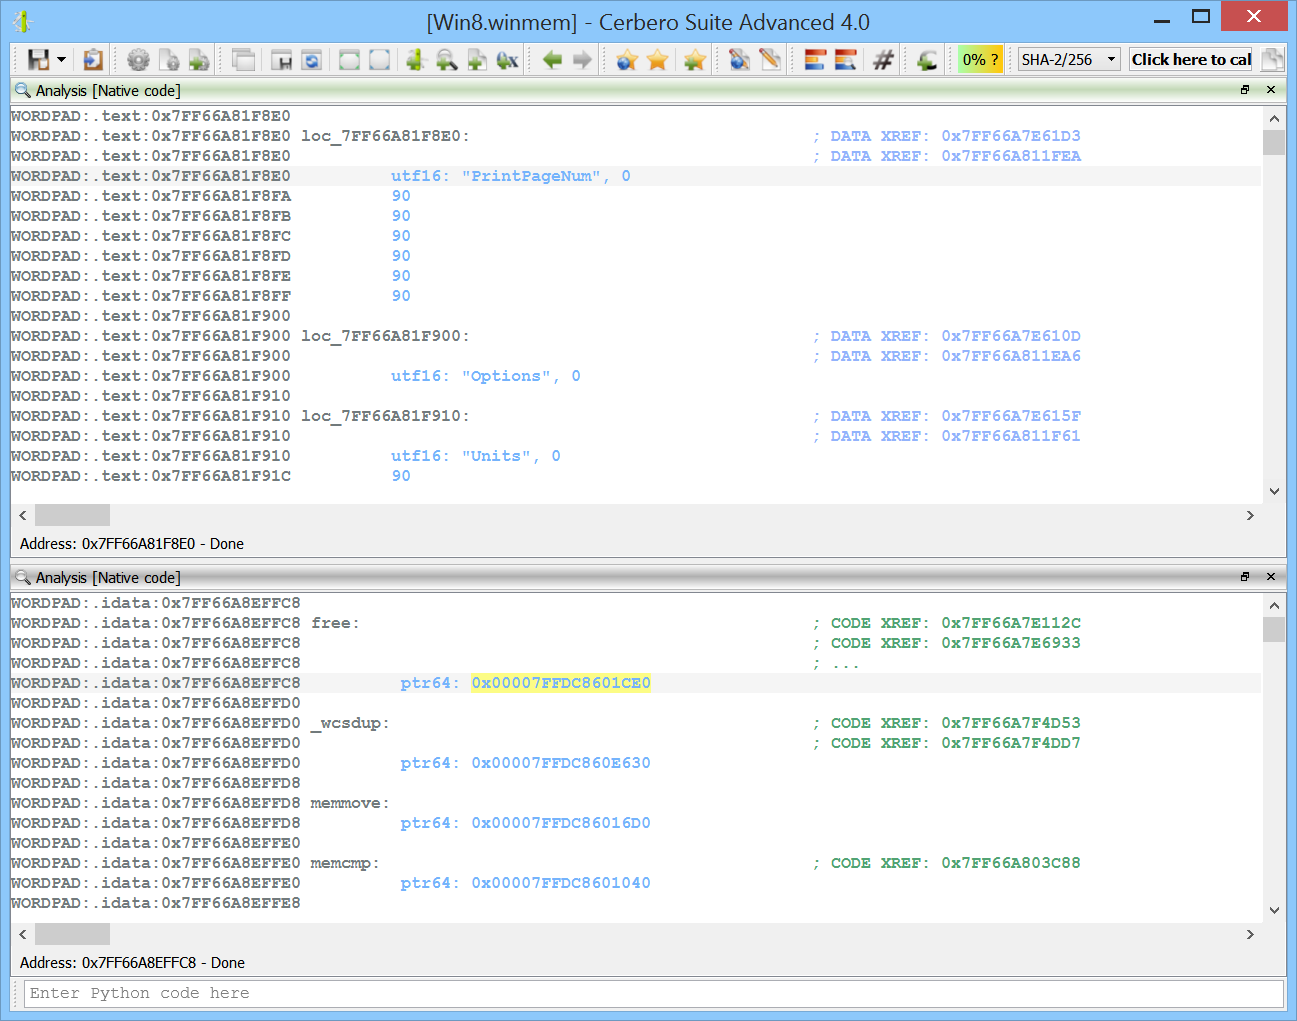
Defining data types in Carbon
Data types can be defined in Carbon by pressing “D” or via the context menu.
The same data type can be reapplied by pressing “W”.
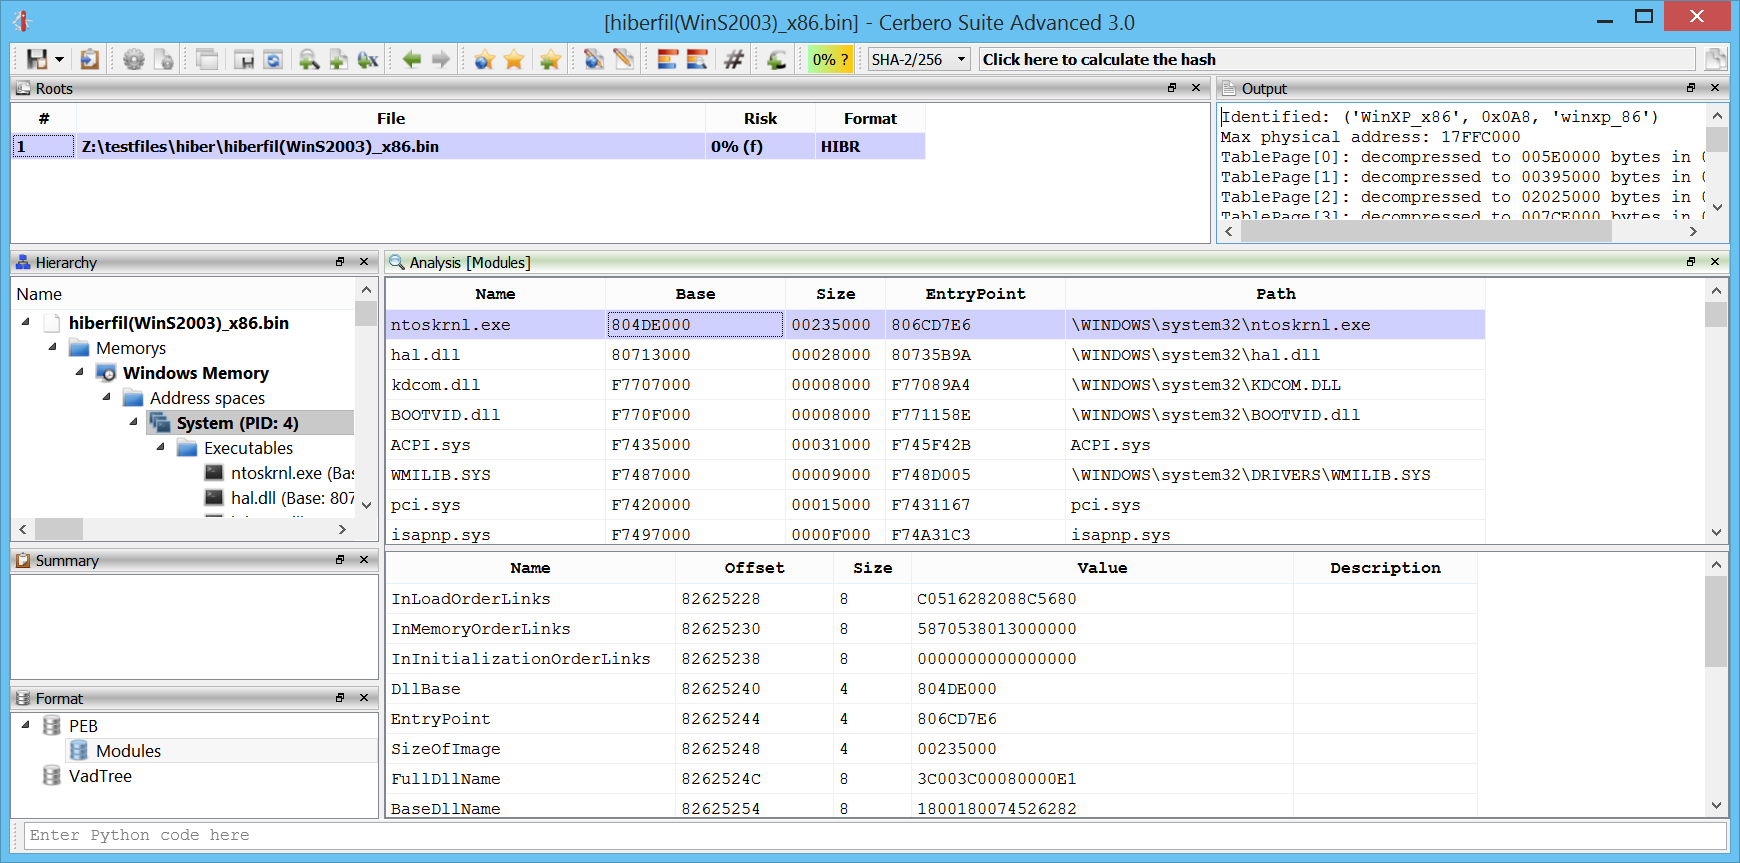
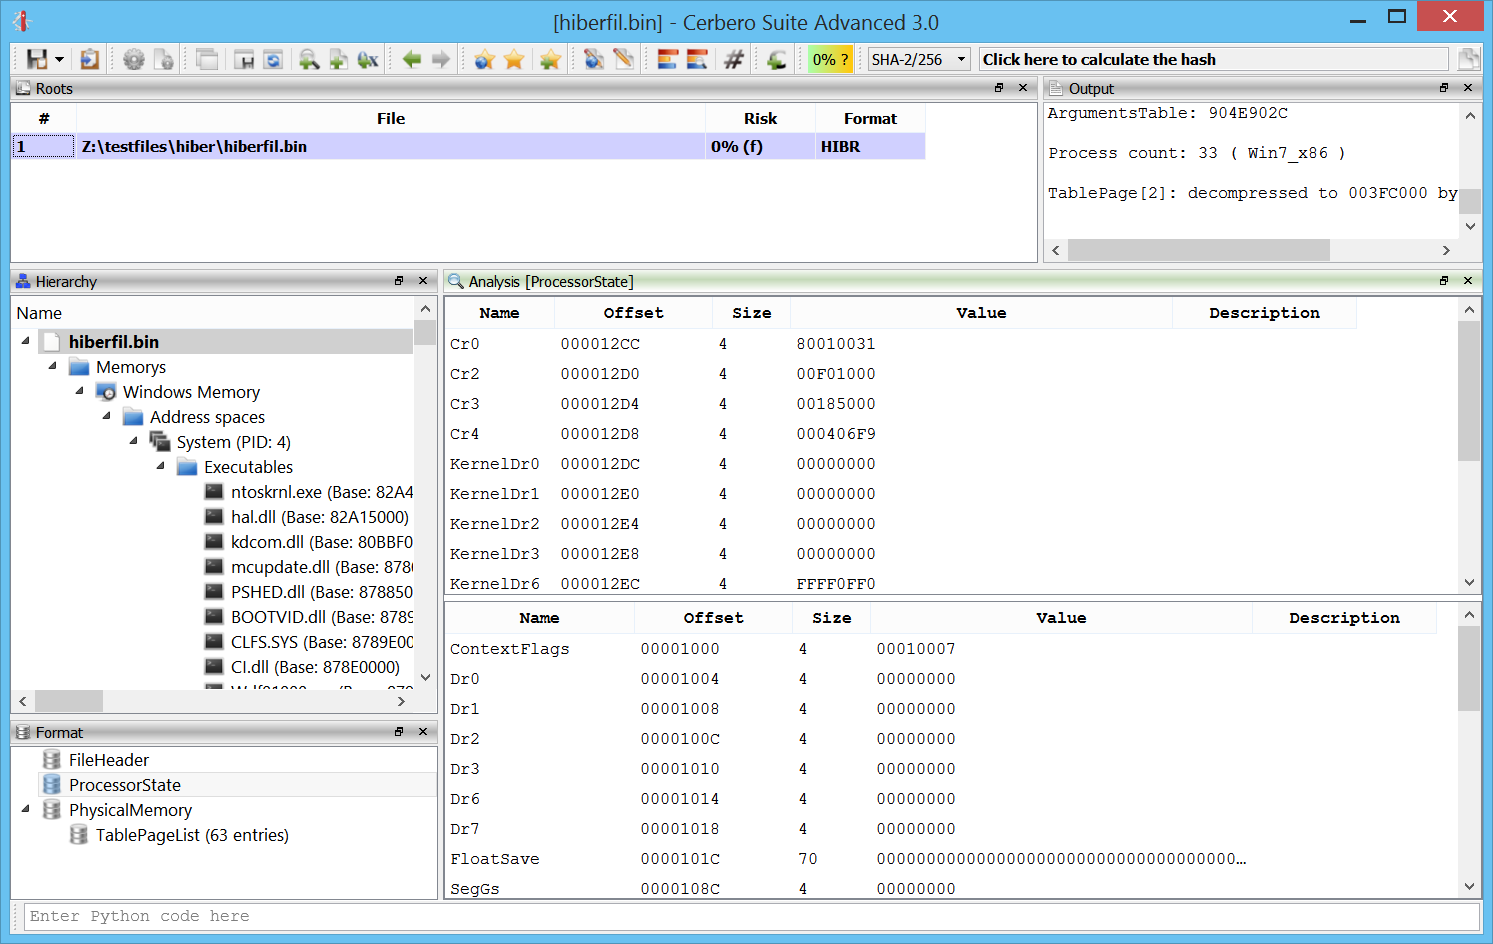
Memory analysis on the latest Windows 10 versions
We added the headers necessary to perform memory analysis on the latest Windows 10 versions.
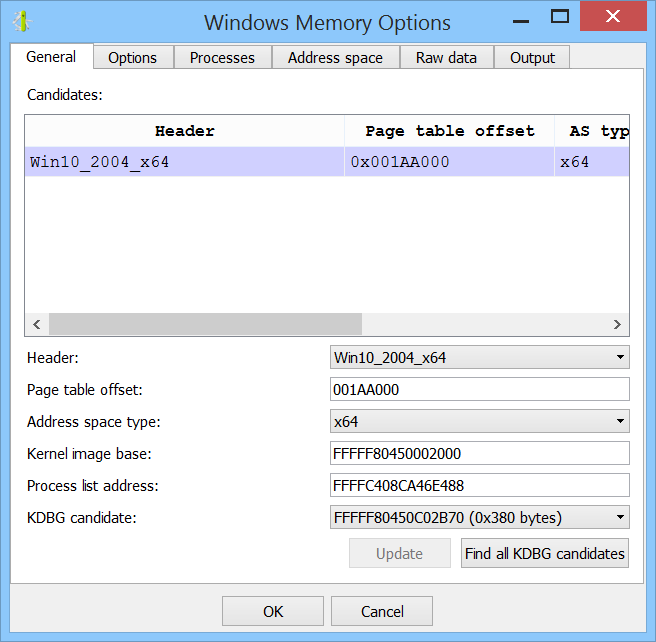
Throughout the lifetime of the 4.x series, we’ll continue improving on the support for Windows 10!
Windows x64 edition
A Windows x64 edition has been long overdue, but we didn’t want to deprive our users from being able to run Cerbero Suite on older 32-bit versions of Windows, so we decided to keep both x86 and x64 editions!
UI hook extensions
A new type of extension has been introduced. The purpose of this extension type is to provide additional UI elements for specific parts of the UI. We currently use it to create Python plugins in our settings page.
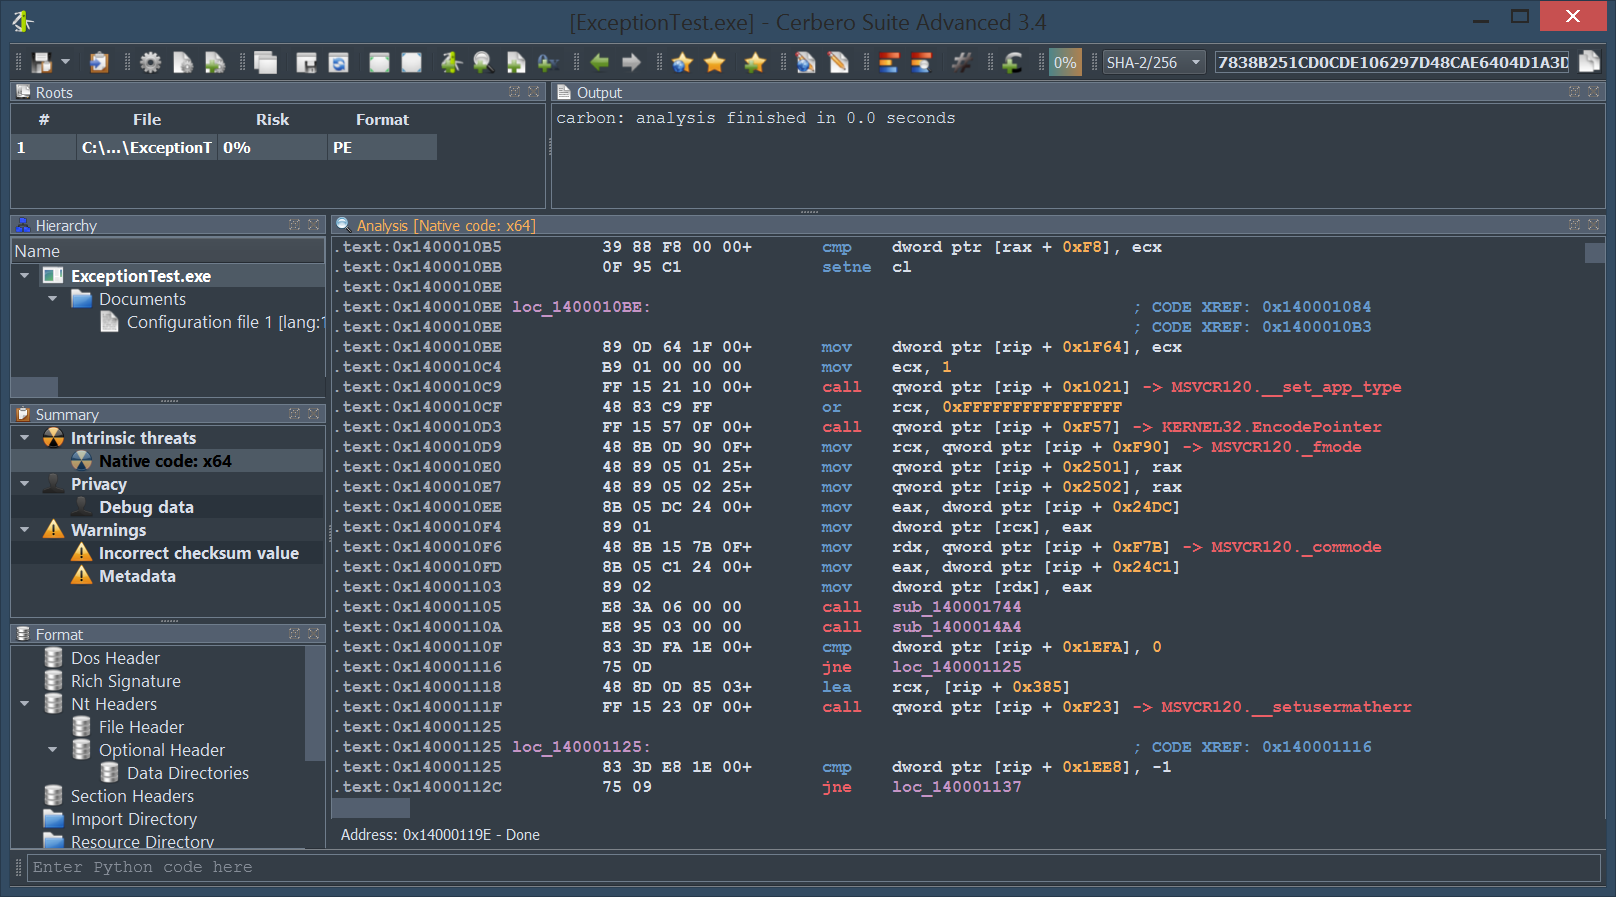
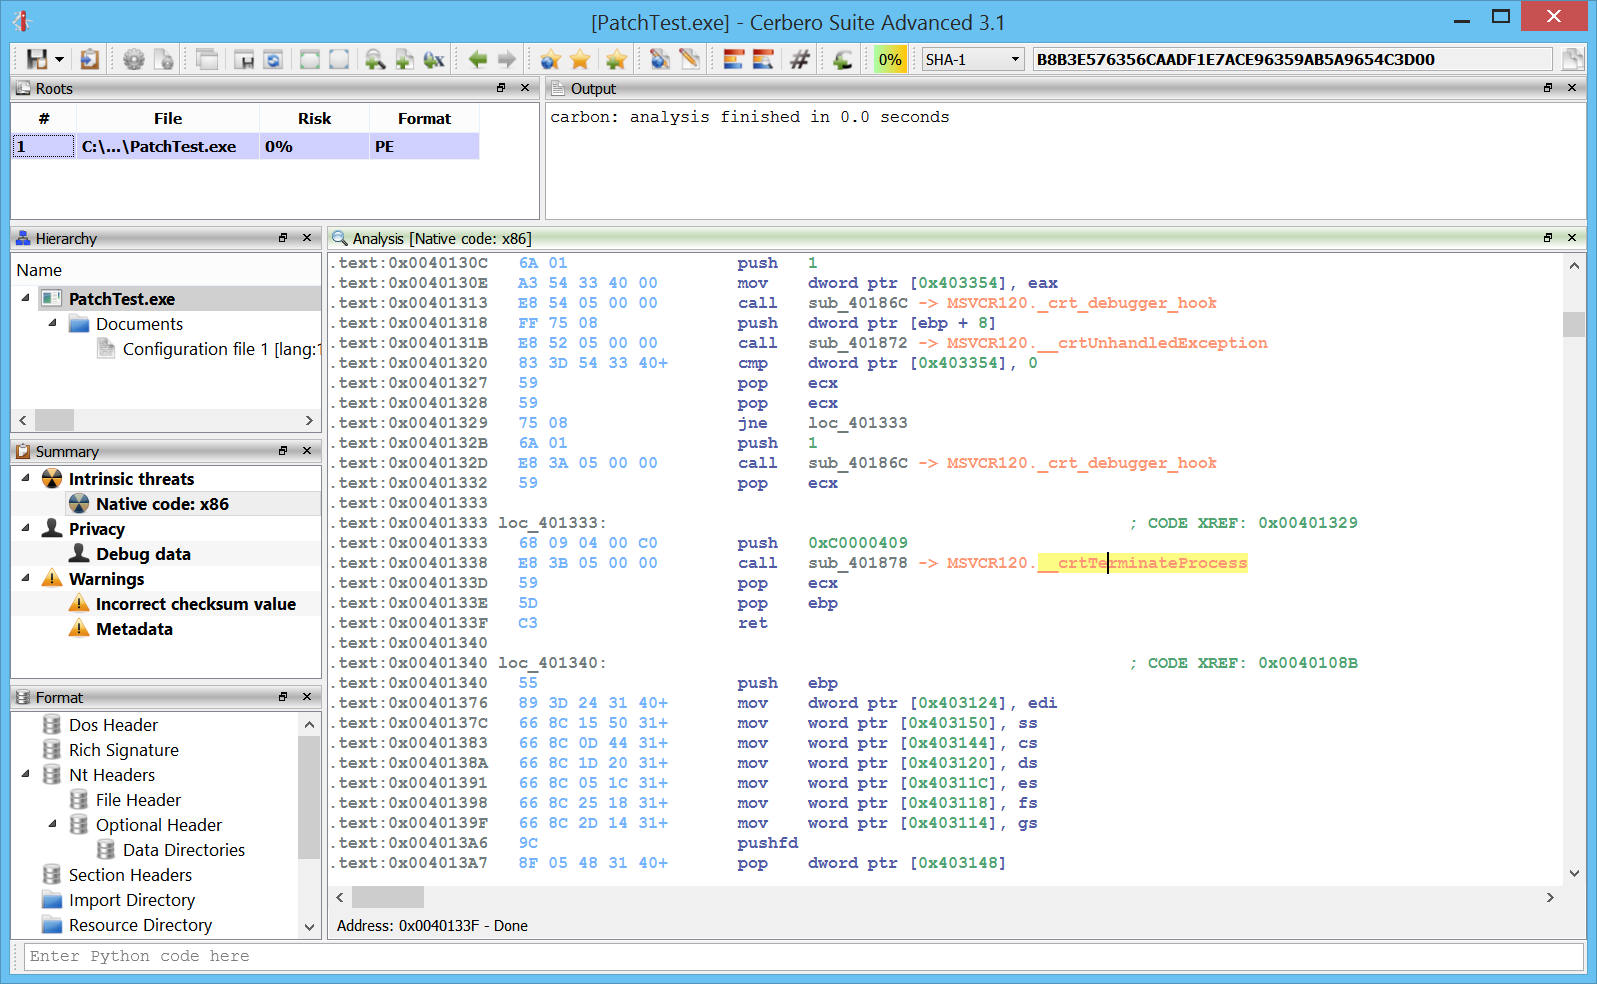
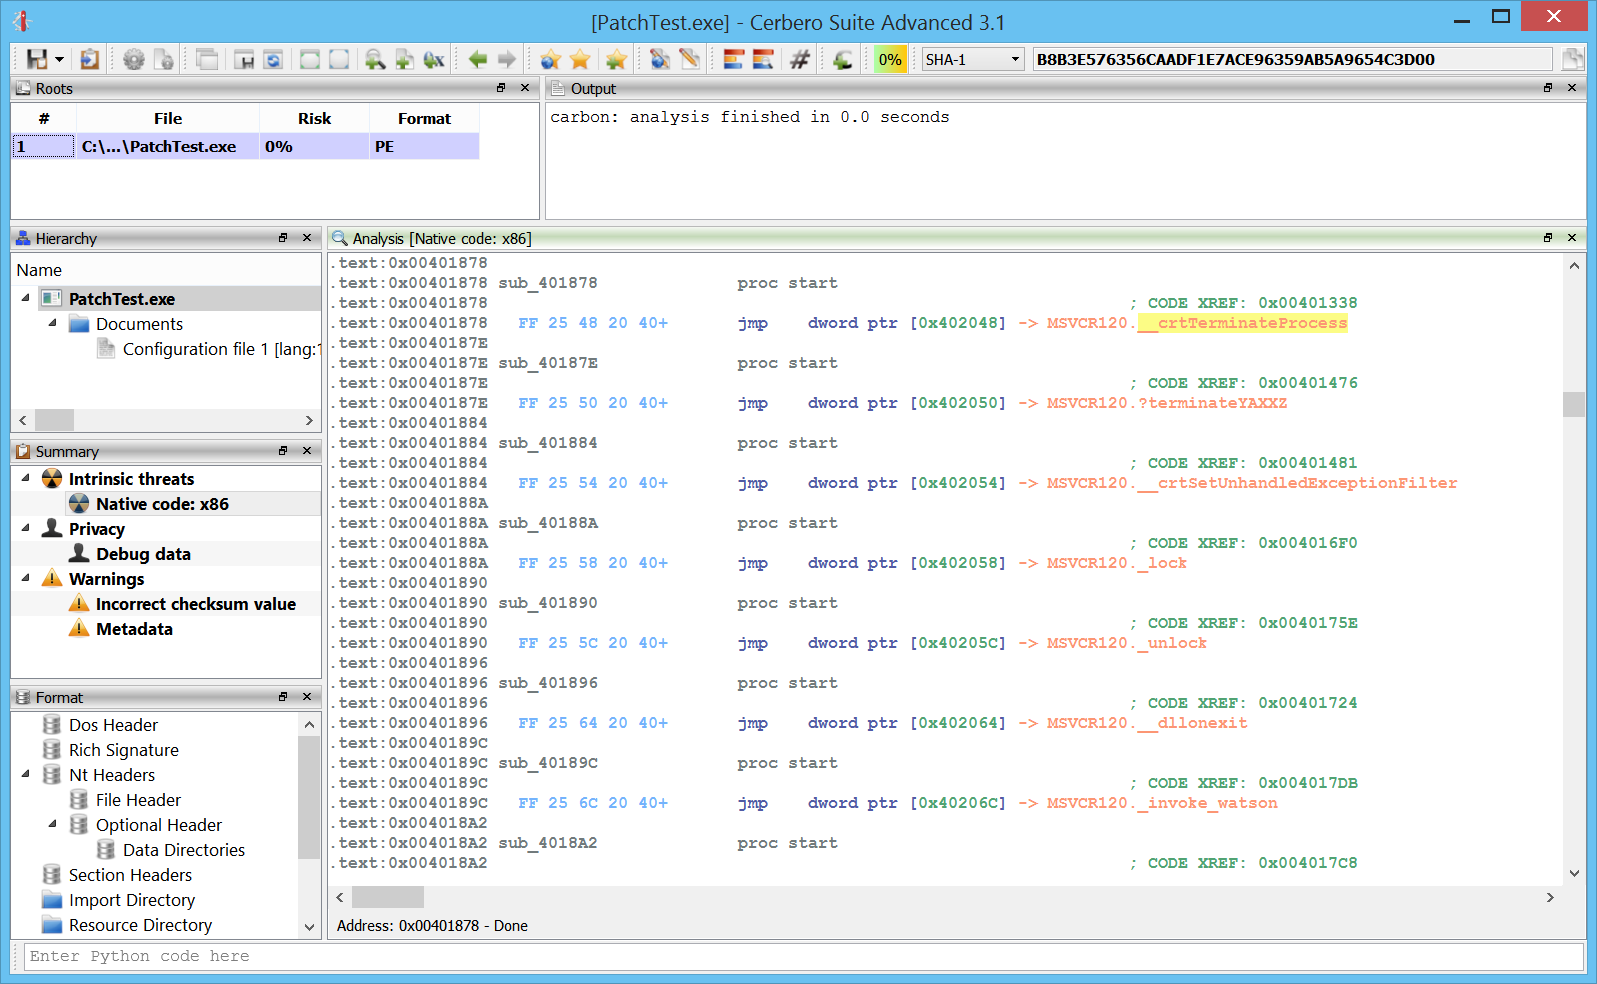
Improved Carbon disassembly
We have improved Carbon all over the place: the analysis, UI, lists. The experience is now much more refined.
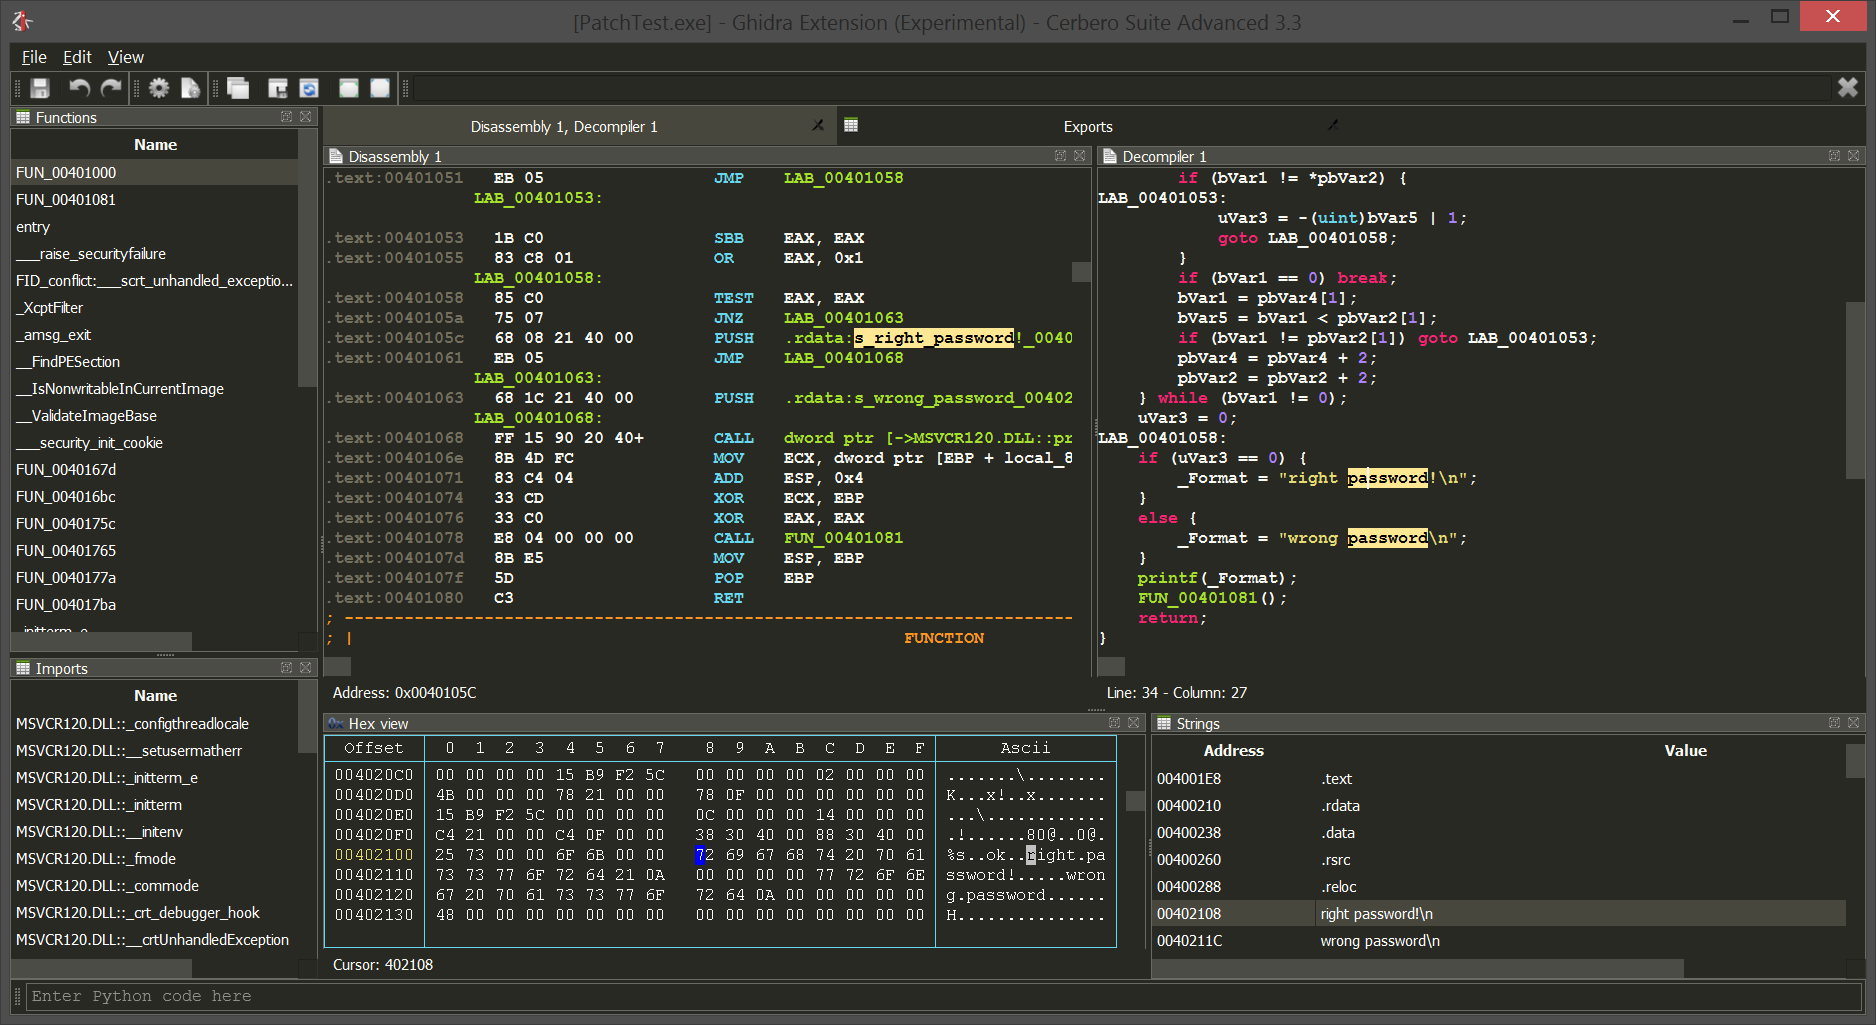
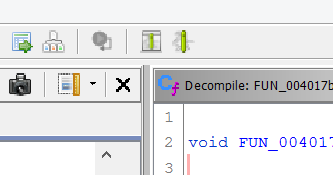
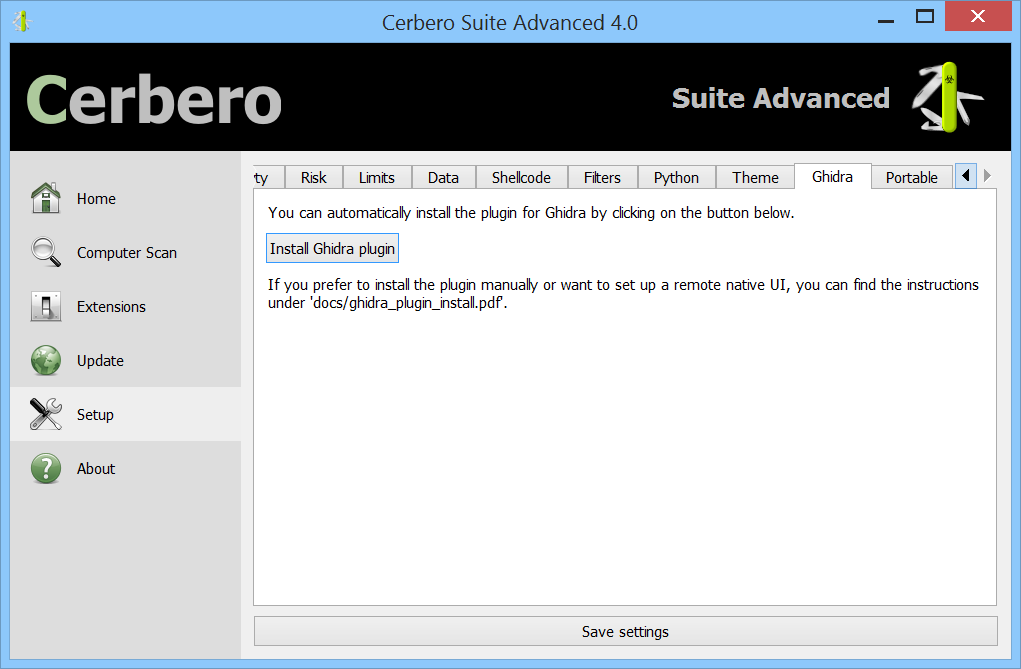
Improved Ghidra plugin and setup
We improved the native UI for Ghidra. By default now the assembly is shown in lower case, as we think it’s easier to read (this feature is configurable).
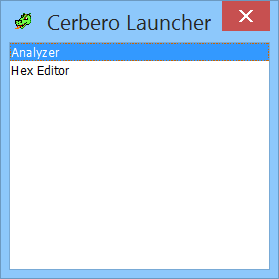
We also added one more toolbar button in Ghidra for the Cerbero Launcher, a way to launch Cerbero tools on the file currently open in Ghidra.
Setting up the native UI for Ghidra is now easier than ever: just go to the settings in Cerbero under ‘Ghidra’ and click on ‘Install Ghidra plugin’, select the root folder of Ghidra and that’s it! Cerbero will take care of the installation for you!
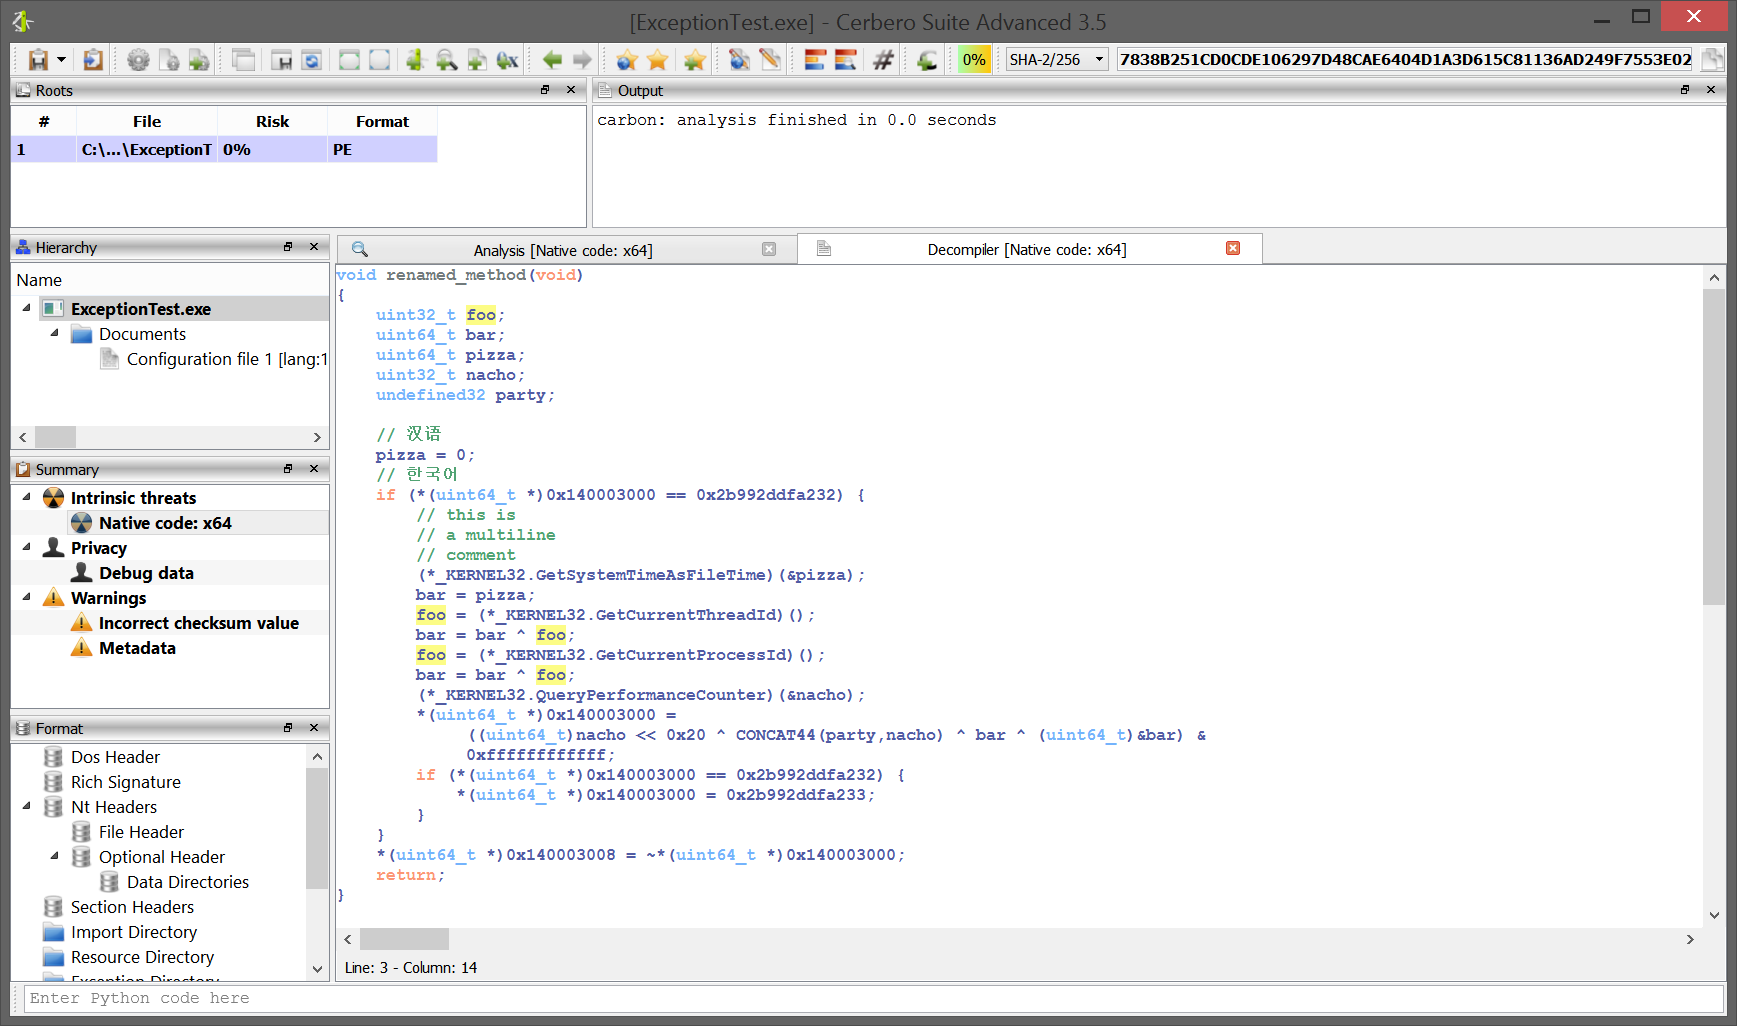
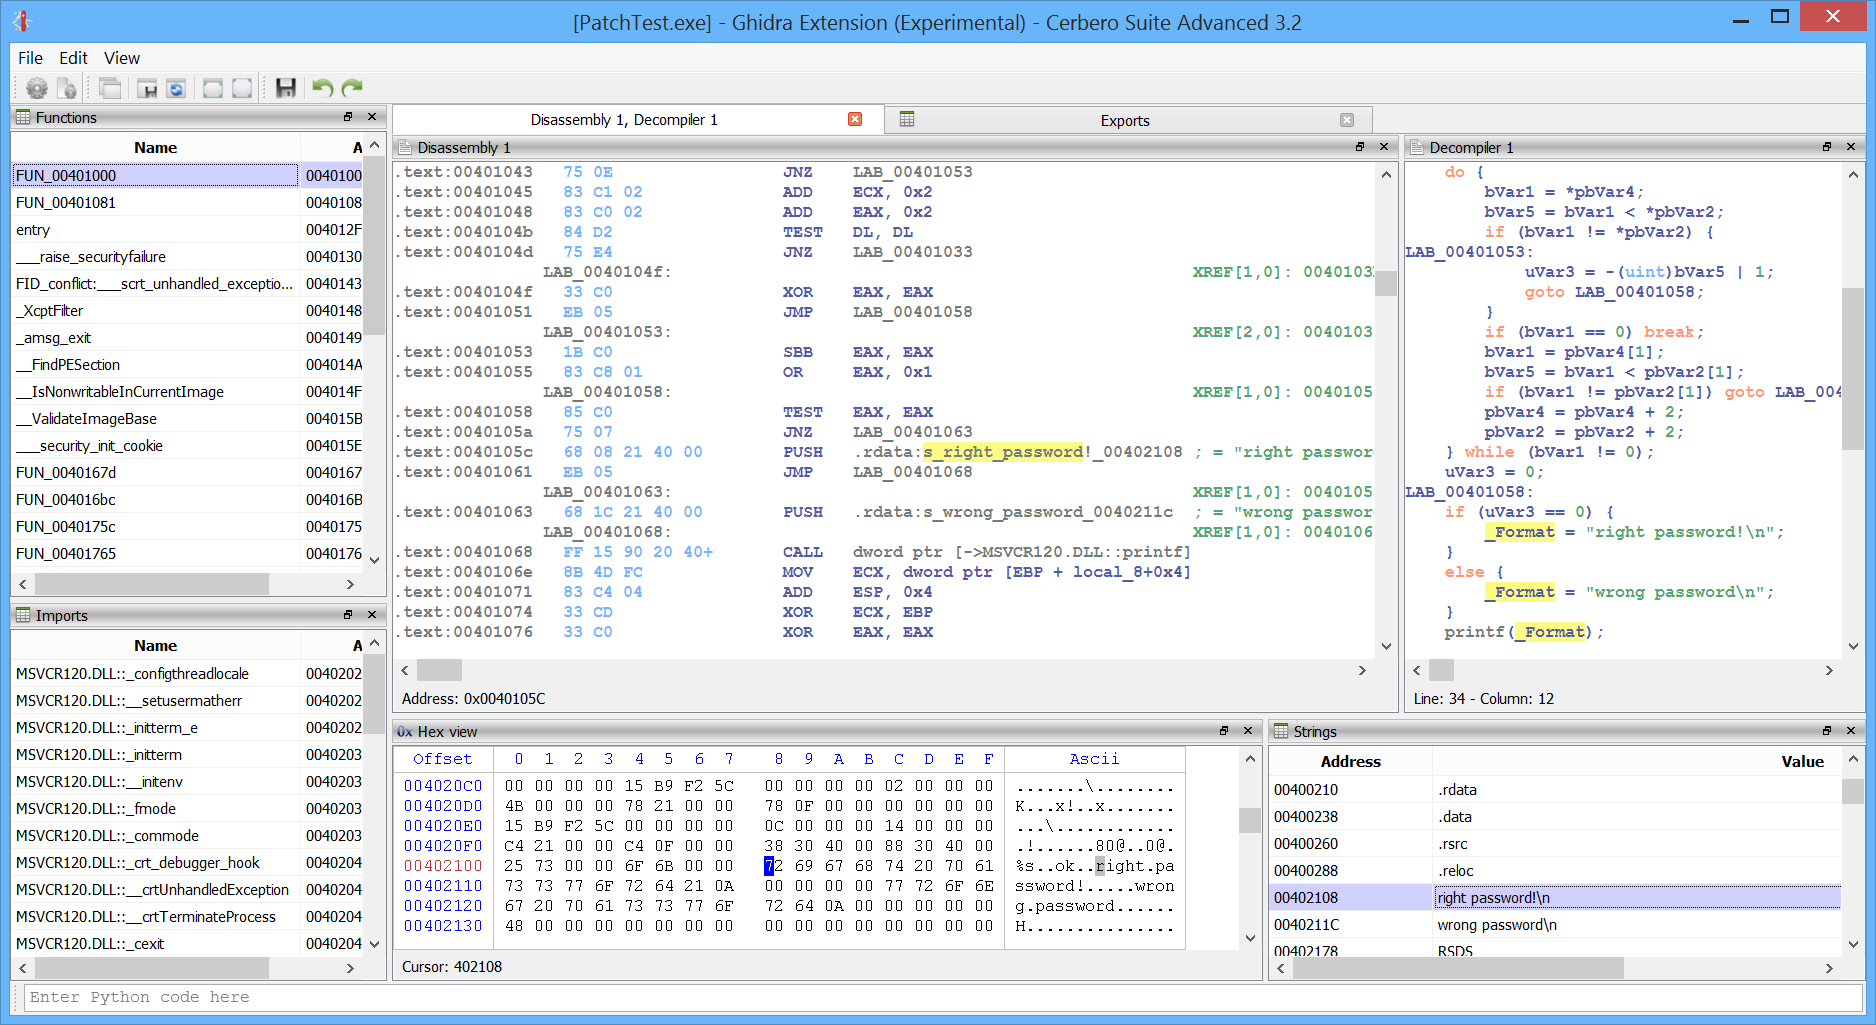
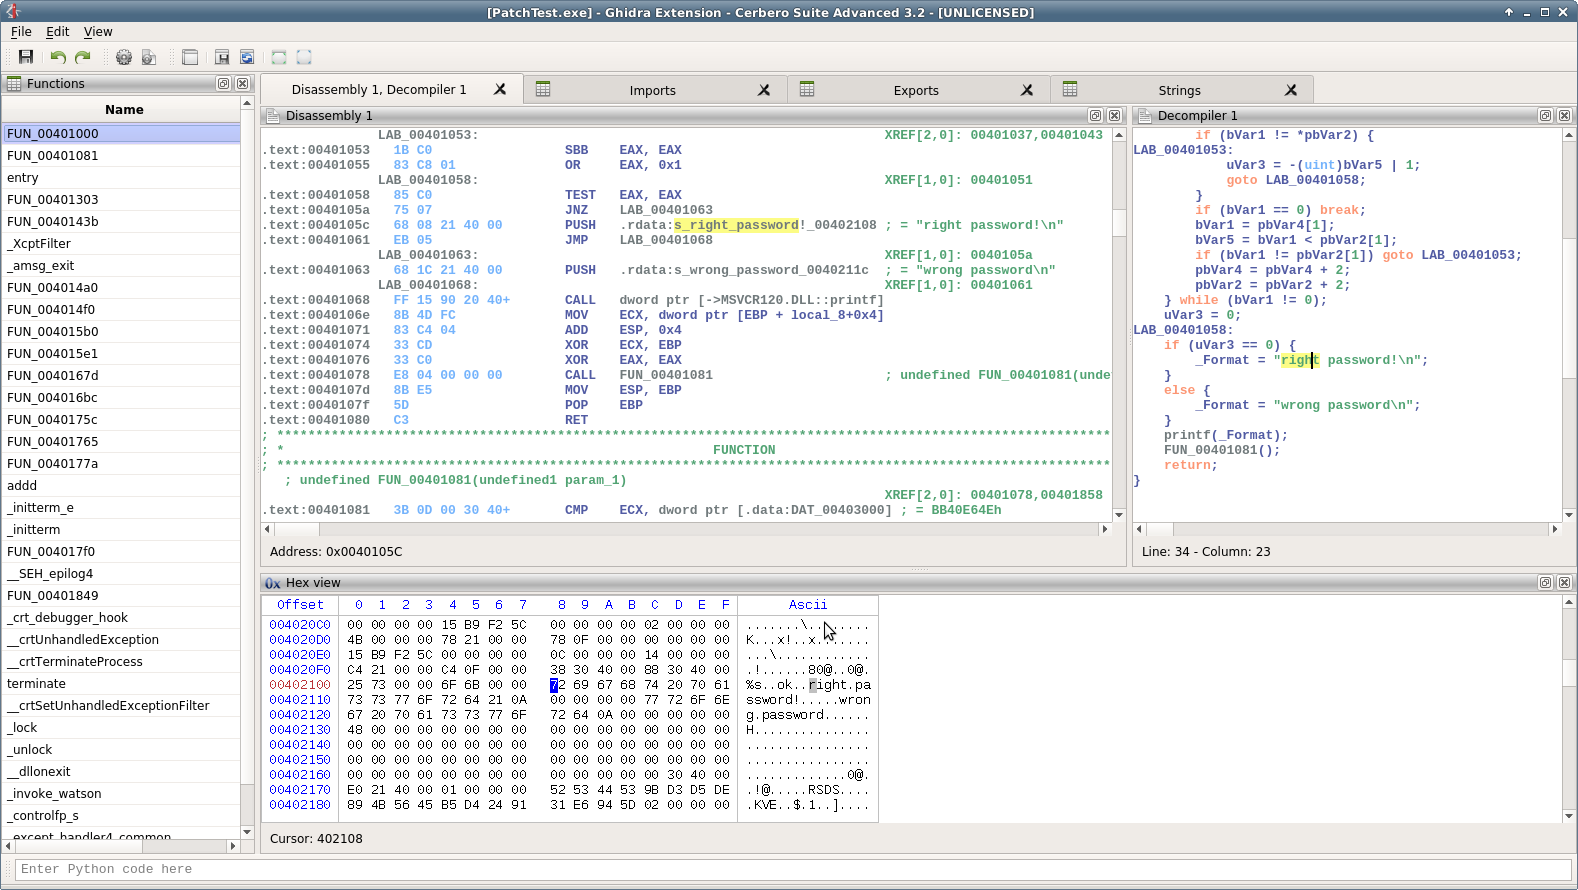
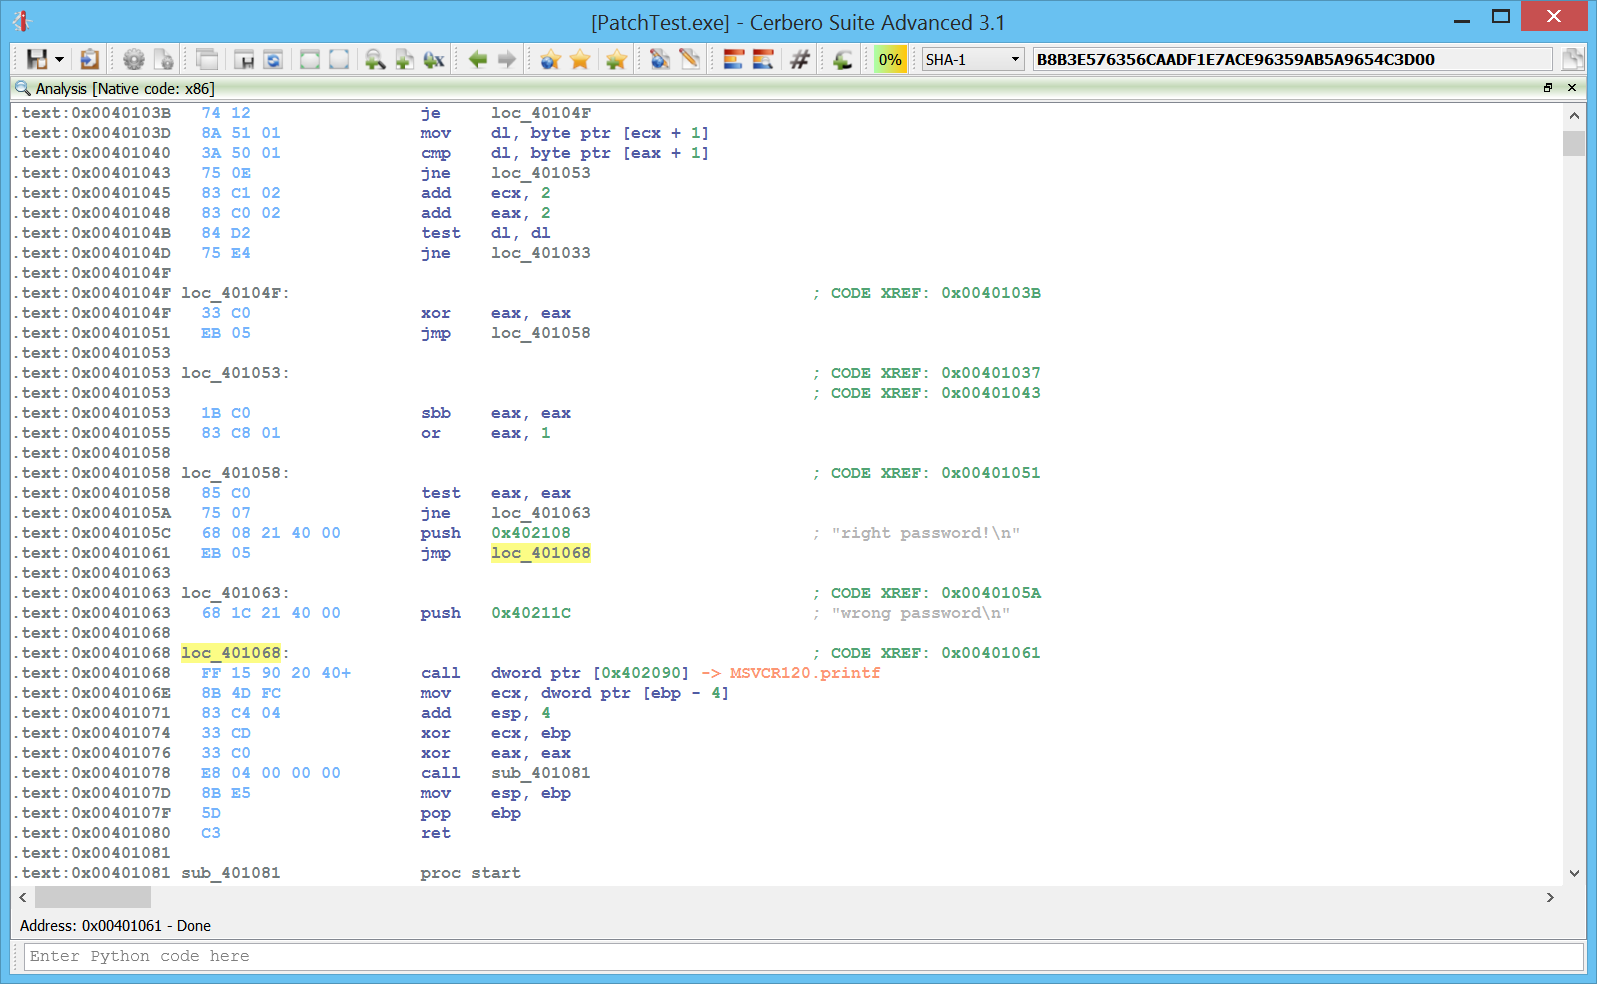
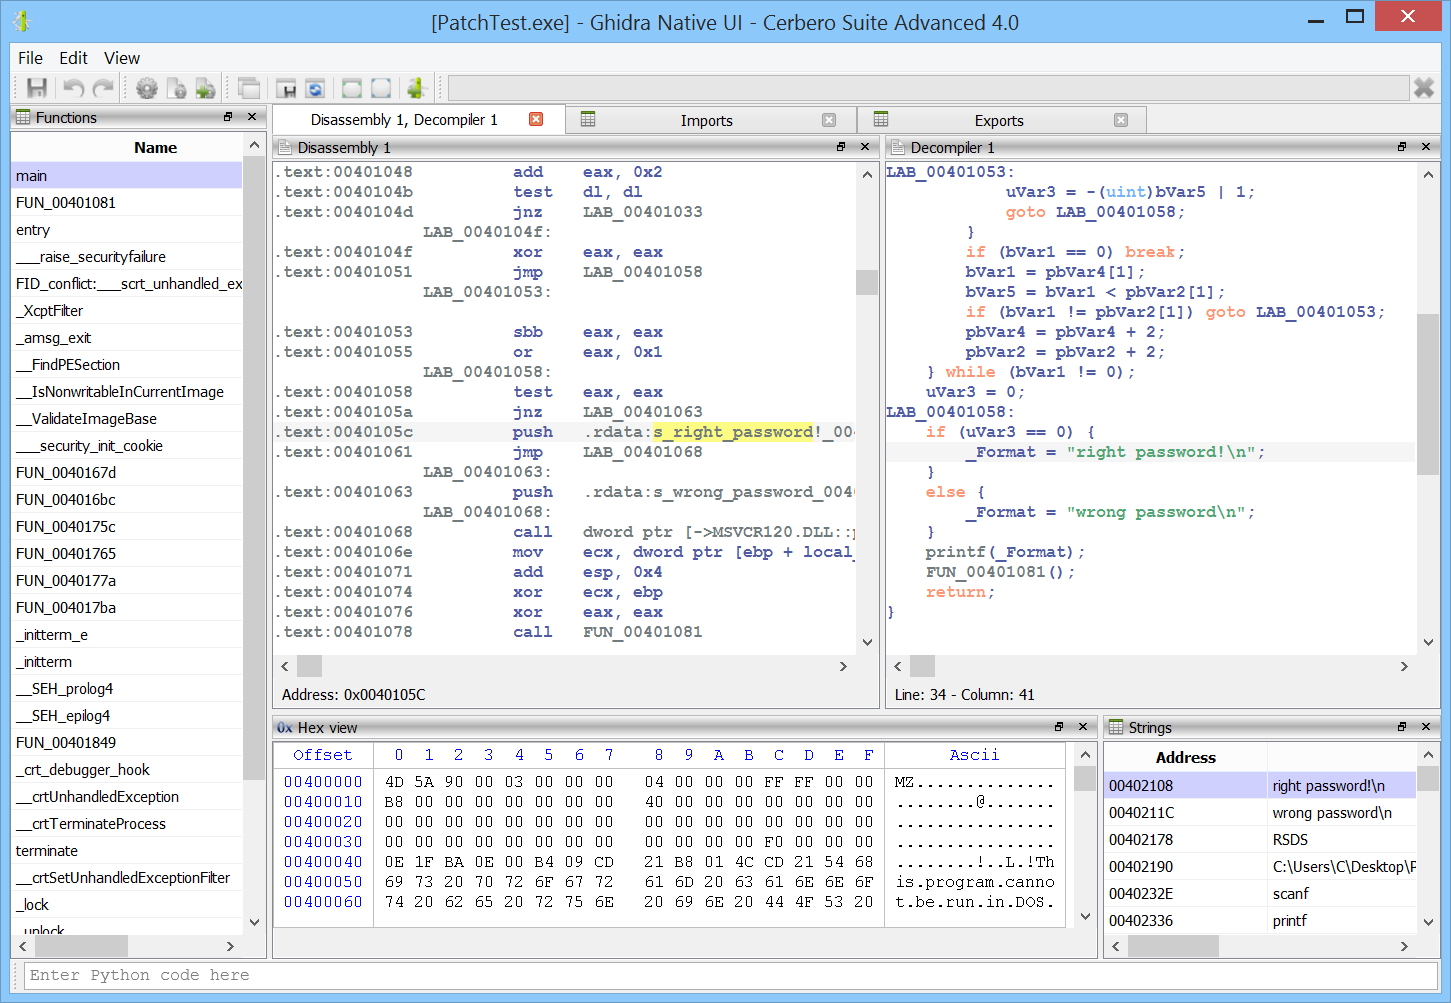
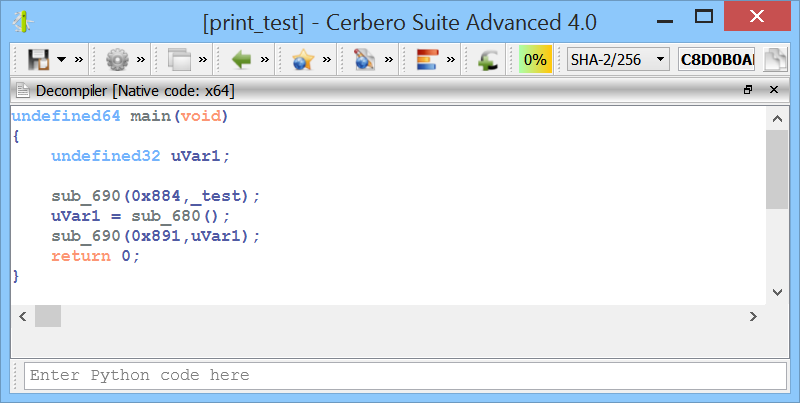
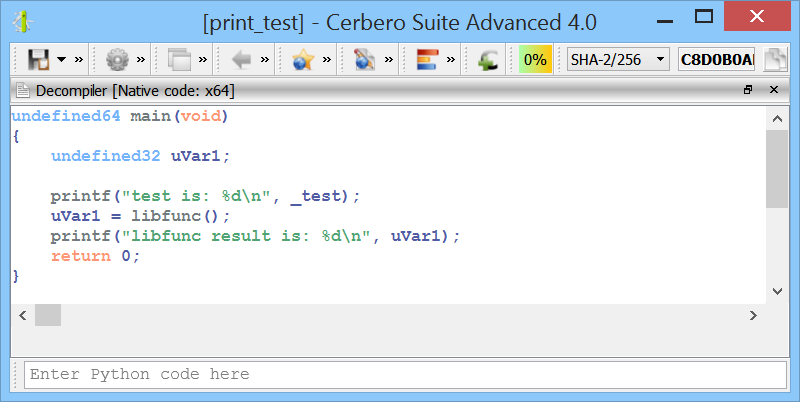
Improved decompiler output
We have improved the decompiler output by inferring the detection of deferred calls and literals from Carbon to it. A before/after screenshot comparison is worth more than a thousand words!
Hex Editor
Apart from fixing some bugs, we have improved the hex editor by providing a wait dialog with progress and abort to every major data operation.
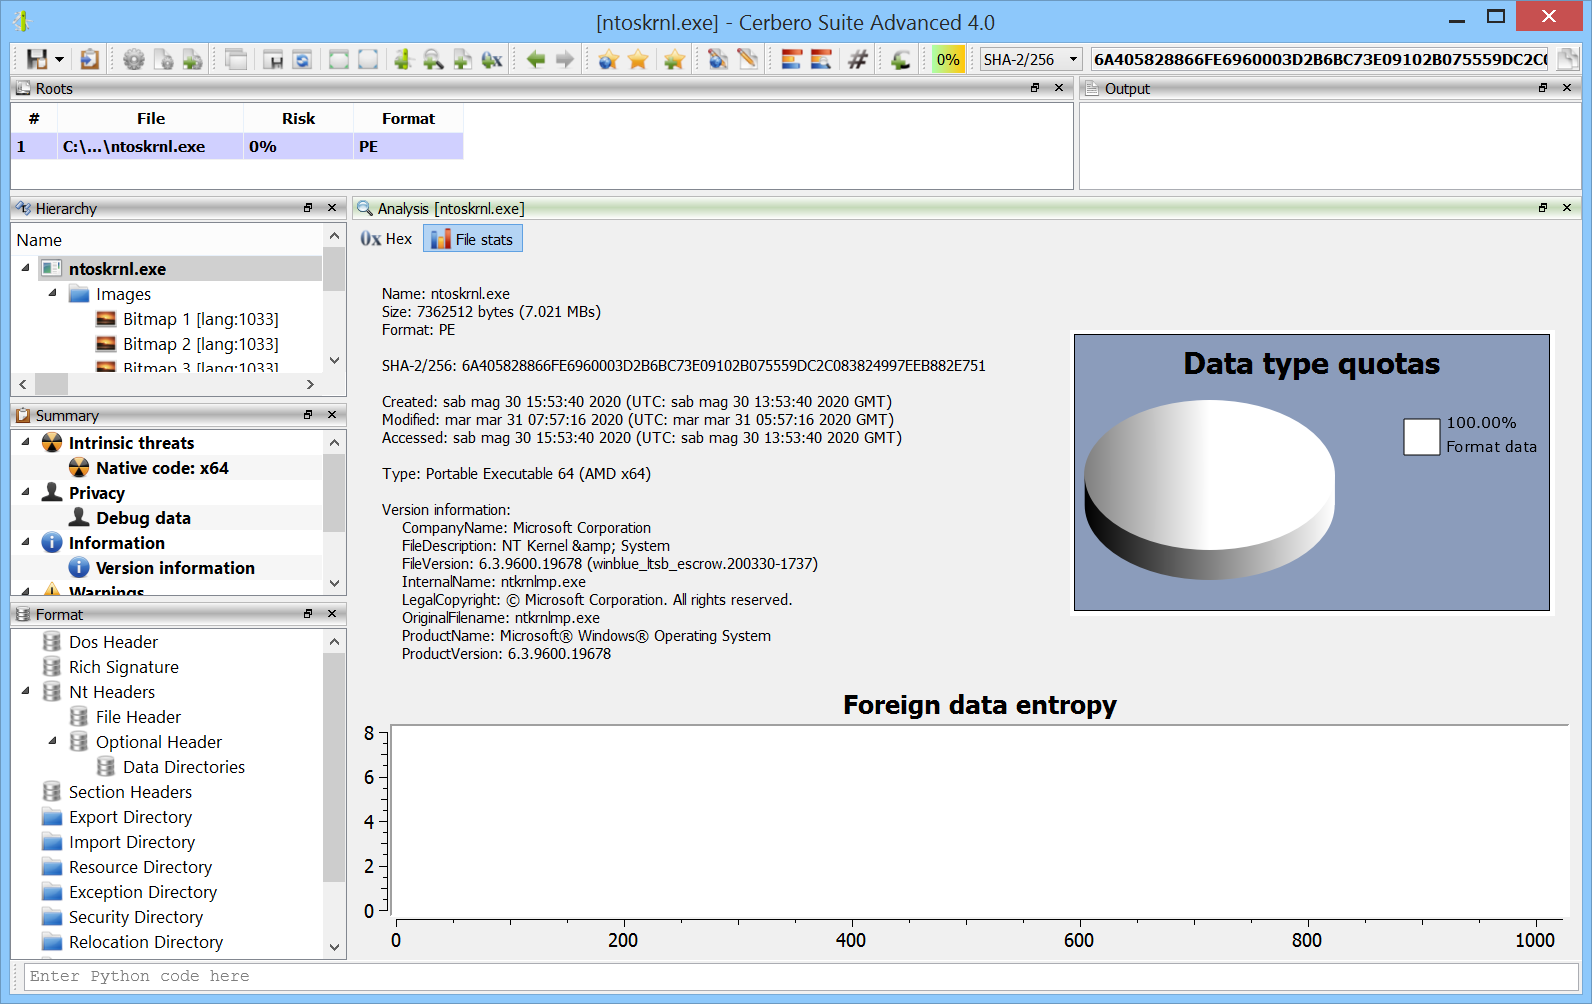
File stats view
We tried to improve the file stats view by providing additional useful information for all the file formats which warranted it.
Improved symbol demangling
We have greatly improved symbols demangling both for Visual C++ and GCC. All type of mangled symbols are supported now!
Improved speed of Python
We now deploy the bytecode files for all our Python plugins in order to decrease their load time.
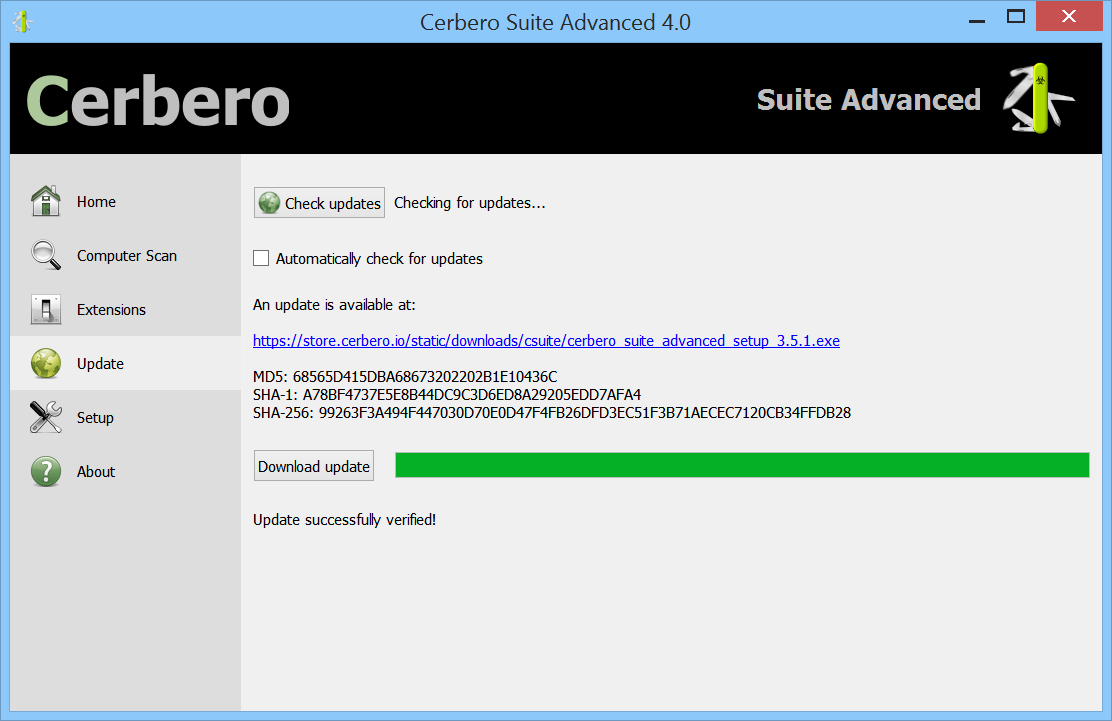
Improved updates
Cerbero Suite 4 makes the update process even easier than before. Hashes for updates have always been cryptographically verified, but now you can opt to download the update directly from the UI and that too is verified.
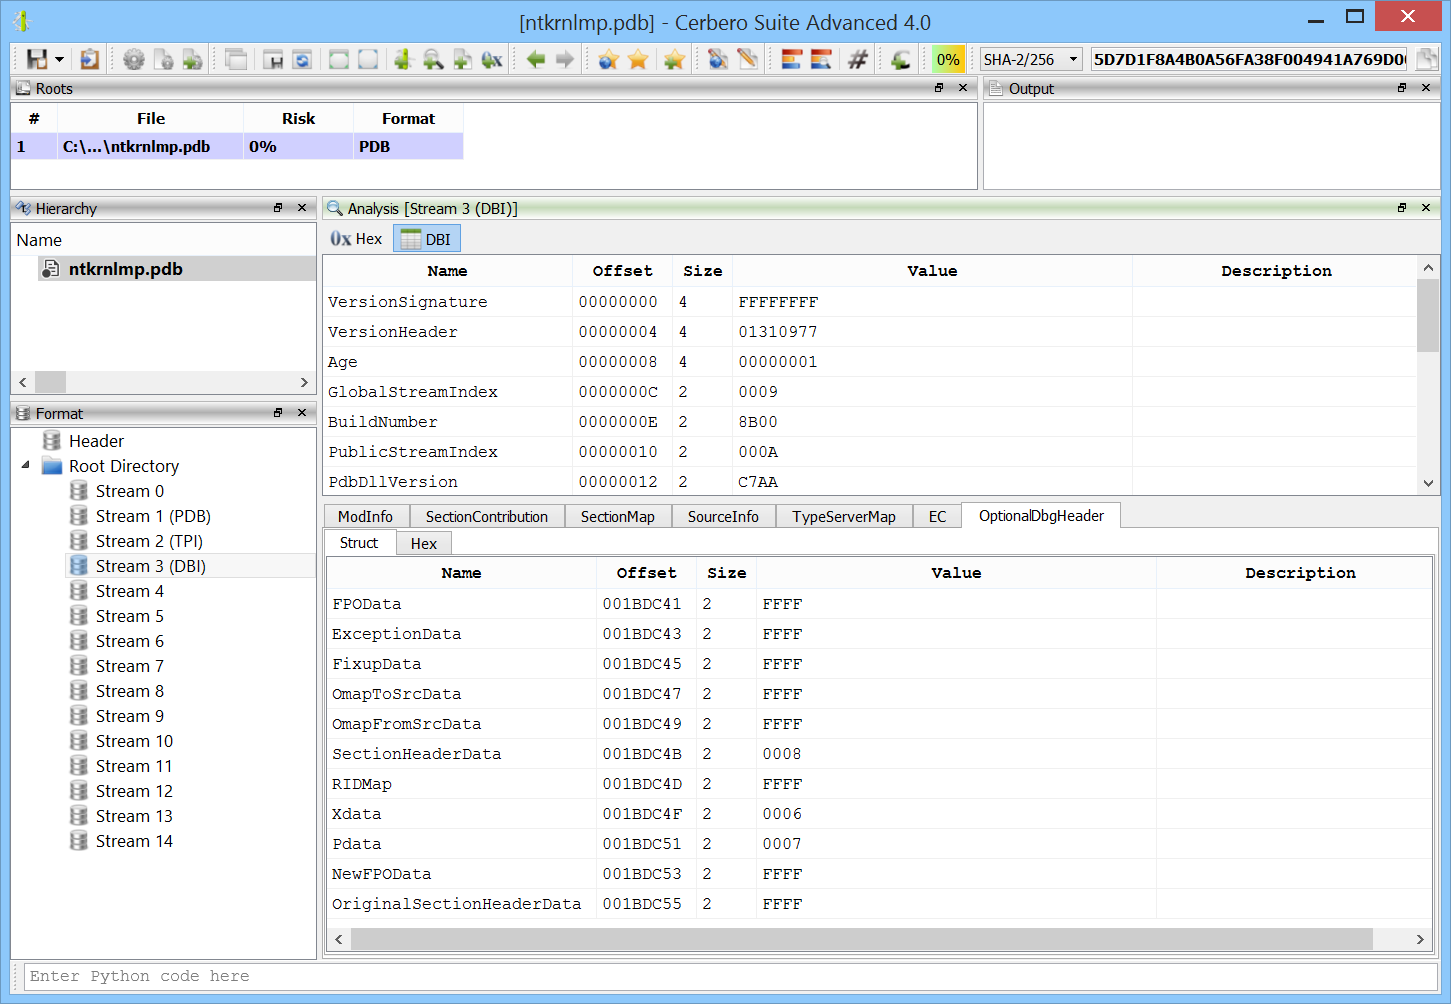
Improved PDB support
More PDB strucutres are now explorable from the UI.
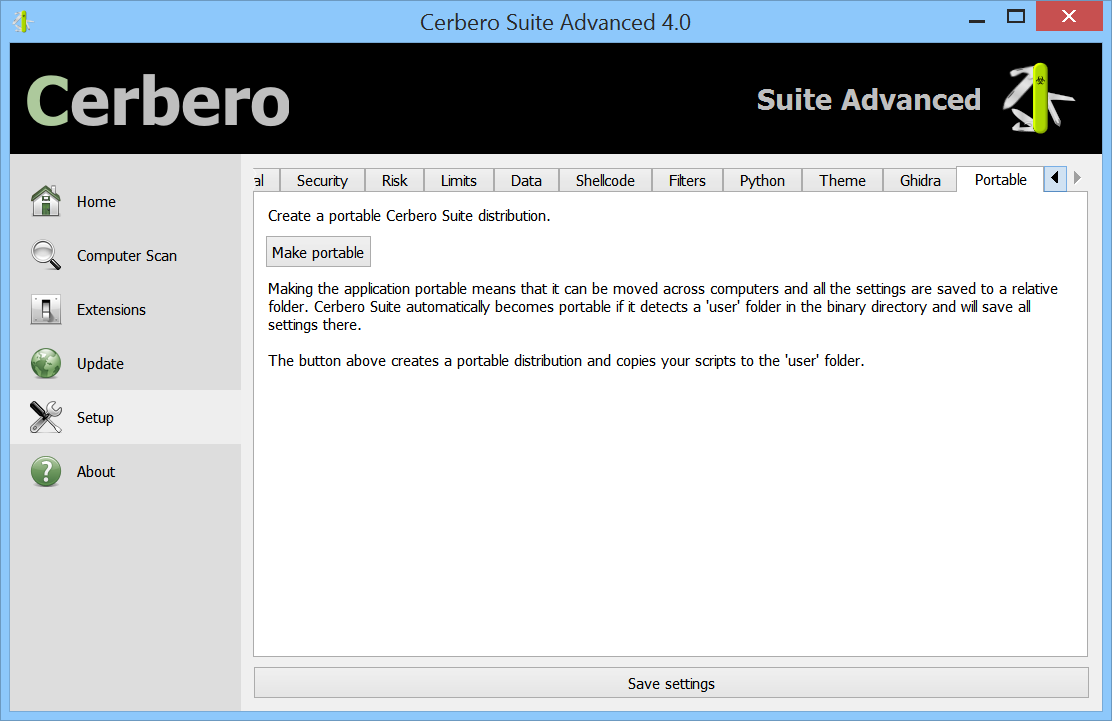
Improved settings
Apart from the Ghidra plugin installer, there’s a new tab in the settings to create a portable distribution of Cerbero Suite 4.
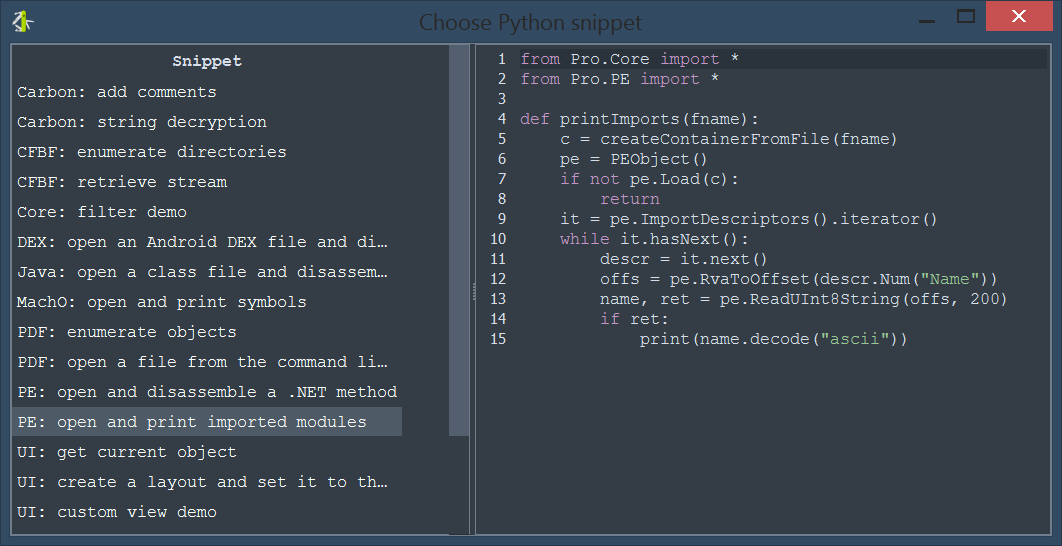
Improved SDK
We have increased the amout of exposed SDK and added new APIs. Among the many things we have exposed is the Sleigh decompiler. Here’s a small code sample:
from Pro.UI import *
from Pro.Carbon import *

v = proContext().getCurrentView()
c = v.getCarbon()
d = CarbonSleighDecompiler(c)
s = d.decompileToString(0x004028C9)
print(s)
A Carbon instance can be created entirely from Python of course.
Improved single view mode
Single view mode is perhaps a barely known feature in Cerbero, but a rather useful one. If you press “Ctrl+Alt+S” while in a view, it will hide all other views. Pressing the shortcut again restores the previous state.
In Cerbero Suite 4 we have introduced the concept of dependent views and have updated single view mode to include them.
We can see an example of this by looking at a crash dump. When we are in the disassembly we would like to keep dependent views (like the call stack or the decompiler) visible when switching to single view mode.
Normal state:
Single view mode:

Apart from the news listed here, we have added many refinements and fixed many bugs.
We hope you enjoy this new release!
Happy hacking!