Cerbero Suite 3.1 is out!

Version 3.1 is out with many improvements! The main news is the support in Carbon for ELF files and the improved deployment of the Linux edition.

This is the full list of news:

+ added ELF Carbon loader
+ added edit bytes command to Carbon
+ added write method to Carbon
+ added detection of 16-bits wide strings in Carbon
+ added open in hex editor action in Carbon
+ added filters to Carbon
+ added Carbon Monokai theme
added single view mode (Ctrl+Alt+S)
improved deployment on Linux
+ improved x86/x64 disassembly
improved hex workspace
– updated capstone to 4.0.1
– fixed misidentified object crash
– fixed some bugs

Carbon: ELF loader

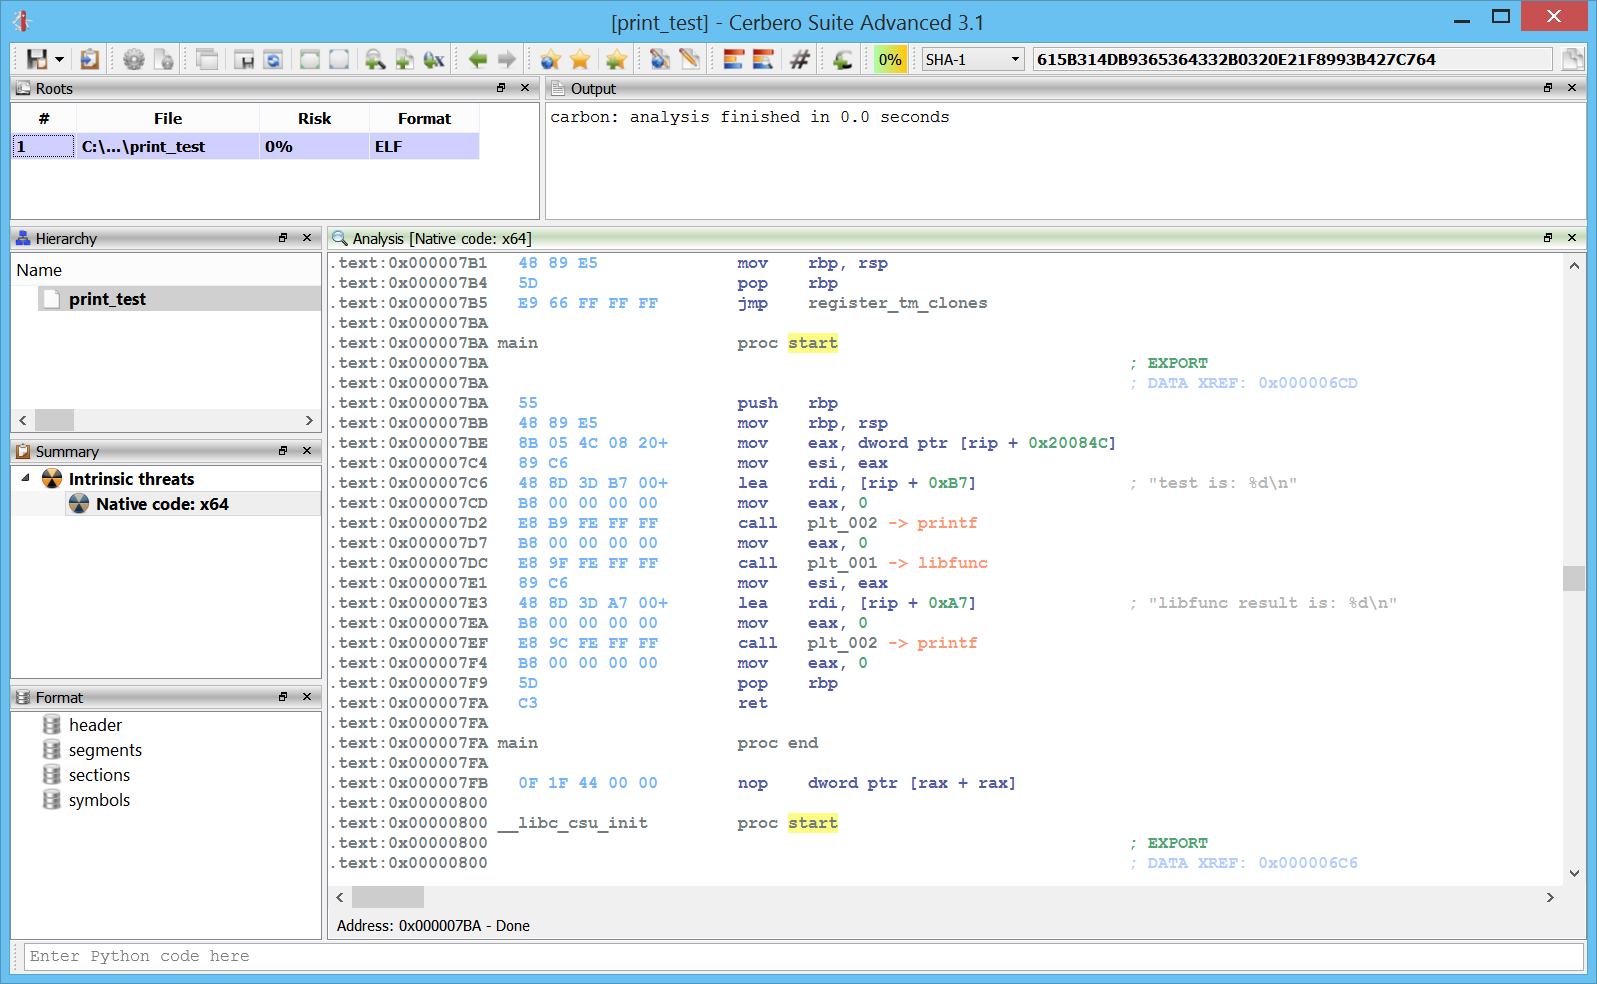
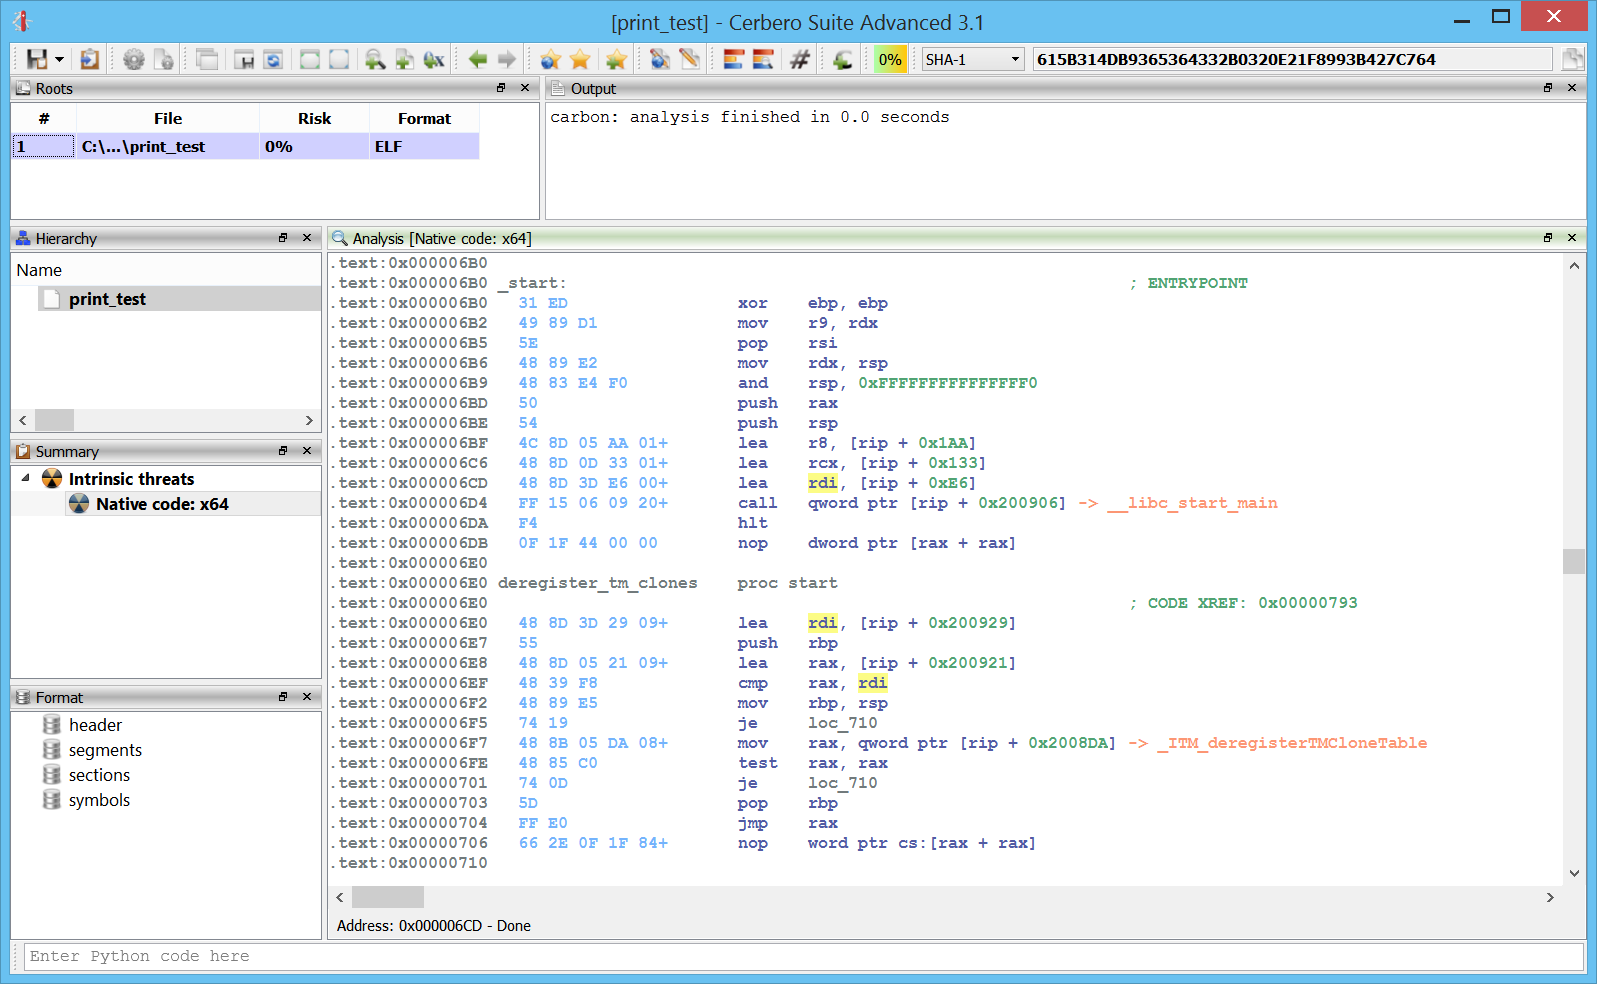
Here we can see an ELF x64 file in Carbon. As we can see we have an entry point with a call to __libc_start_main.

We can follow the first argument which will bring us to the main function.

.text:0x000007BA main                    proc start
.text:0x000007BA                                                                ; EXPORT
.text:0x000007BA                                                                ; DATA XREF: 0x000006CD
.text:0x000007BA   55                    push   rbp
.text:0x000007BB   48 89 E5              mov    rbp, rsp
.text:0x000007BE   8B 05 4C 08 20+       mov    eax, dword ptr [rip + 0x20084C]
.text:0x000007C4   89 C6                 mov    esi, eax
.text:0x000007C6   48 8D 3D B7 00+       lea    rdi, [rip + 0xB7]               ; "test is: %d\n"
.text:0x000007CD   B8 00 00 00 00        mov    eax, 0
.text:0x000007D2   E8 B9 FE FF FF        call   plt_002 -> printf
.text:0x000007D7   B8 00 00 00 00        mov    eax, 0
.text:0x000007DC   E8 9F FE FF FF        call   plt_001 -> libfunc
.text:0x000007E1   89 C6                 mov    esi, eax
.text:0x000007E3   48 8D 3D A7 00+       lea    rdi, [rip + 0xA7]               ; "libfunc result is: %d\n"
.text:0x000007EA   B8 00 00 00 00        mov    eax, 0
.text:0x000007EF   E8 9C FE FF FF        call   plt_002 -> printf
.text:0x000007F4   B8 00 00 00 00        mov    eax, 0
.text:0x000007F9   5D                    pop    rbp
.text:0x000007FA   C3                    ret
.text:0x000007FA
.text:0x000007FA main                    proc end

Carbon: detection of 16-bits wide strings

Simple 16-bit wide strings are now automatically detected in Carbon.

Carbon: open in hex editor action

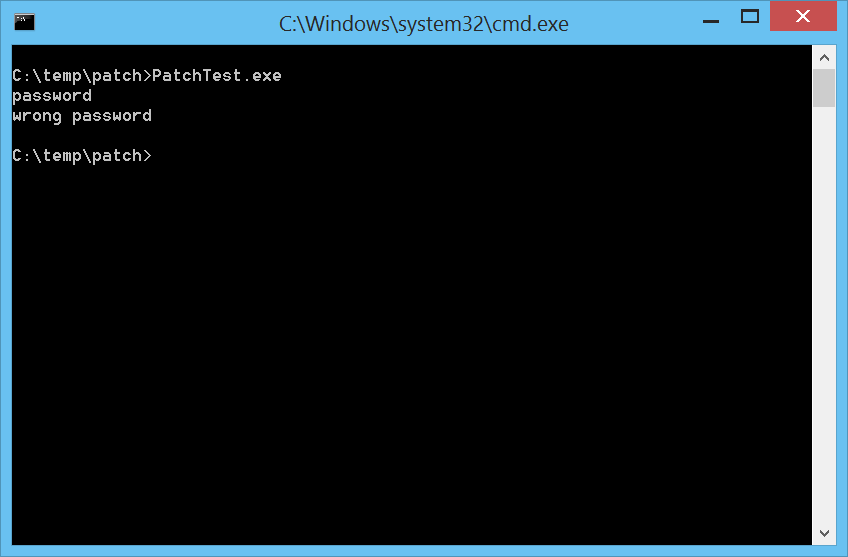
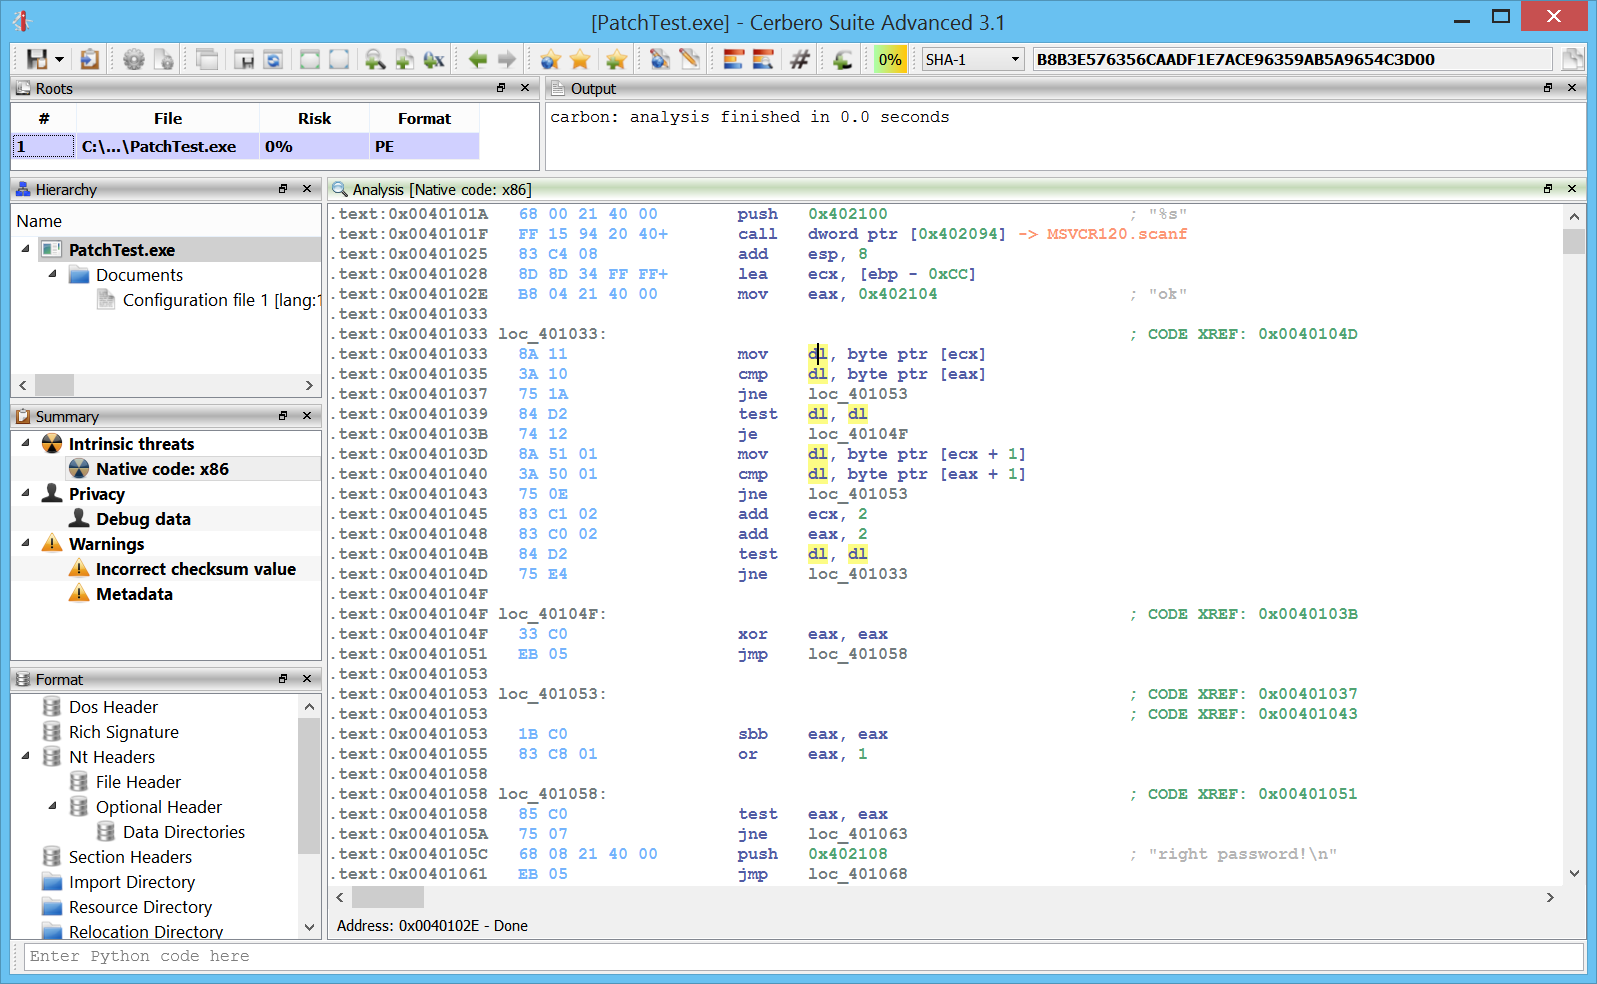
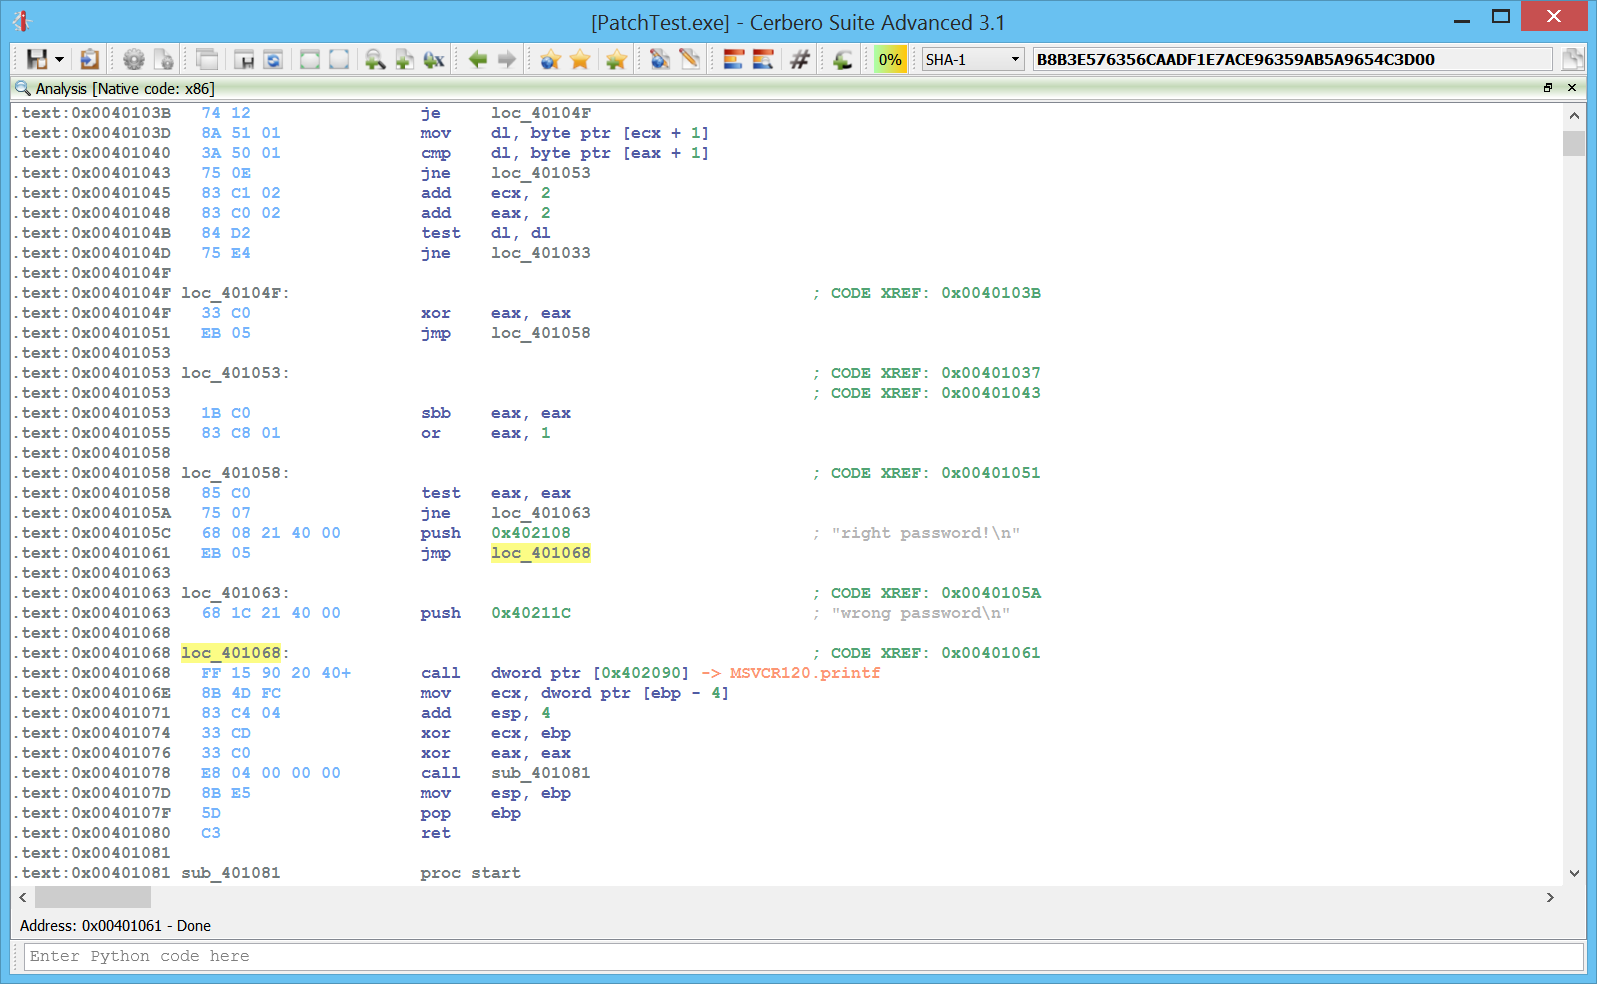
It is now possible to open the hex editor from the disassembly. To demonstrate this feature I crafted a small executable which asks for a password and prints an error message if the password is wrong.

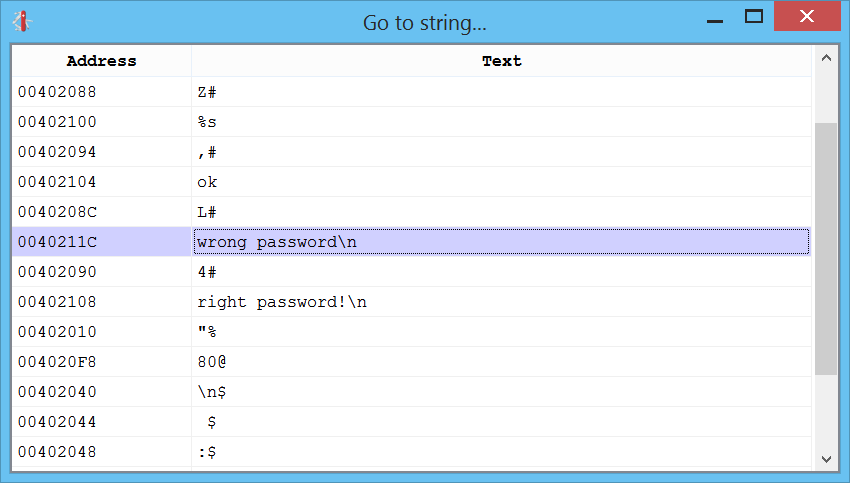
We can easily find the “wrong password” string in Carbon by pressing Ctrl+5.

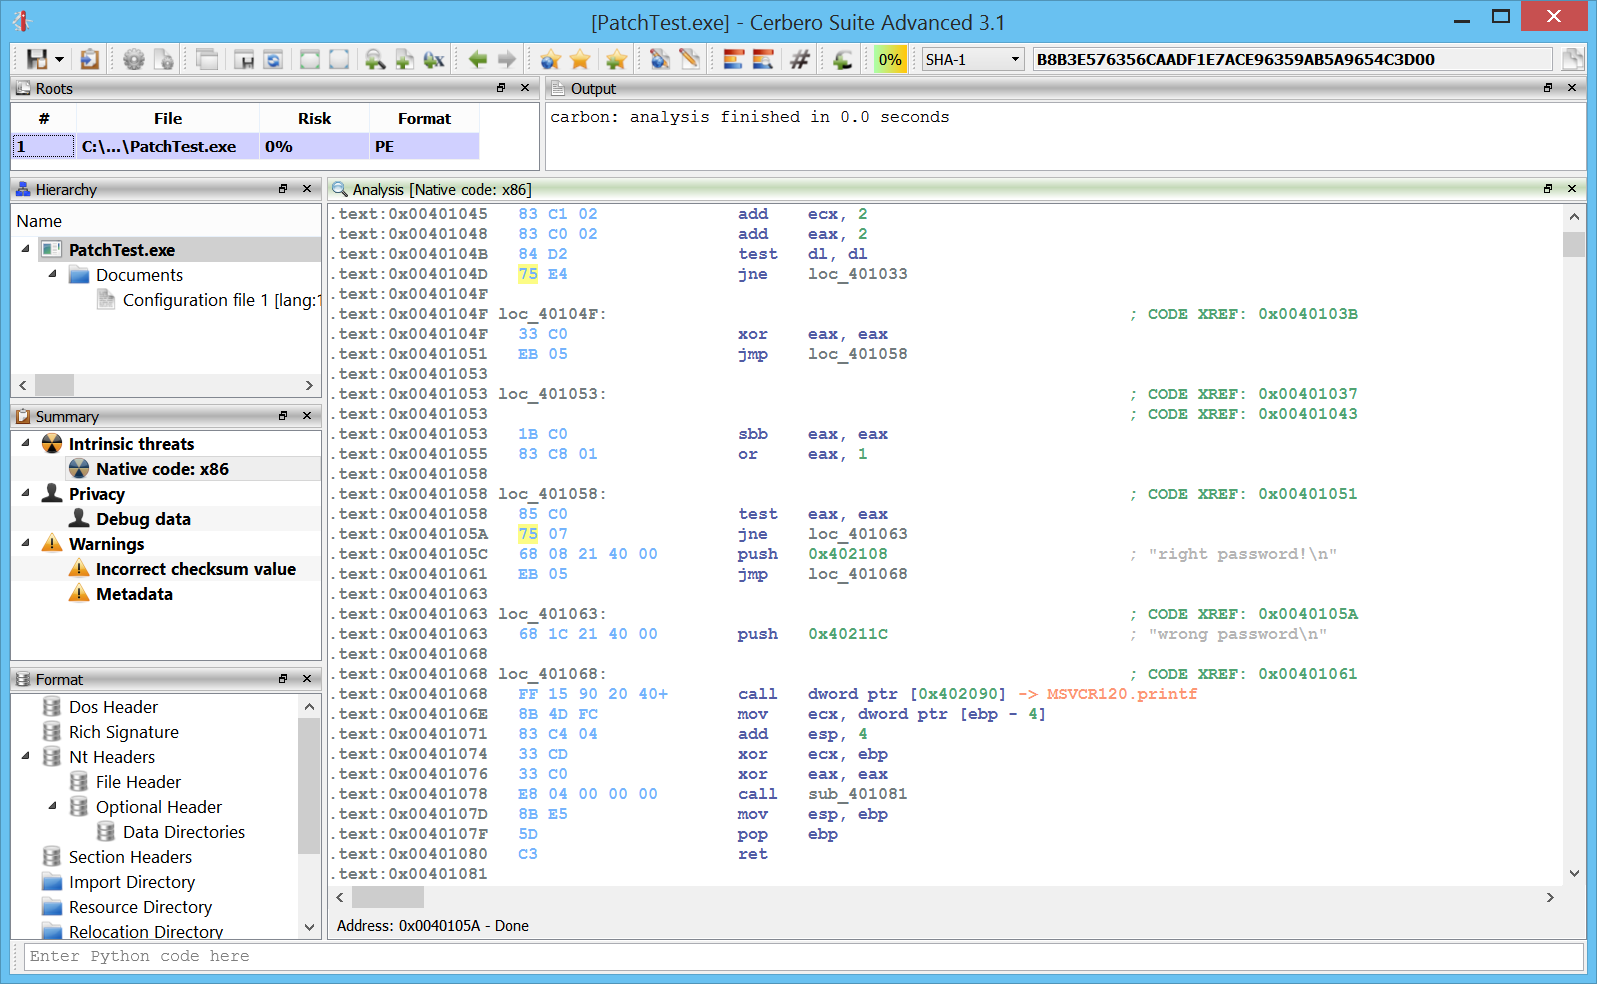
Right before the referenced string, there’s a scanf followed by a strcmp.

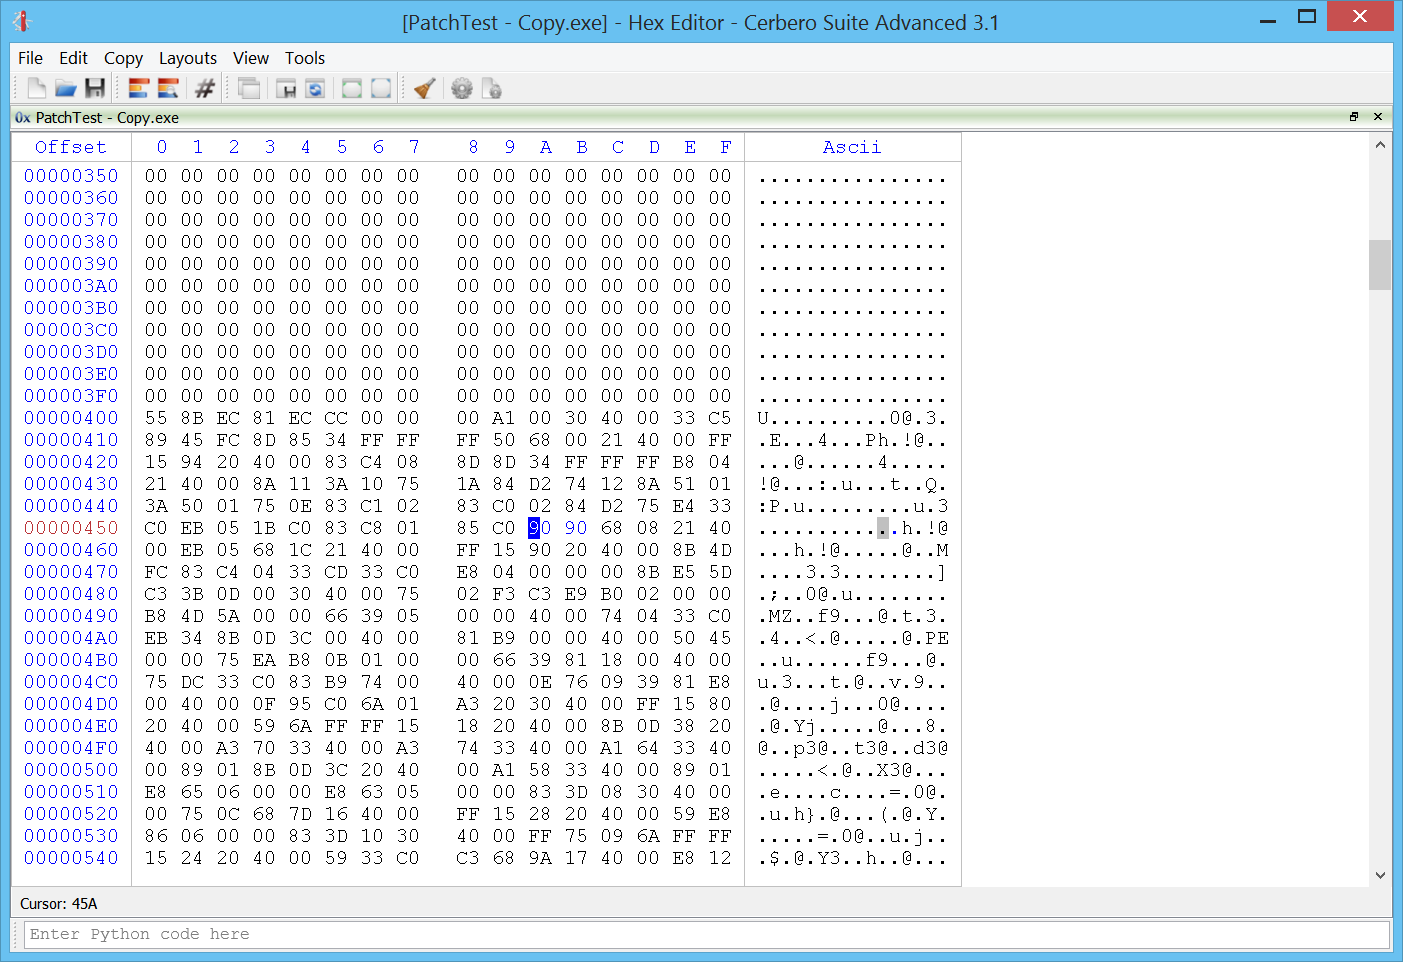
We go to the jne which evaluates the result of the strcmp and we open the hex editor from the contextual menu. It will ask us to open a file (it must be a copy of the file we’re analysing).

We can just nop the two bytes representing the jne and then we save the file.

Whatever password we insert now, it will be accepted.

Carbon: filters

While filters are already accessible from hex views, it is now possible to access them from Carbon as well.

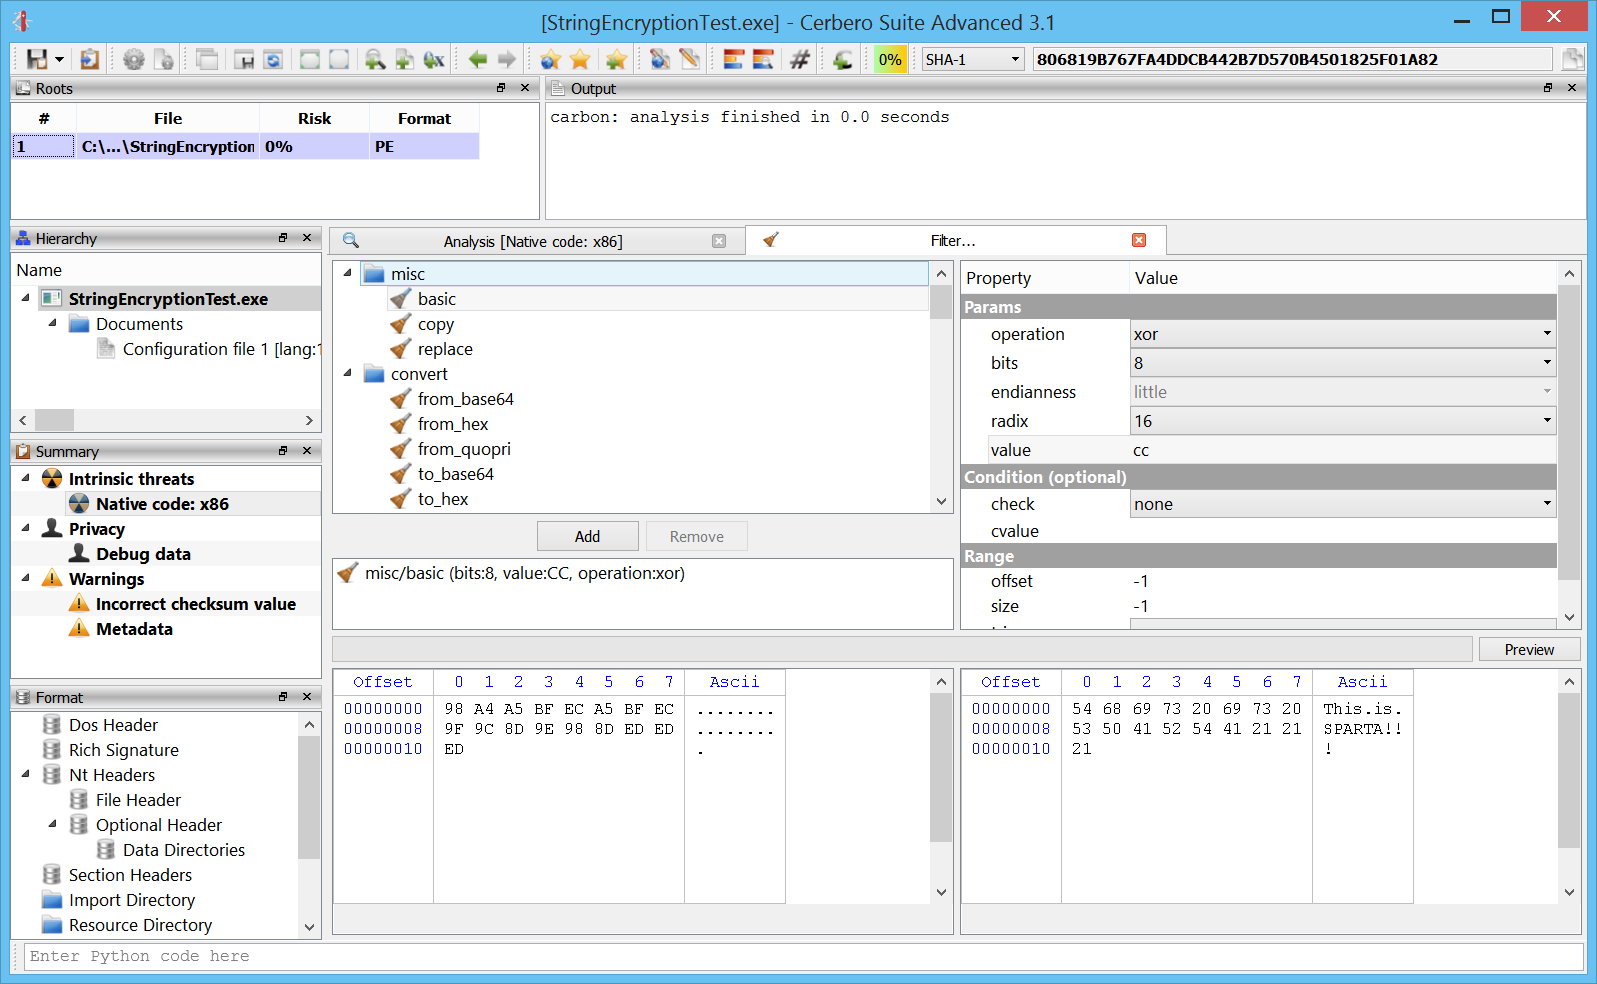
Let’s take the same sample analyzed in the previous blog post with xored strings. We select on of those xored strings and we open the filters from the contextual menu or by pressing Ctrl+T.

We can now test out a filter on the selected bytes. In this case we simply use a xor to see the string in plain.

Carbon: Monokai theme

The Monokai theme has been added to Carbon.

I have been using this theme for some development projects and wondered what it would look like in a disassembly. I don’t know about you, but I like it… 🙂

Single-view mode

While it has always been possible to trigger the full-screen mode via Ctrl+Alt+F, now there’s also single-view mode which can be triggered via Ctrl+Alt+S.

What it does is to hide all other views, leaving only the focused view open. Press the same shortcut to exit the mode and have all other views visible again.

Improved Linux deployment

The Linux edition has been drastically improved by simplifying its deployment. As a result it should now be compatible with many more versions of Linux, without having to adjust dependencies. It also comes with a built-in Python distribution, just like the Windows edition.

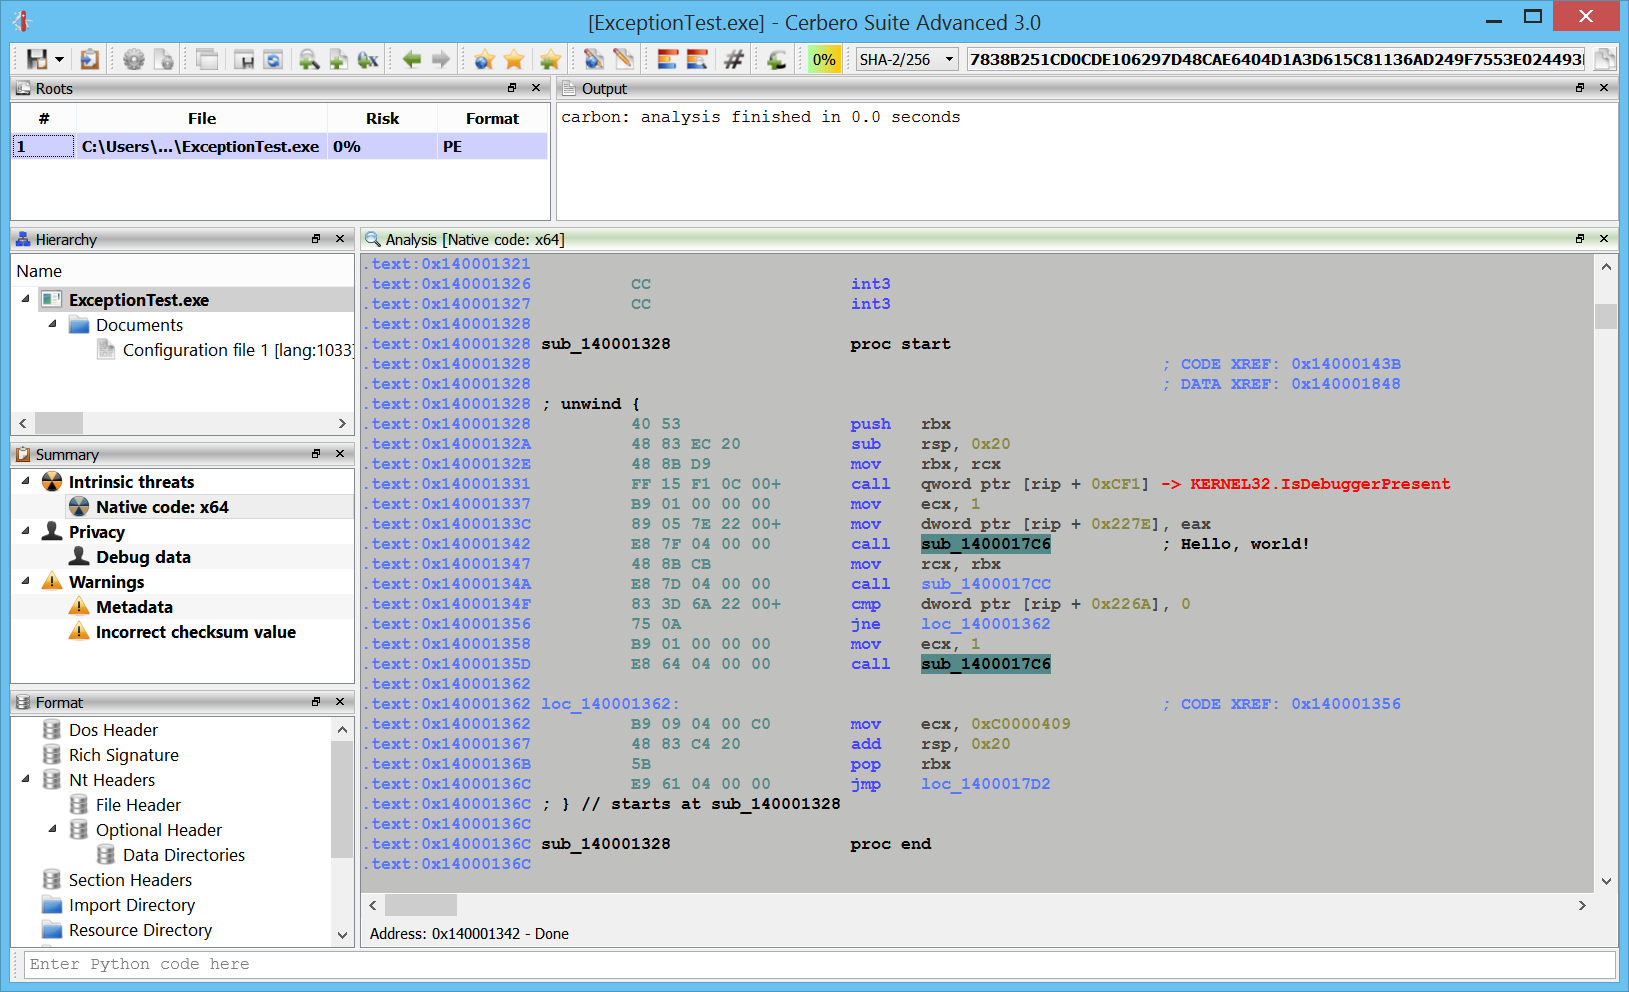
Carbon: improved x86/x64 disassembly

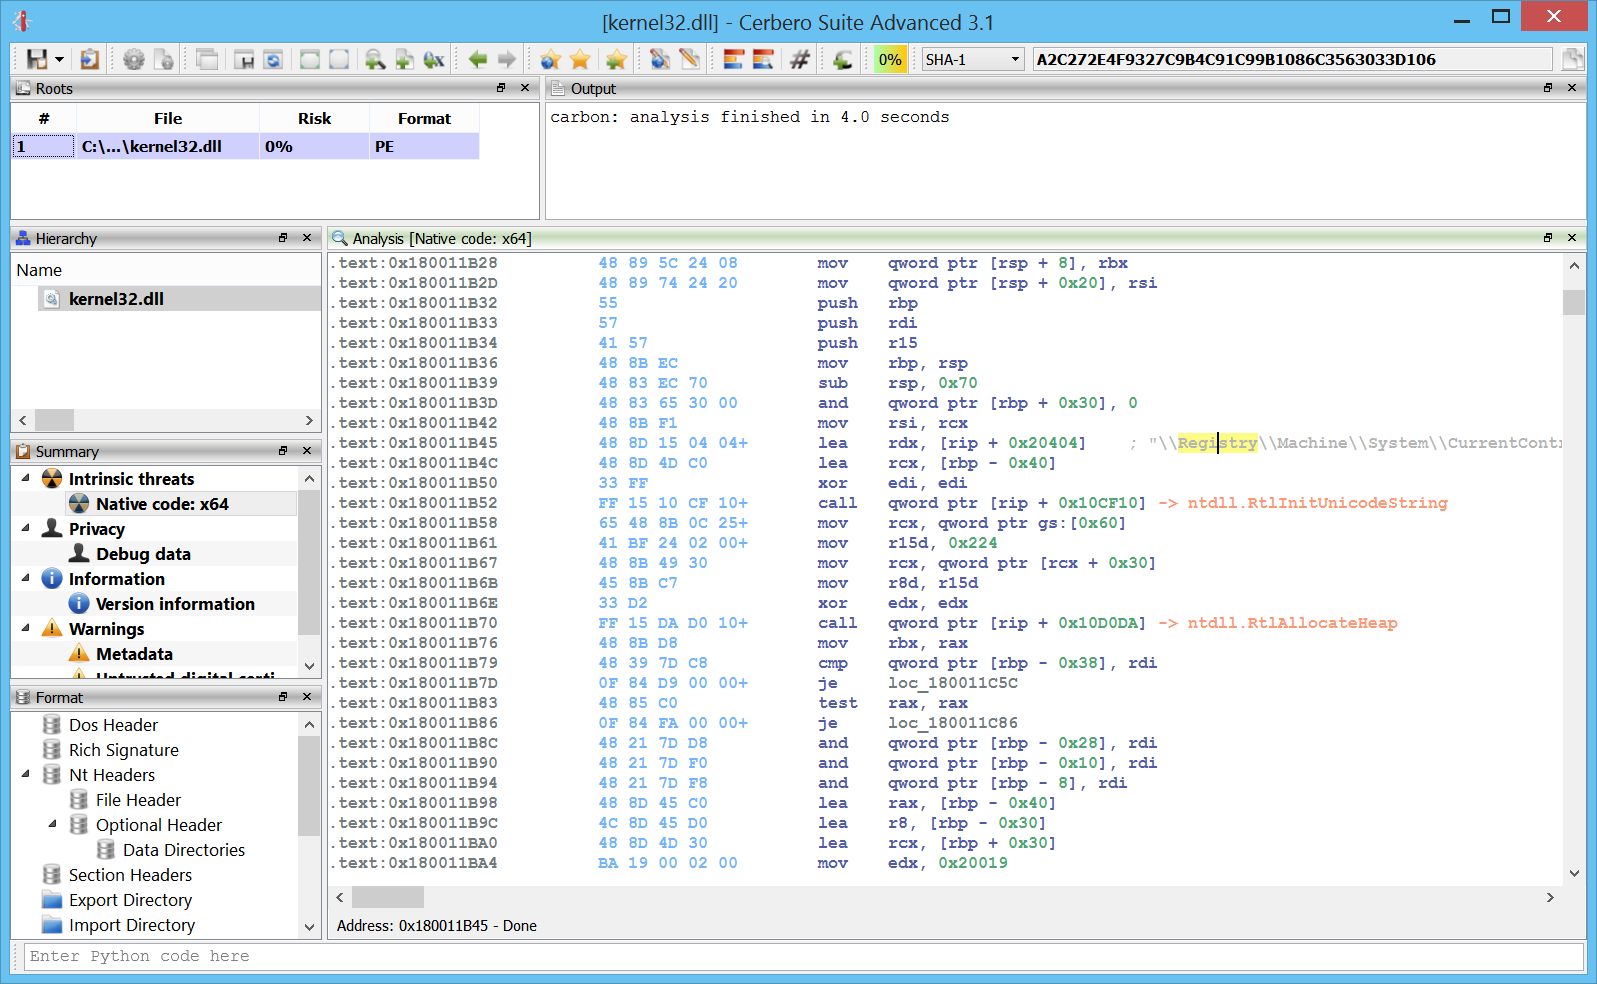
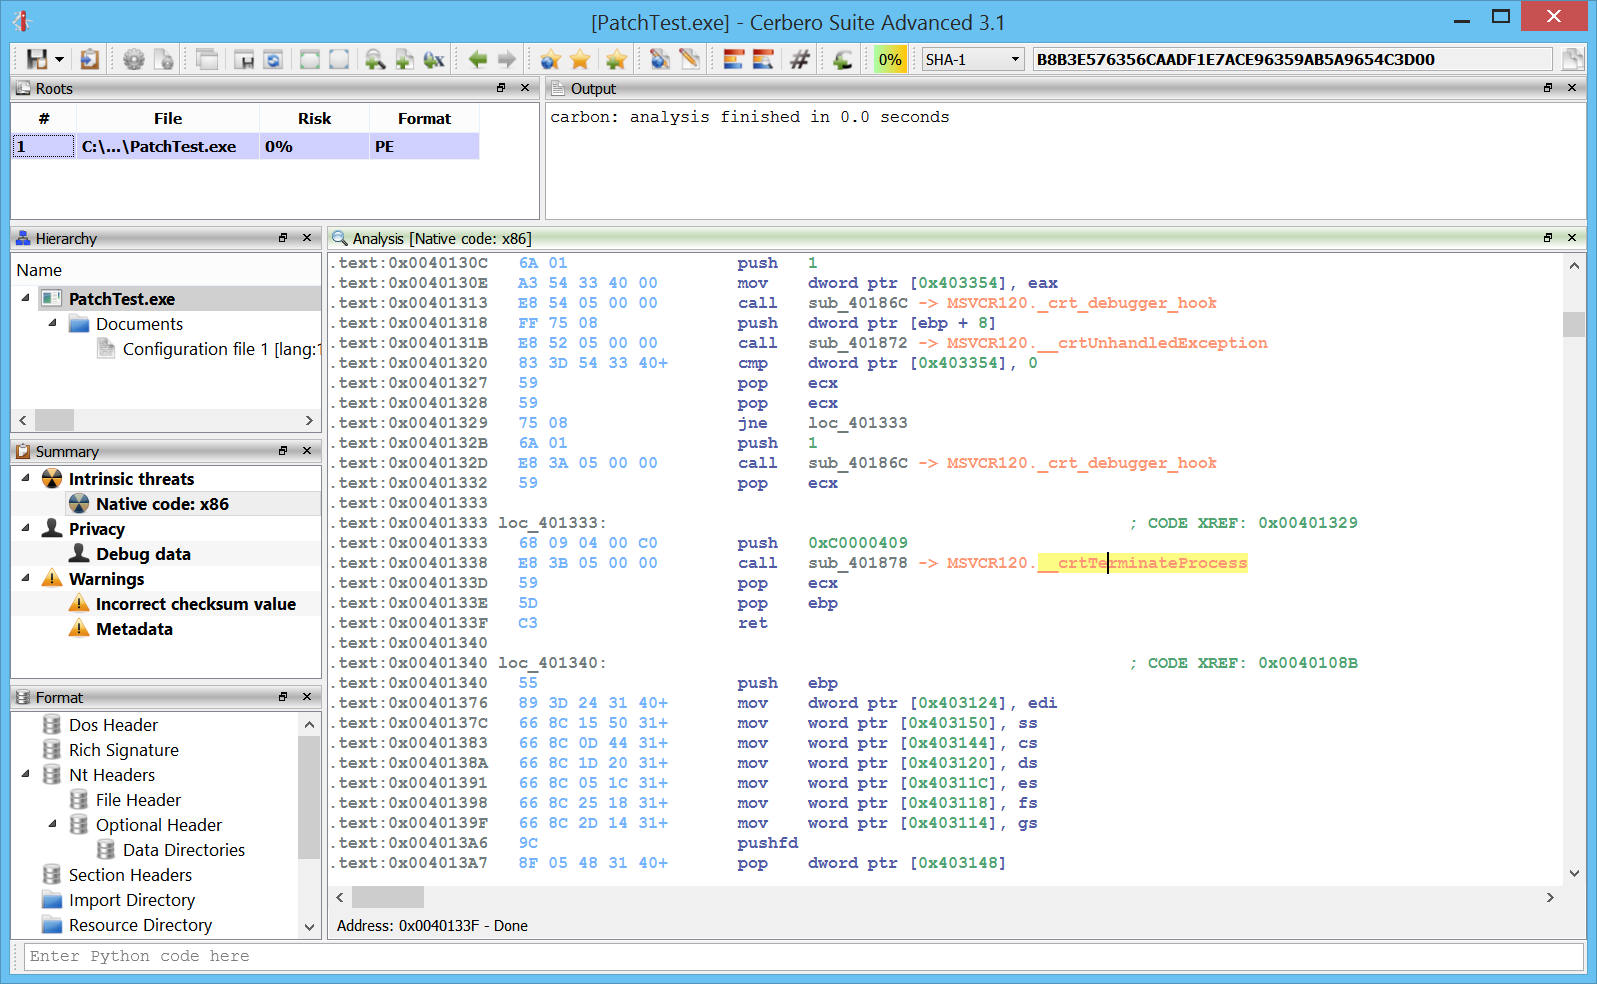
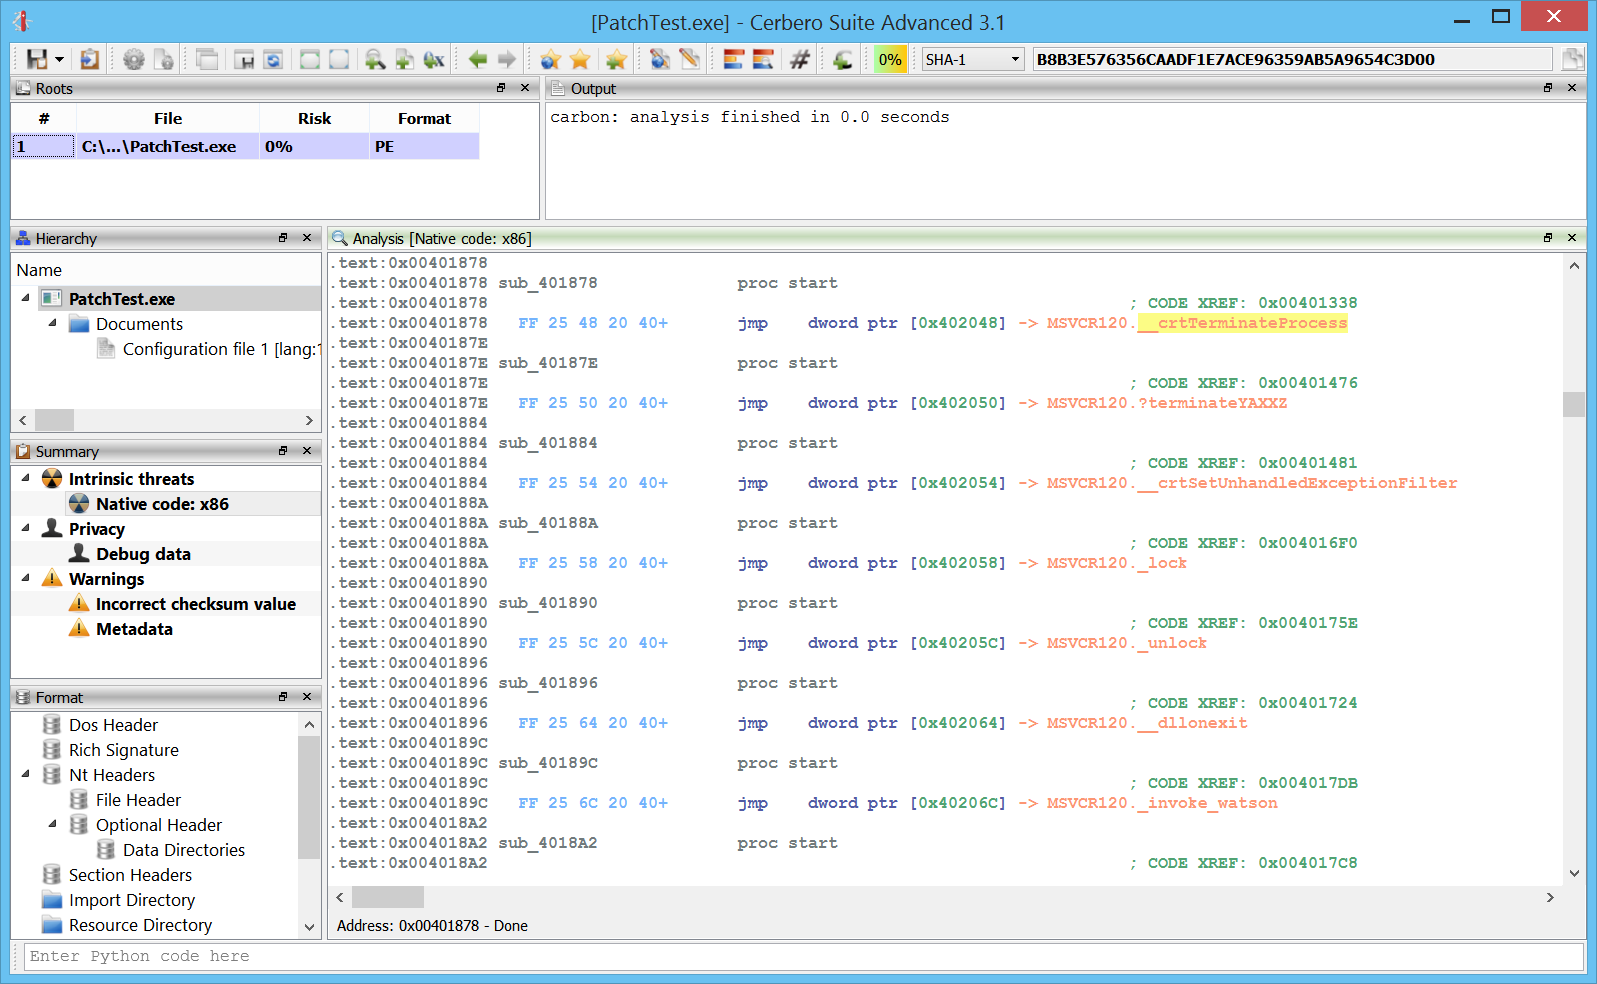
The disassembly in Carbon has been improved so that it now shows import forward calls. Let’s take this simple call to __crtTerminateProcess.

If we follow the call, we’ll see that it just calls a jumps which in turn jumps to the actual API.

These sort of calls to jumps or jumps to jumps are now automatically resolved to improve the readability of the code.

Improved hex workspace

The hex workspace comes with a number of small improvements, but mainly the initial layout doesn’t show the output view by default.

We hope you enjoy this version as we’re already working on the next one and I can’t wait to show you some of the cool things we’re working on. 🙂

Happy hacking!
String decryption with Carbon

Developing Carbon, I haven’t had the time to play much with it myself. 🙂 One of the most essential features in a disassembler is the capability to let the users write scripts and modify the disassembly itself. Carbon has a rich SDK and this is a little tutorial to introduce a bit how it works.

Before trying out any of the scripts in this tutorial, make sure to update to the newest 3.0.2 version, as we just fixed a few bugs related to the Carbon Python SDK.

So let’s start!

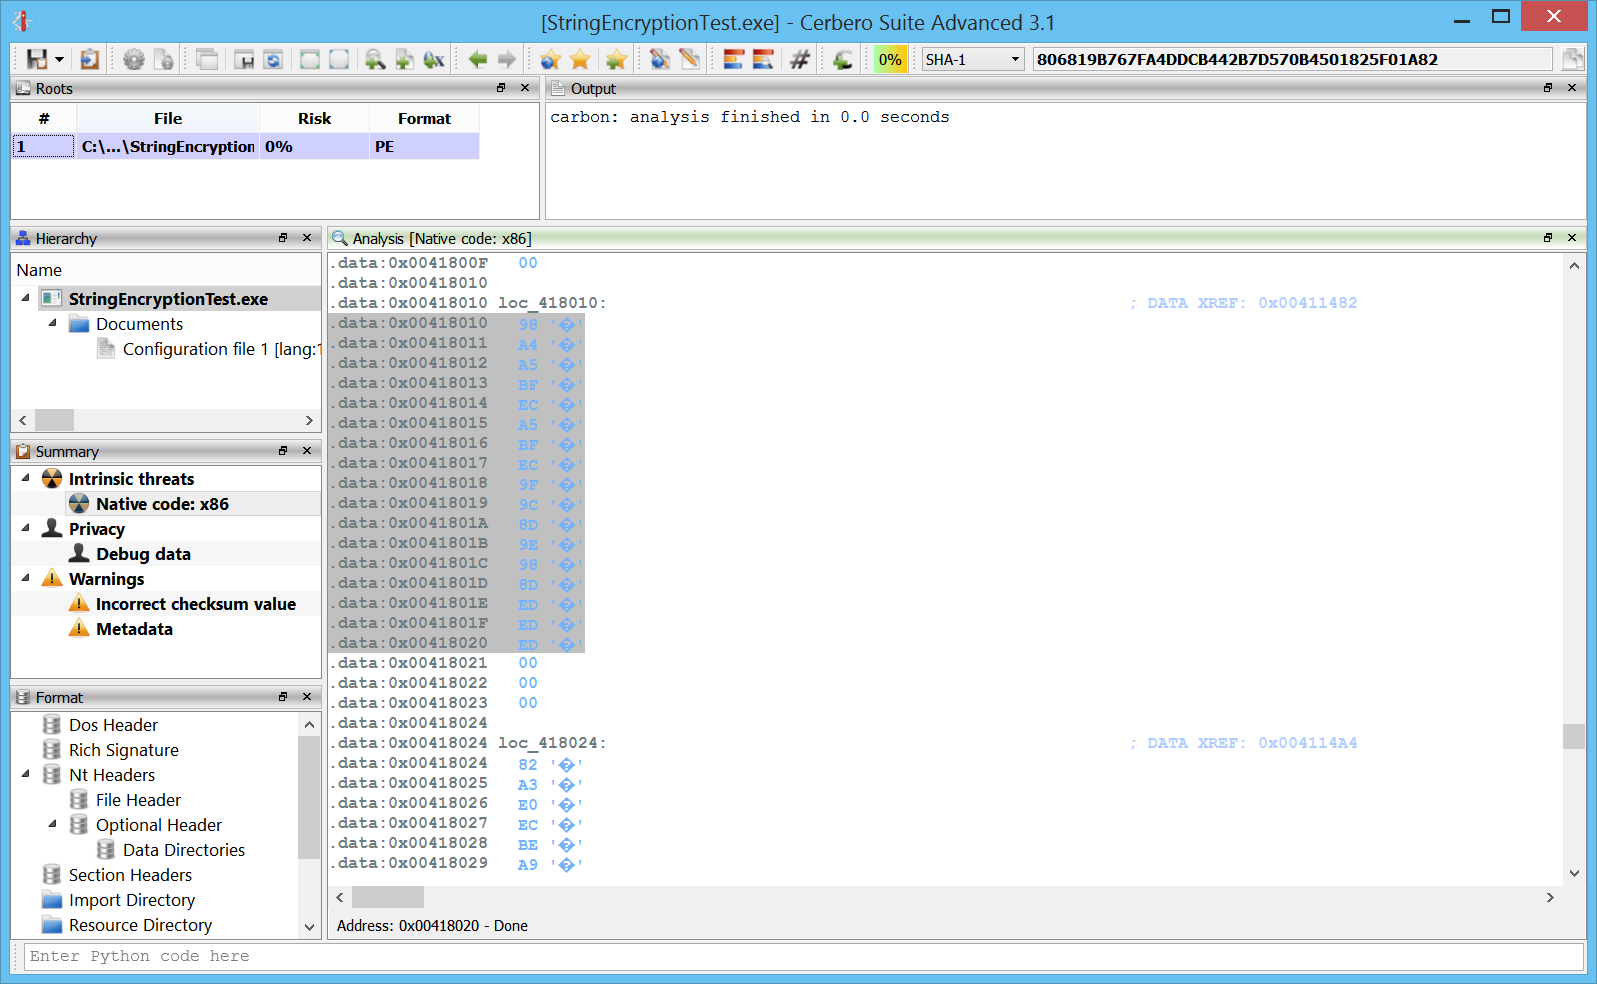
I wrote a small program with some encrypted strings.

#include <stdio.h>

unsigned char s1[13] = { 0x84, 0xA9, 0xA0, 0xA0, 0xA3, 0xE0, 0xEC, 0xBB, 0xA3, 0xBE, 0xA0, 0xA8, 0xED };
unsigned char s2[17] = { 0x98, 0xA4, 0xA5, 0xBF, 0xEC, 0xA5, 0xBF, 0xEC, 0x9F, 0x9C, 0x8D, 0x9E, 0x98, 0x8D, 0xED, 0xED, 0xED };
unsigned char s3[11] = { 0x82, 0xA3, 0xE0, 0xEC, 0xBE, 0xA9, 0xAD, 0xA0, 0xA0, 0xB5, 0xE2 };

char *decrypt(unsigned char *s, size_t n)
{
	for (size_t i = 0; i < n; i++)
		s[i] ^= 0xCC;
	return (char *) s;
}

#define DS(s) decrypt(s, sizeof (s))

int main()
{
	puts(DS(s1));
	puts(DS(s2));
	puts(DS(s3));
	return 0;
}

The decryption function is super-simple, but that’s not important for our purposes.

I disassembled the debug version of the program, because I didn’t want release optimizations like the decrypt function getting inlined. Not that it matters much, but in a real-world scenario a longer decryption function wouldn’t get inlined.

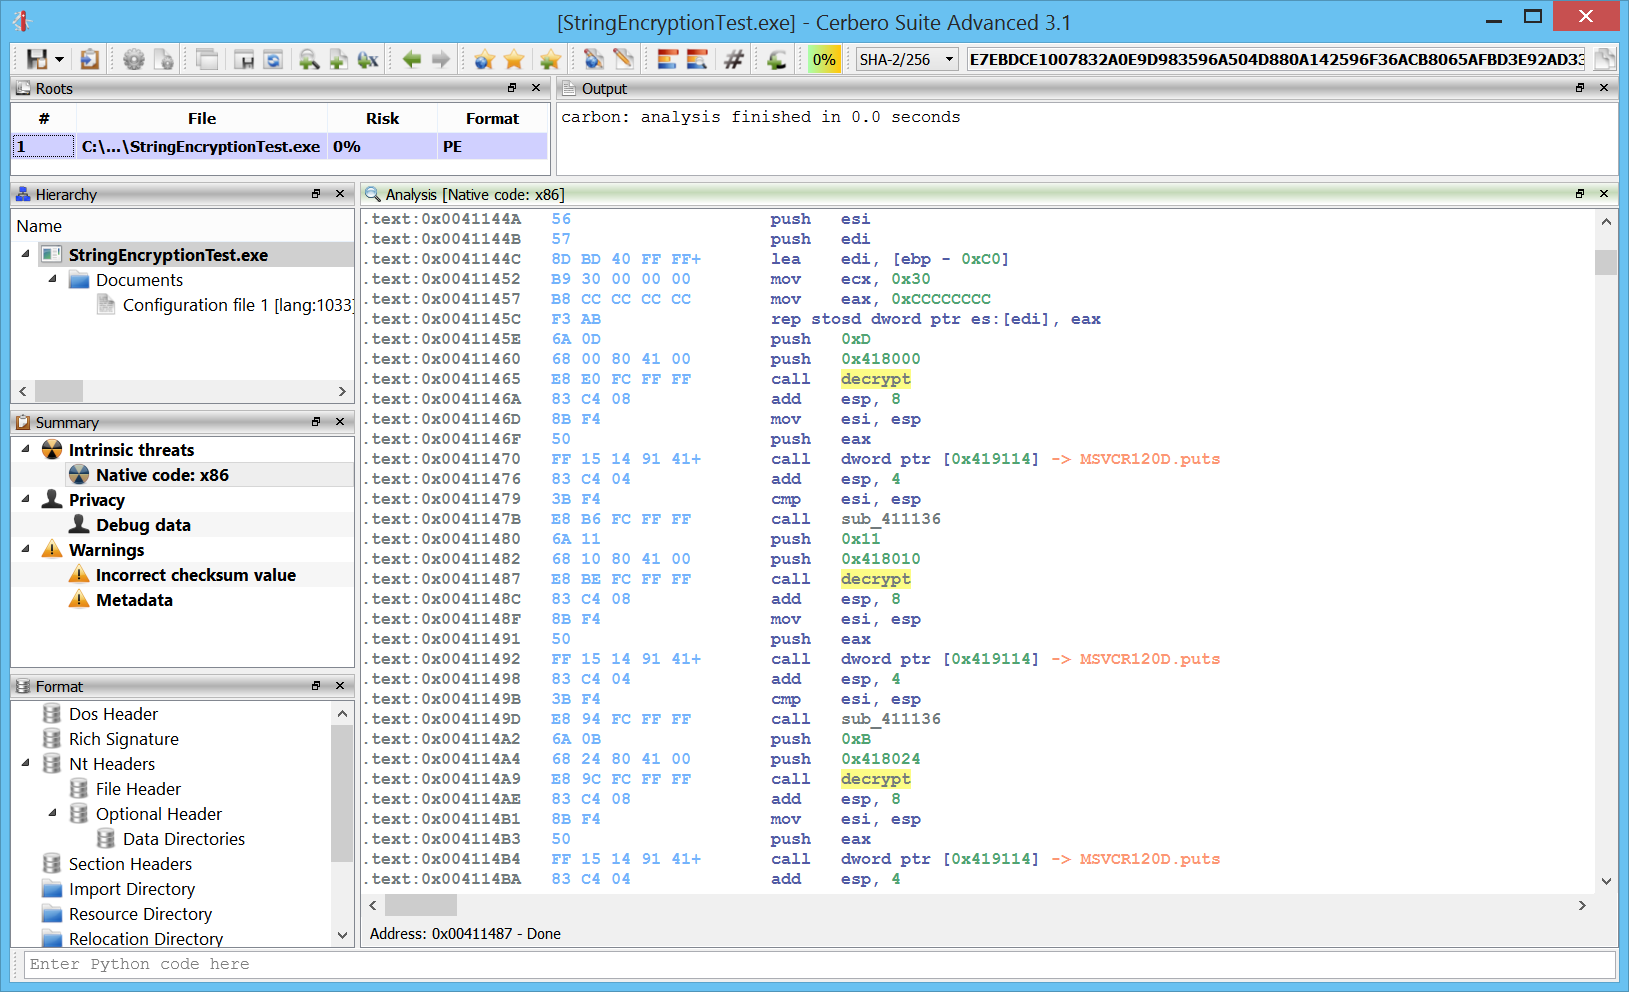
By going to the decrypt function, we end up to a jmp which points to the actual function code.

.text:0x0041114A decrypt                 proc start
.text:0x0041114A                                     ; CODE XREF: 0x00411465
.text:0x0041114A                                     ; CODE XREF: 0x00411487
.text:0x0041114A                                     ; CODE XREF: 0x004114A9
.text:0x0041114A   E9 71 02 00 00        jmp    sub_4113C0

At this point, the SDK offers us many possible approaches to find all occurrences of encrypted strings. We could, for instance, enumerate all disassembled instructions. But that’s not very fast. A better approach is to get all xrefs to the decrypt function and then proceed from there.

First we get the current view.

v = proContext().getCurrentView()
ca = v.getCarbon()
db = ca.getDB()

Then we get all xrefs to the decrypt function.

xrefs = db.getXRefs(0x0041114A, True)

We enumerate all xrefs and we extract address and length of each string.

it = xrefs.iterator()
    while it.hasNext():
        xref = it.next()
        # retrieve address and length of the string
        buf = ca.read(xref.origin - 6, 6)
        slen = buf[0]
        saddr = struct.unpack_from("<I", buf, 2)[0]

We decrypt the string.

s = ca.read(saddr, slen) 
s = bytes([c ^ 0xCC for c in s]).decode("utf-8")

At this point we can add a comment to each push of the string address with the decrypted string.

comment = caComment()
comment.address = xref.origin - 5
comment.text = s
db.setComment(comment)

As final touch, we tell the view to update, in order to show us the changes we made to the underlying database.

v.update()

Here’s the complete script which we can execute via Ctrl+Alt+R (we have to make sure that we are executing the script while the focus is on the disassembly view, otherwise it won’t work).

from Pro.UI import proContext
from Pro.Carbon import caComment
import struct

def decrypt_strings():
    v = proContext().getCurrentView()
    ca = v.getCarbon()
    db = ca.getDB()
    # get all xrefs to the decryption function
    xrefs = db.getXRefs(0x0041114A, True)
    it = xrefs.iterator()
    while it.hasNext():
        xref = it.next()
        # retrieve address and length of the string
        buf = ca.read(xref.origin - 6, 6)
        slen = buf[0]
        saddr = struct.unpack_from("<I", buf, 2)[0]
        # decrypt string
        s = ca.read(saddr, slen) 
        s = bytes([c ^ 0xCC for c in s]).decode("utf-8")
        # comment
        comment = caComment()
        comment.address = xref.origin - 5
        comment.text = s
        db.setComment(comment)
    # update the view
    v.update()
    
decrypt_strings()

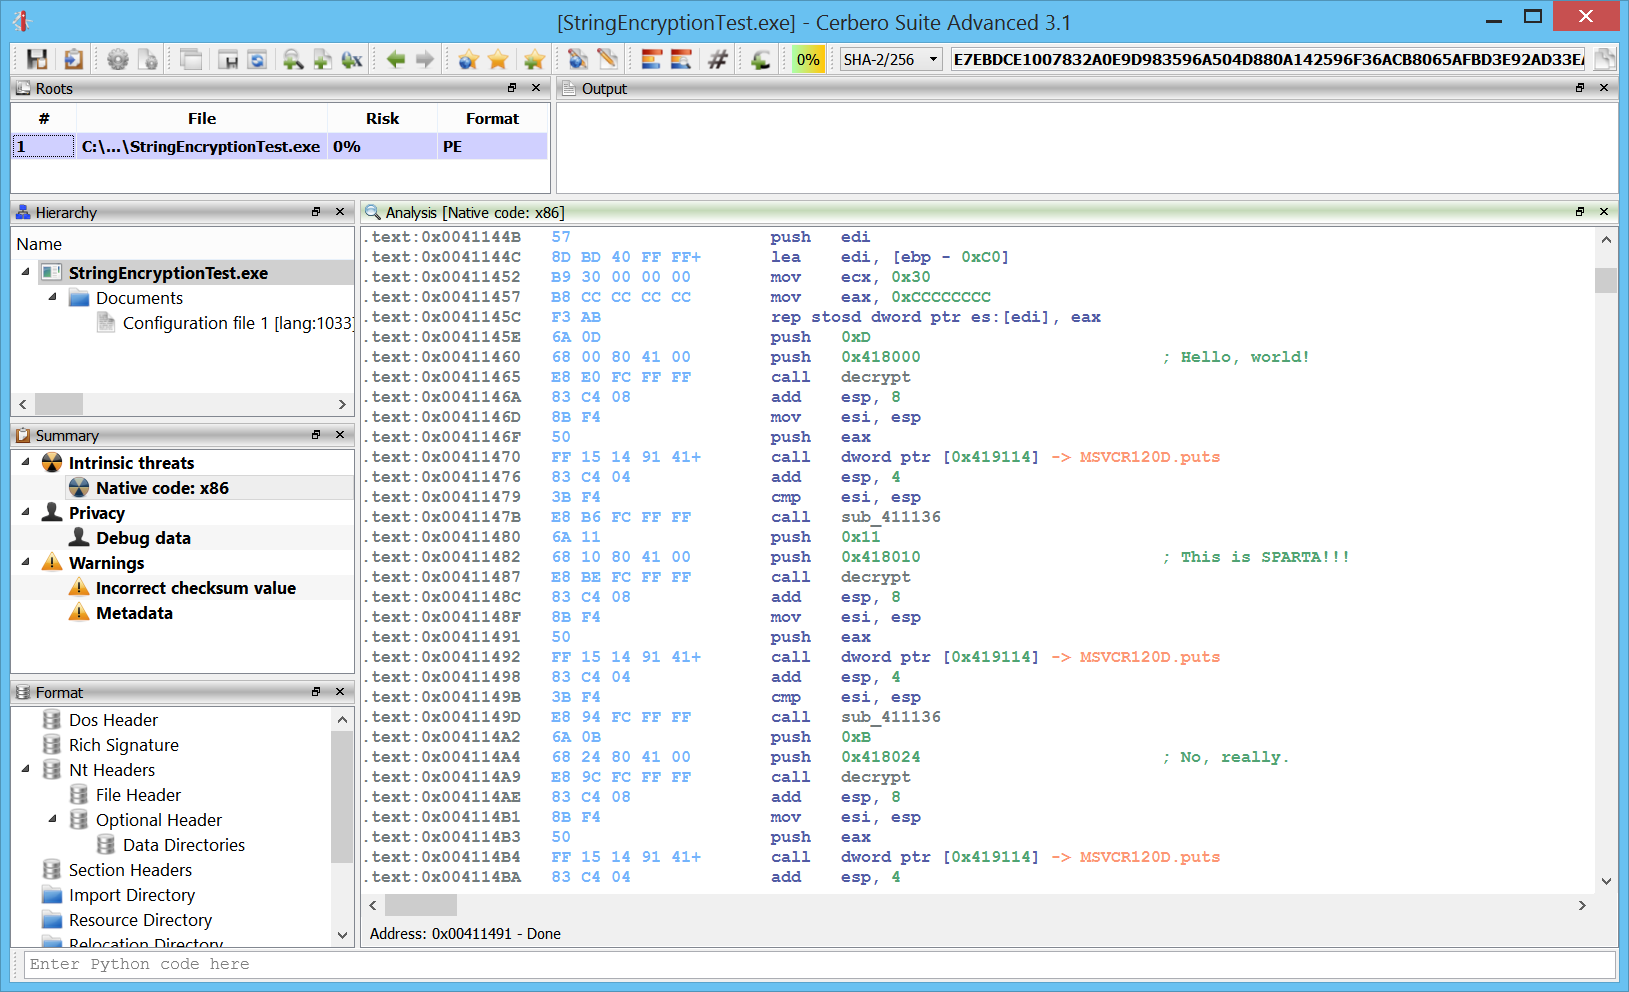
It will result in the decrypted strings shown as comments.

This could be the end of the tutorial. However, in the upcoming 3.1 version I just added the capability to overwrite bytes in the disassembly. This feature is both available from the context menu (Edit bytes) under the shortcut “E” or from the SDK via the Carbon write method.

What it does is to patch bytes in the database only: the original file won’t be touched!

So let’s modify the last part of the script above:

        # decrypt string
        s = ca.read(saddr, slen) 
        s = bytes([c ^ 0xCC for c in s])
        # overwrite in disasm
        ca.write(saddr, s)

Please notice that I removed the “.decode(“utf-8″)” part of the script, as now I’m passing a bytes object to the write method.

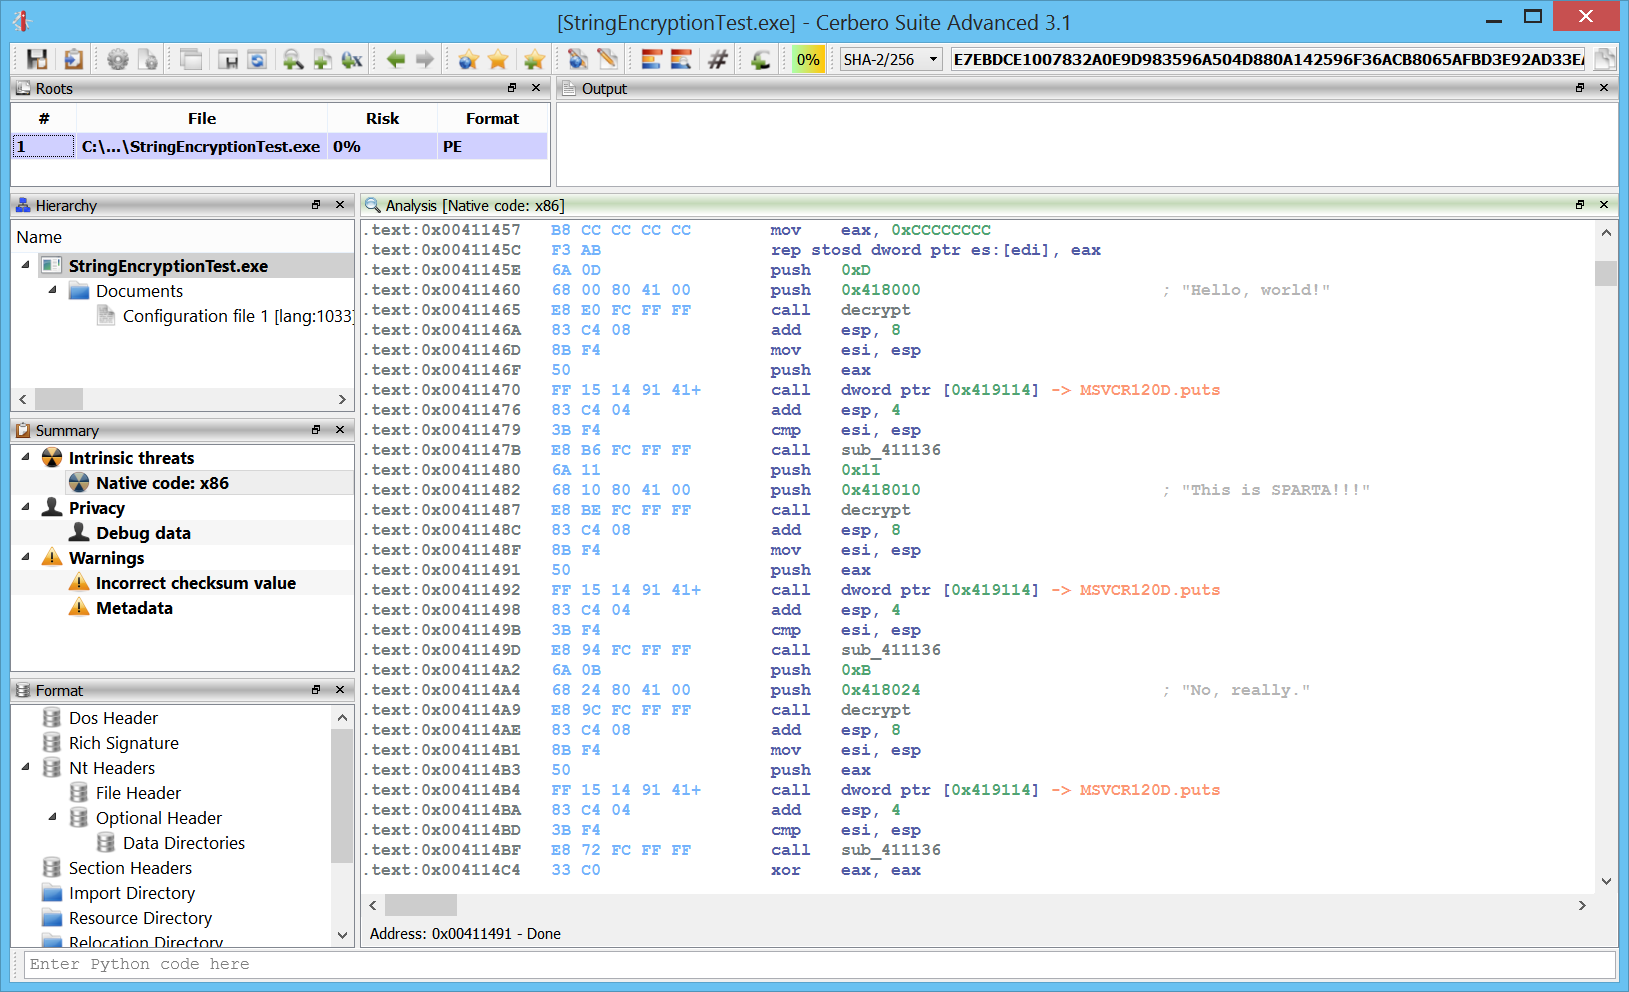
This is the result.

.text:0x0041145E   push   0xD
.text:0x00411460   push   0x418000                        ; "Hello, world!"
.text:0x00411465   call   decrypt
.text:0x0041146A   add    esp, 8
.text:0x0041146D   mov    esi, esp
.text:0x0041146F   push   eax
.text:0x00411470   call   dword ptr [0x419114] -> MSVCR120D.puts
.text:0x00411476   add    esp, 4
.text:0x00411479   cmp    esi, esp
.text:0x0041147B   call   sub_411136
.text:0x00411480   push   0x11
.text:0x00411482   push   0x418010                        ; "This is SPARTA!!!"
.text:0x00411487   call   decrypt
.text:0x0041148C   add    esp, 8
.text:0x0041148F   mov    esi, esp
.text:0x00411491   push   eax
.text:0x00411492   call   dword ptr [0x419114] -> MSVCR120D.puts
.text:0x00411498   add    esp, 4
.text:0x0041149B   cmp    esi, esp
.text:0x0041149D   call   sub_411136
.text:0x004114A2   push   0xB
.text:0x004114A4   push   0x418024                        ; "No, really."
.text:0x004114A9   call   decrypt
.text:0x004114AE   add    esp, 8
.text:0x004114B1   mov    esi, esp
.text:0x004114B3   push   eax
.text:0x004114B4   call   dword ptr [0x419114] -> MSVCR120D.puts

I didn’t add any comment: the strings are now detected automatically by the disassembler and shown as comments.

Perhaps for this particular task it’s better to use the first approach, instead of changing bytes in the database, but the capability to overwrite bytes becomes important when dealing with self-modifying code or other tasks.

I hope you enjoyed this first tutorial. 🙂

Happy hacking!
Cerbero Suite 3.0 is out!

We’re proud to announce the release of the new 3.0 version of Cerbero Suite!

The main news for the advanced version is the introduction of the Carbon Interactive Disassembler and of a full-fledged hex-editor, while the standard version features only the hex-editor.

We have removed the nag-screen from our trial, making ours the most permissive trial of all time. 🙂 Truth is, I have never been a fan of software protections, as they degrade the experience for every user, including customers and limit the immediacy of application of the software when needed.

We live in a time with virtual machines and it’s often necessary to install something on the fly and use it right away. That’s also why we included a local Python distribution in our installer on Windows, so that users are no longer required to separately install Python and configure it in our software, but can use all the functionality right away after a quick installation process.

While we changed the prices of our commercial licenses, we kept basically unchanged prices for personal licenses. Also, for a week starting today all personal licenses are sold at a discount, so hurry up! 😉

All of our customers can upgrade at a 50% discount their licenses for the next 3 months. Not only that, for the same period of time, customers of the 2.x series can purchase new licenses at a 50% discount! If you want to upgrade or purchase a new license at a discount, please contact us at sales@icerbero.com.

As usual our licenses will be valid for the whole duration of the 3.x series. Because of this licensing scheme we offer even bigger discounts to anyone who bought a license in the last two months. Please contact us at sales@icerbero.com to get a precise renewal quote.

This is the full list of news for the 3.0 version:

+ added Carbon interactive disassembler
added hex editing workspace
– added command line workspace
+ added Windows DMP format support
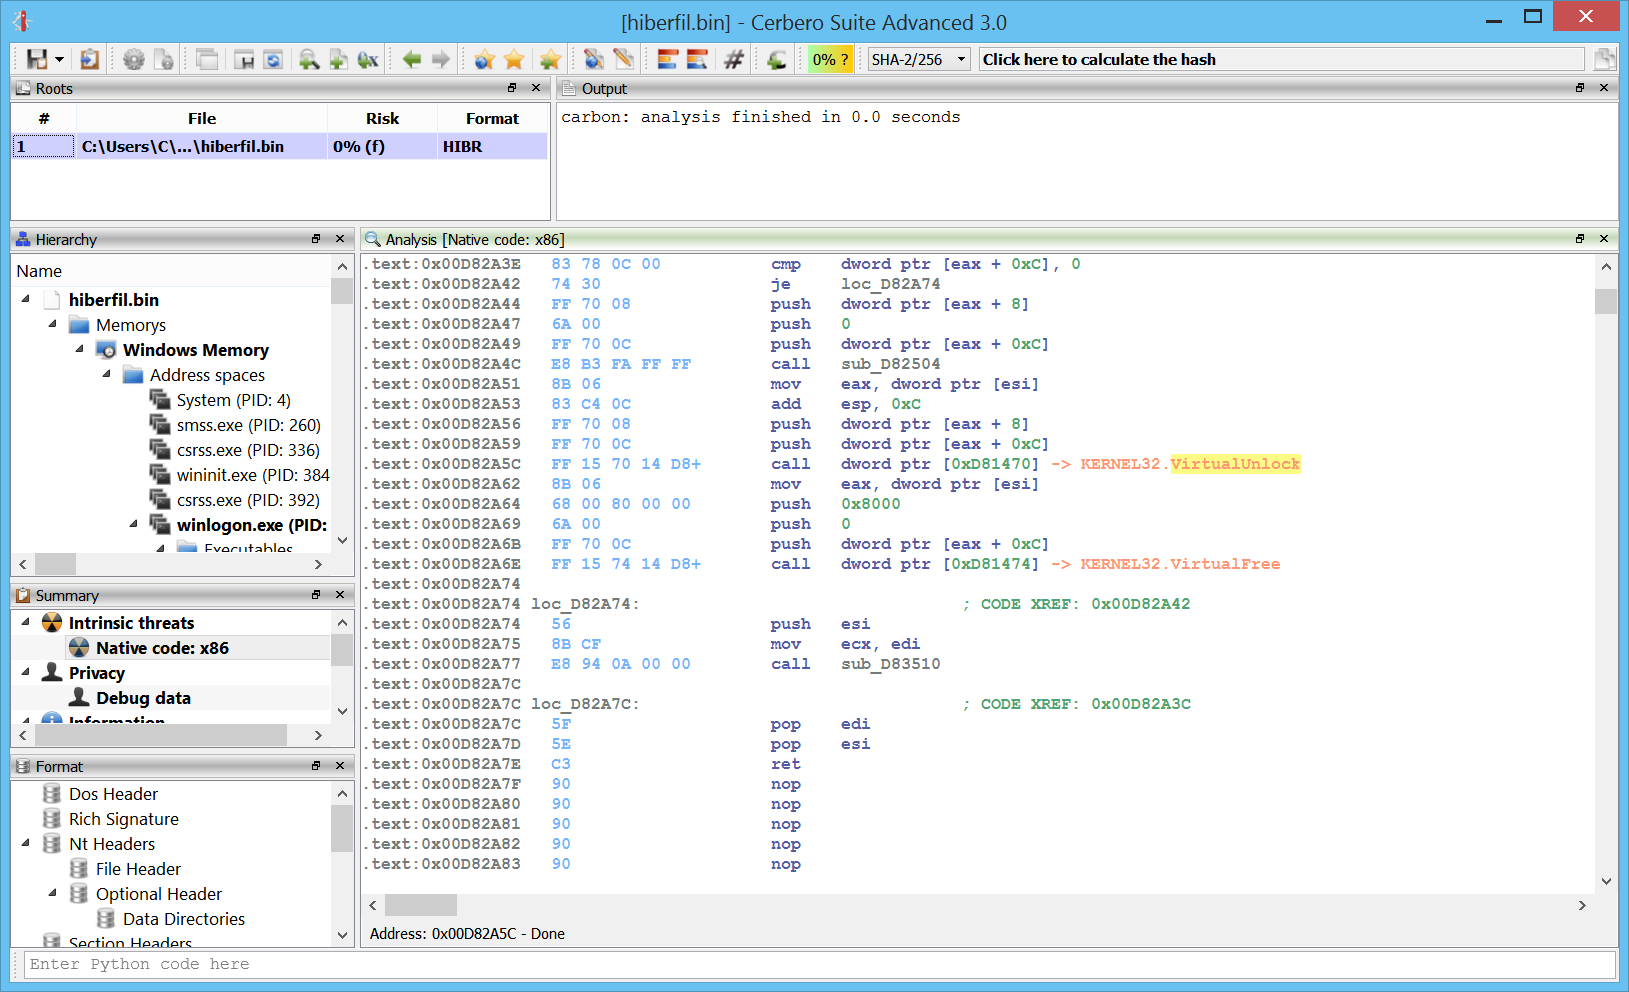
+ added Windows Hibernation files format support
added undo capability in hex views
– exposed workspaces to Python
– improved appearance on high resolution displays
– improved support for SQLite files
+ improved support for EML files
– included local python on Windows

(Note: entries with the ‘+’ sign apply only to the advanced edition.)

As we want to share our road-map with our users, in the next releases we’ll:

– Improve some of the rough edges still present in Carbon.
– Continue working on our x86/x64 analysis.
– Add loaders for ELF and Mach-O.
– Start working on creating signatures for library functions.
– Improve code analysis for memory images.
– Further improve memory analysis.
– Start working on analysis for ARM. This, however, may take a while.

Have a great day and happy hacking! 😉
Carbon Interactive Disassembler

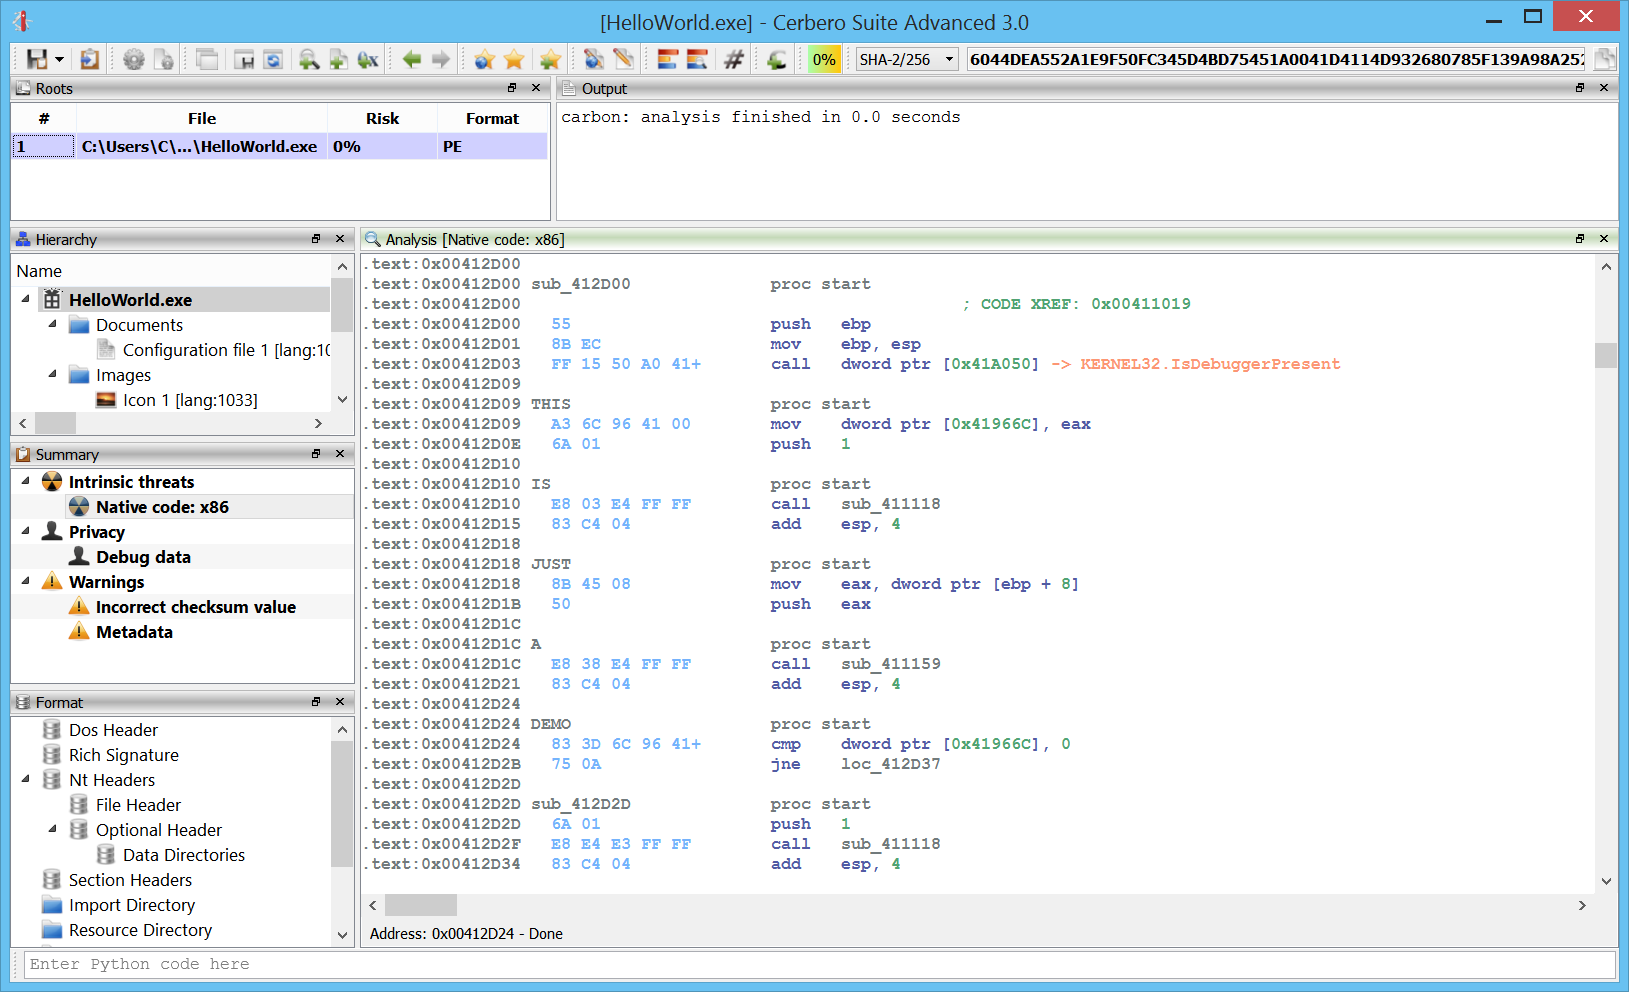
Getting close to the release date of the 3.0 version of Cerbero Suite, it’s time to announce the main feature of the advanced edition: an interactive disassembler for x86/x64.

The initial intent was to enable our users to inspect code in memory dumps as well as shellcode. Today we have very advanced disassemblers such as IDA and Ghidra and it wouldn’t have made sense to try and mimic one of these tools. That’s why I approached the design of the disassembler also considering how Cerbero Suite is being used by our customers.

Cerbero Suite is heavily used as a tool for initial triage of files and that’s why I wanted its disassembler to reflect this nature. I remembered the good old days using W32Dasm and took inspiration from that. Of course, W32Dasm wouldn’t be able to cope with the complexity of today’s world and a 1:1 transposition wouldn’t work.

That’s why in the design of Carbon I tried to combine the immediacy of a tool such as W32Dasm with the flexibility of a more advanced one.

So let’s start with presenting a list of features:

Flat disassembly view

The Carbon disassembler comes with a flat disasm view showing all the instructions in a file. I don’t exclude it will feature a graph view one day as well, but it’s not a priority.

Recursive disassembly

A recursive disassembler is necessary to tackle cases in which the code is interrupted by data. Carbon will try to do its best to disassemble in a short period of time, while still performing basic analysis.

Speed

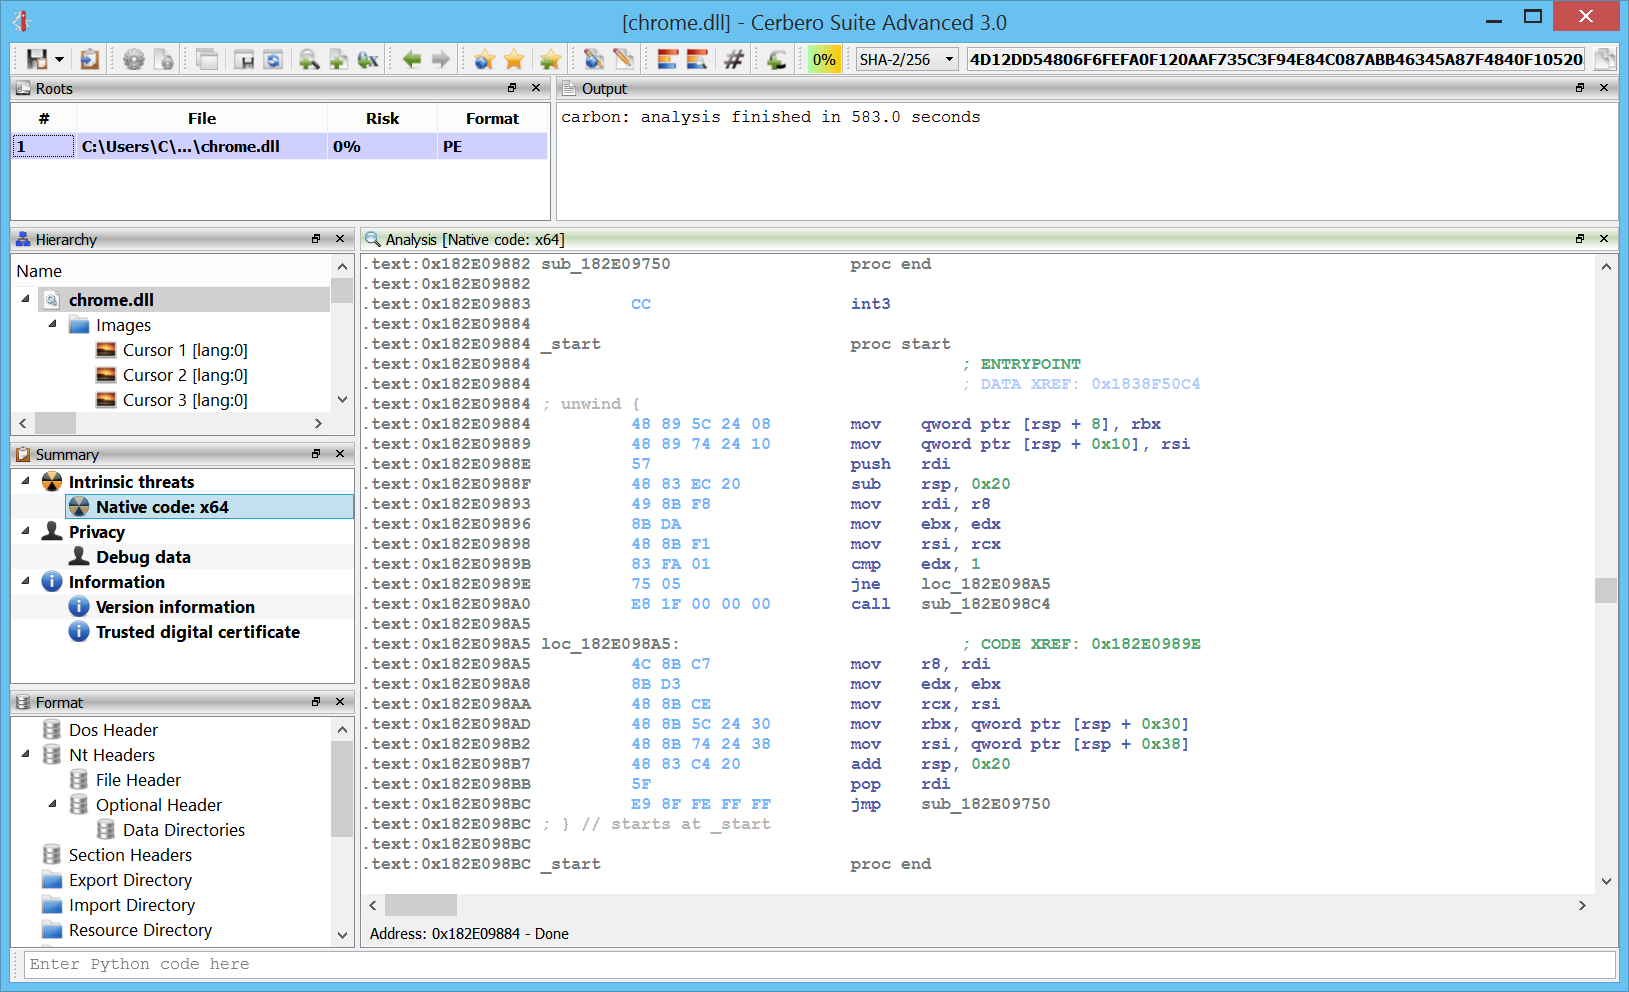
Carbon is multi-thread and seems to handle large files quite fast. This is very useful for the initial triage of a file.

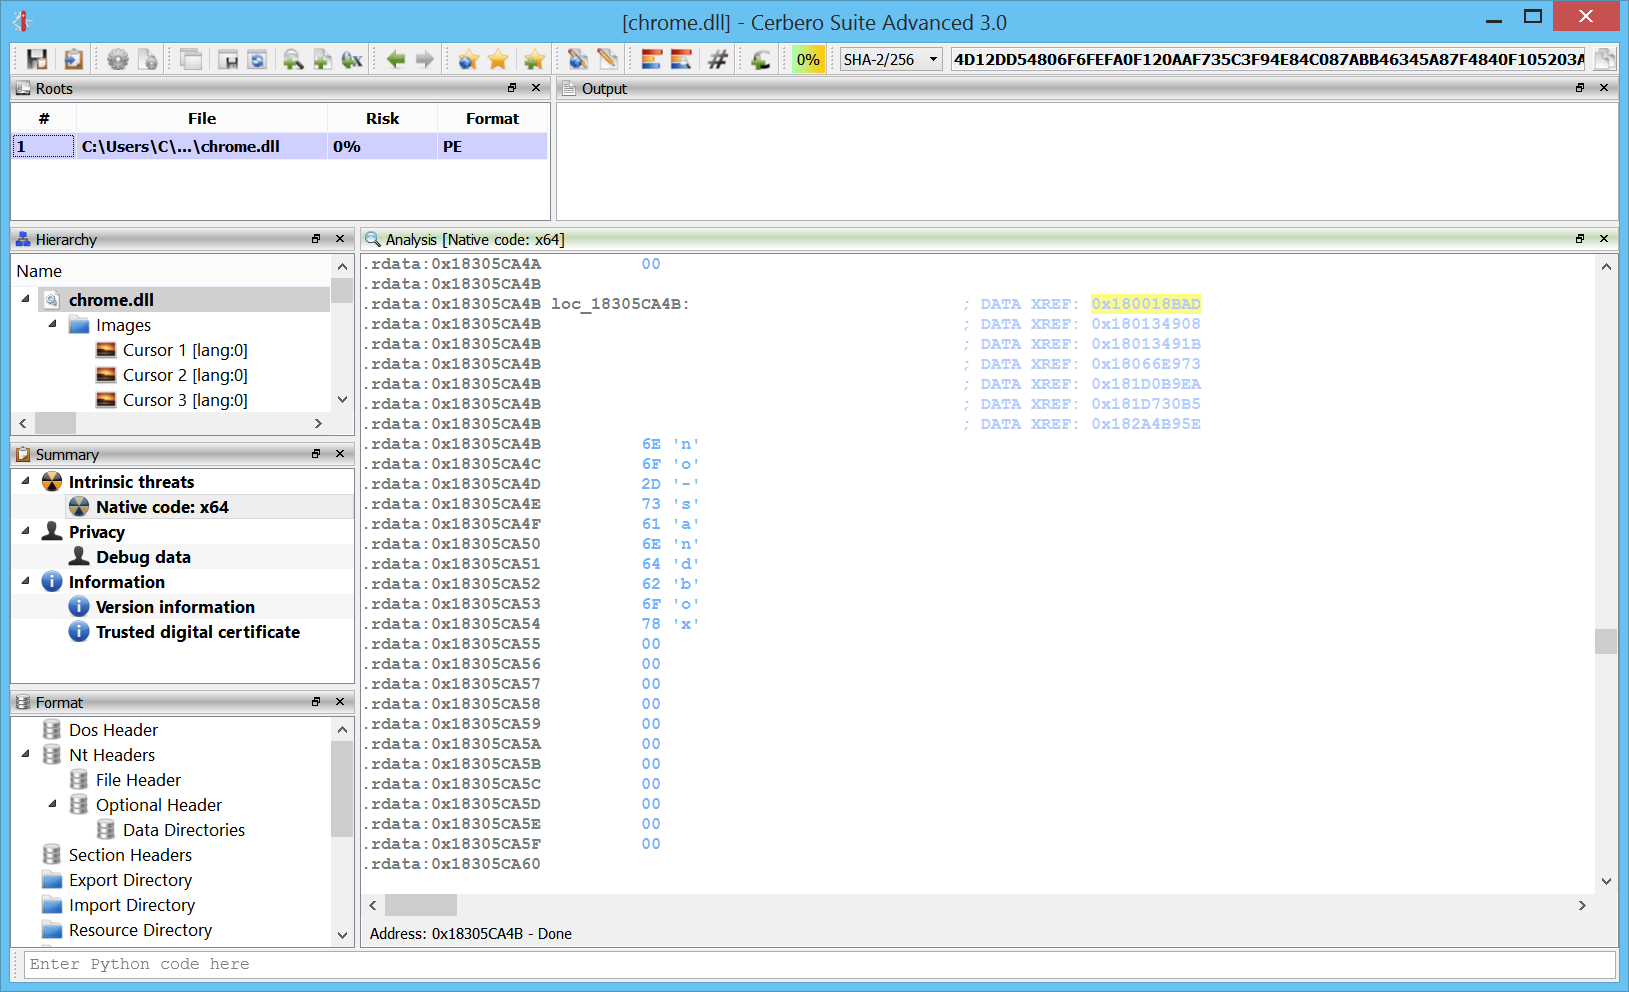
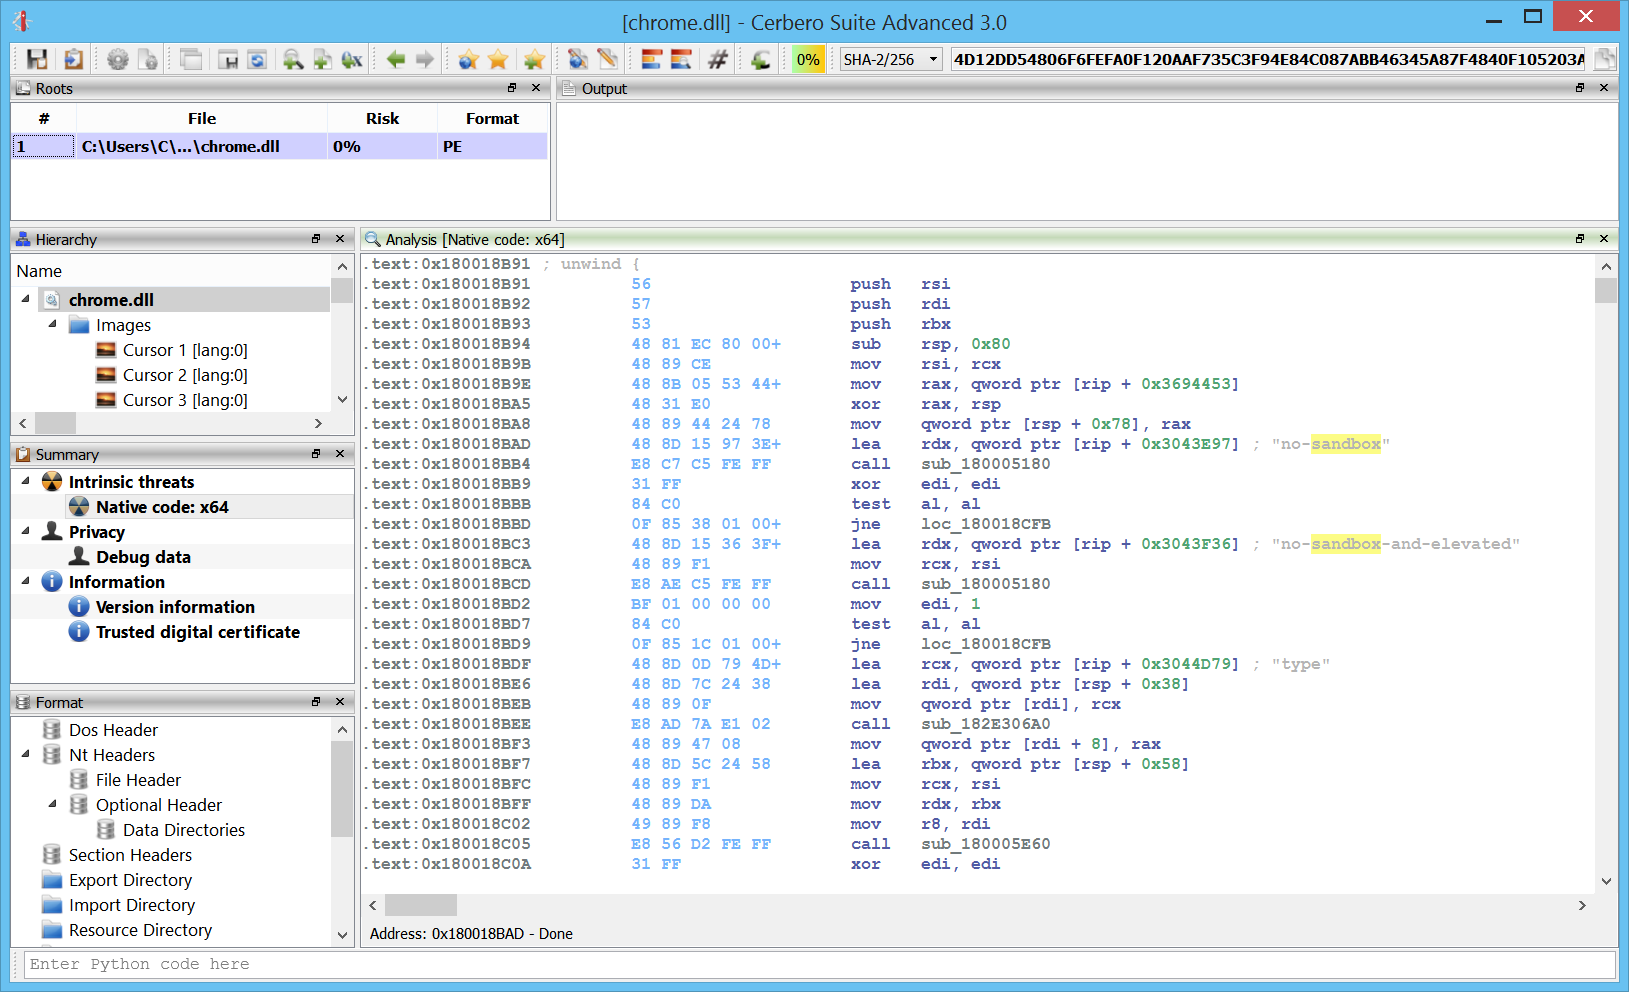
Here we can see the analysis on a 60 MB chrome DLL performed in about ten minutes. And this while running in a virtual machine.

The challenge in the future will be to maintain speed while adding even more analysis passages.

x86/x64 support

Carbon supports both x86 and x64 code. More architectures will be added in the future.

In fact, the design of Carbon will permit to mix architectures in the same disassembly view.

Unlimited databases

A single project in Cerbero can contain unlimited Carbon databases. This means if you’re analyzing a Zip file with 10 executable files, then every one of these files can have its own database.

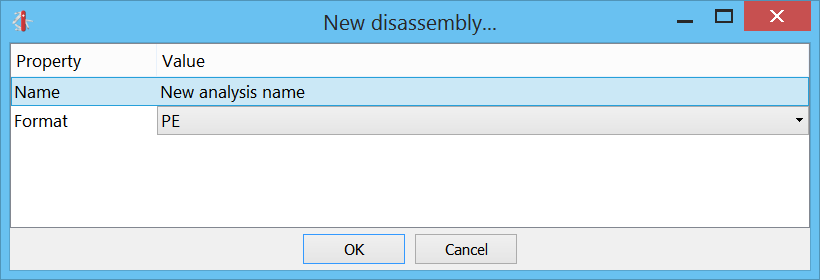
Not only that: a single file can have multiple databases, just click on the Carbon toolbar button or press “Ctrl+Alt+C” to add a new Carbon database.

And if you’re not satisfied with an analysis, it’s not an issue: you can easily delete it by right-clicking on the related Summary entry or by selecting it and pressing “Del”.

Scripting

As most of the functionality of Cerbero Suite is exposed to Python, this is true for Carbon as well. Most of the code of Carbon, including its database, is exposed to Python.

We can load and disassemble a file in a few lines of code.

    s = createContainerFromFile(a)
    obj = PEObject()
    obj.Load(s)
    
    c = Carbon()
    c.setObject(obj, True)
    if c.createDB(dbname) != CARBON_OK:
        print("error: couldn't create DB")
        return False
    if c.load() != CARBON_OK:
        print("error: couldn't load file")
        return False
    c.resumeAnalysis()
    # wait for the analysis to finish...

We can modify and explore every part of its internal database after the analysis has been completed, or we can create a view and show the disassembly:

    ctx = proContext()
    v = ctx.createView(ProView.Type_Carbon, "test")
    ctx.addView(v, True)
    v.setCarbon(c)

The internal database uses SQLite, making it easy to explore and modify it even without using the SDK.

Python loaders

I took early on the decision of writing all file loaders in Python. While this may make the loading itself of the file a little slower (although not that much), it provides enormous flexibility by allowing users to customize the loaders and adding functionality. Also adding new file loaders is extremely simple.

The whole loader for PE files is about 350 lines of code. And here is the loader for raw files:

from Pro.Carbon import *

class RawLoader(CarbonLoader):

    def __init__(self):
        super(RawLoader, self).__init__()
        
    def load(self):
        # get parameters
        p = self.carbon().getParameters()
        try:
            arch = int(p.value("arch", str(CarbonType_I_x86)), 16)
        except:
            print("carbon error: invalid arch")
            arch = CarbonType_I_x86
        try:
            base = int(p.value("base", "0"), 16)
        except:
            print("carbon error: invalid base address")
            base = 0
        # load
        db = self.carbon().getDB()
        obj = self.carbon().getObject()
        # add region
        e = caRegion()
        e.def_type_id = arch
        e.flags = caRegion.READ | caRegion.WRITE | caRegion.EXEC
        e.start = base
        e.end = e.start + obj.GetSize()
        e.offset = 0
        db.addRegion(e)
        # don't disassemble automatically
        db.setState(caMain.FINISHED)
        return CARBON_OK

def newRawLoader():
    return RawLoader()

Once you’re familiar with the SDK, it’s quite easy to add new loaders.

Raw / PE loader

Initial file support comes for PE and raw files.

This, for instance, is some disassembled shellcode.

In memory PEs

One of the main cool features is the capability to analyze in-memory PE files.

Here is the code of an in-memory PE:

Of course, the disassembly is limited to memory pages which haven’t been paged out, so there might be some gaps.

We haven’t played yet much with this feature and its functionality will be extended with upcoming releases.

Cross references

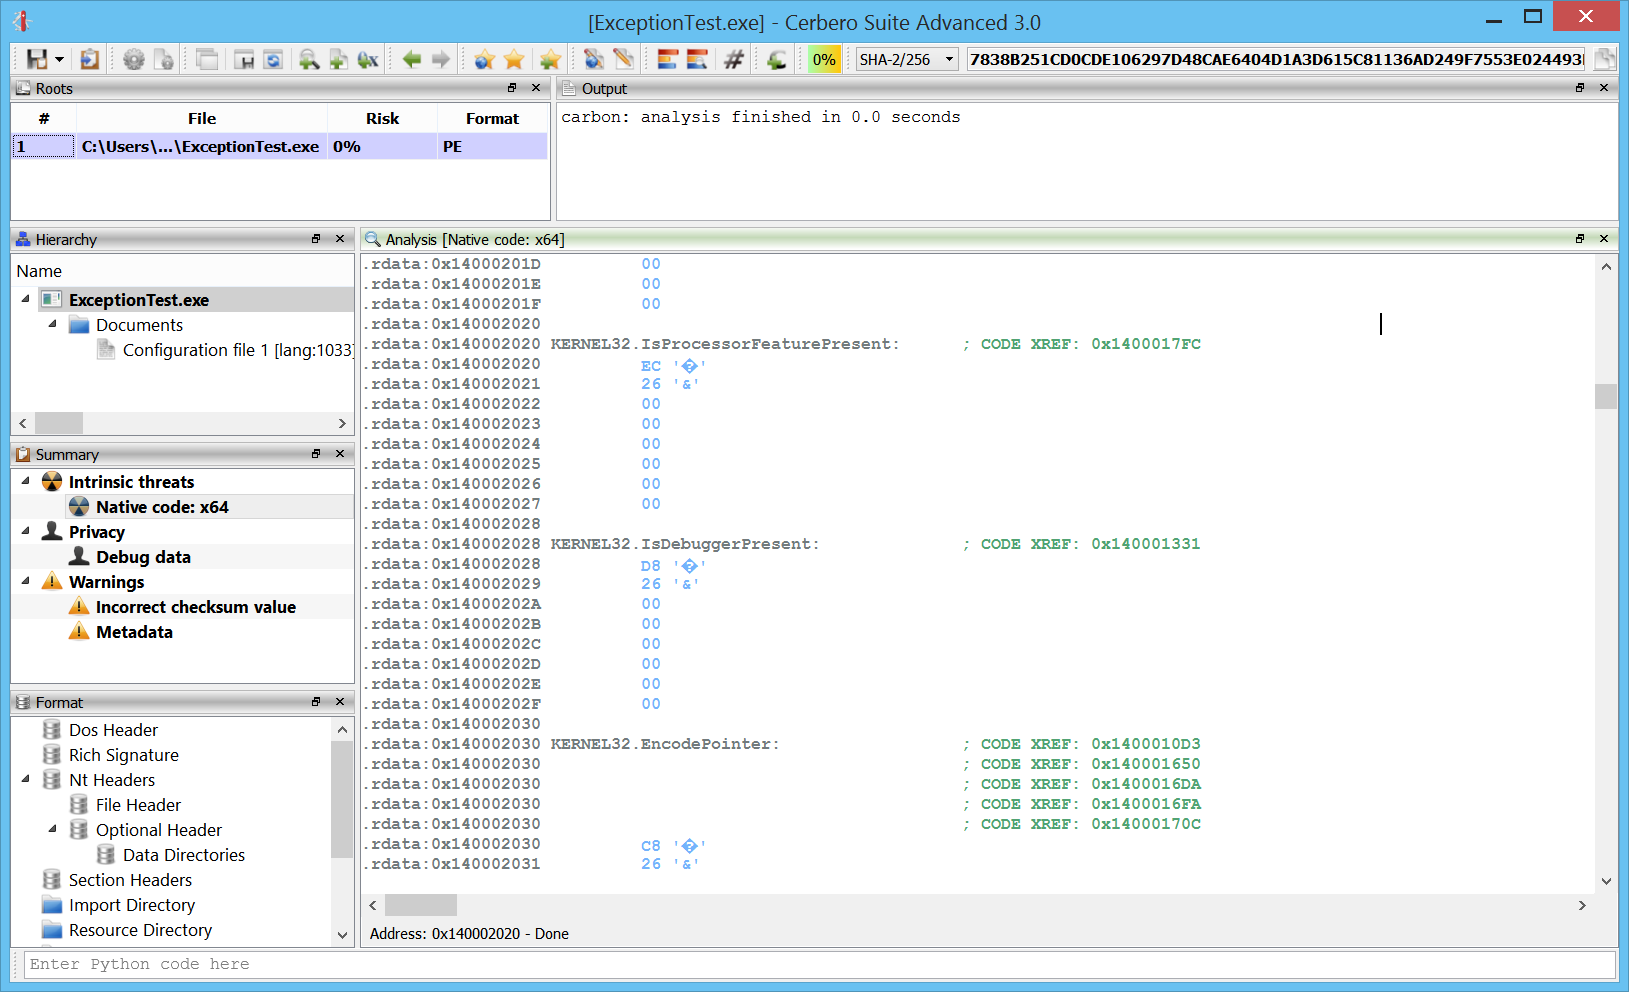
Of course, no decent disassembler can lack cross references:

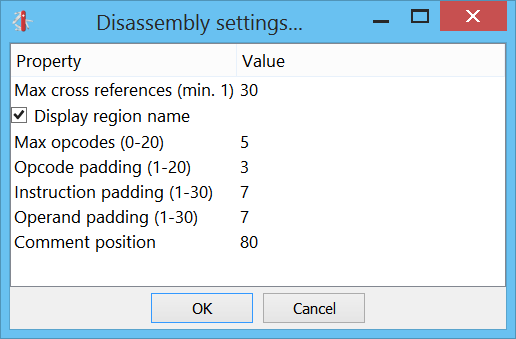
We can also choose how many cross references we want to see from the settings:

Renaming

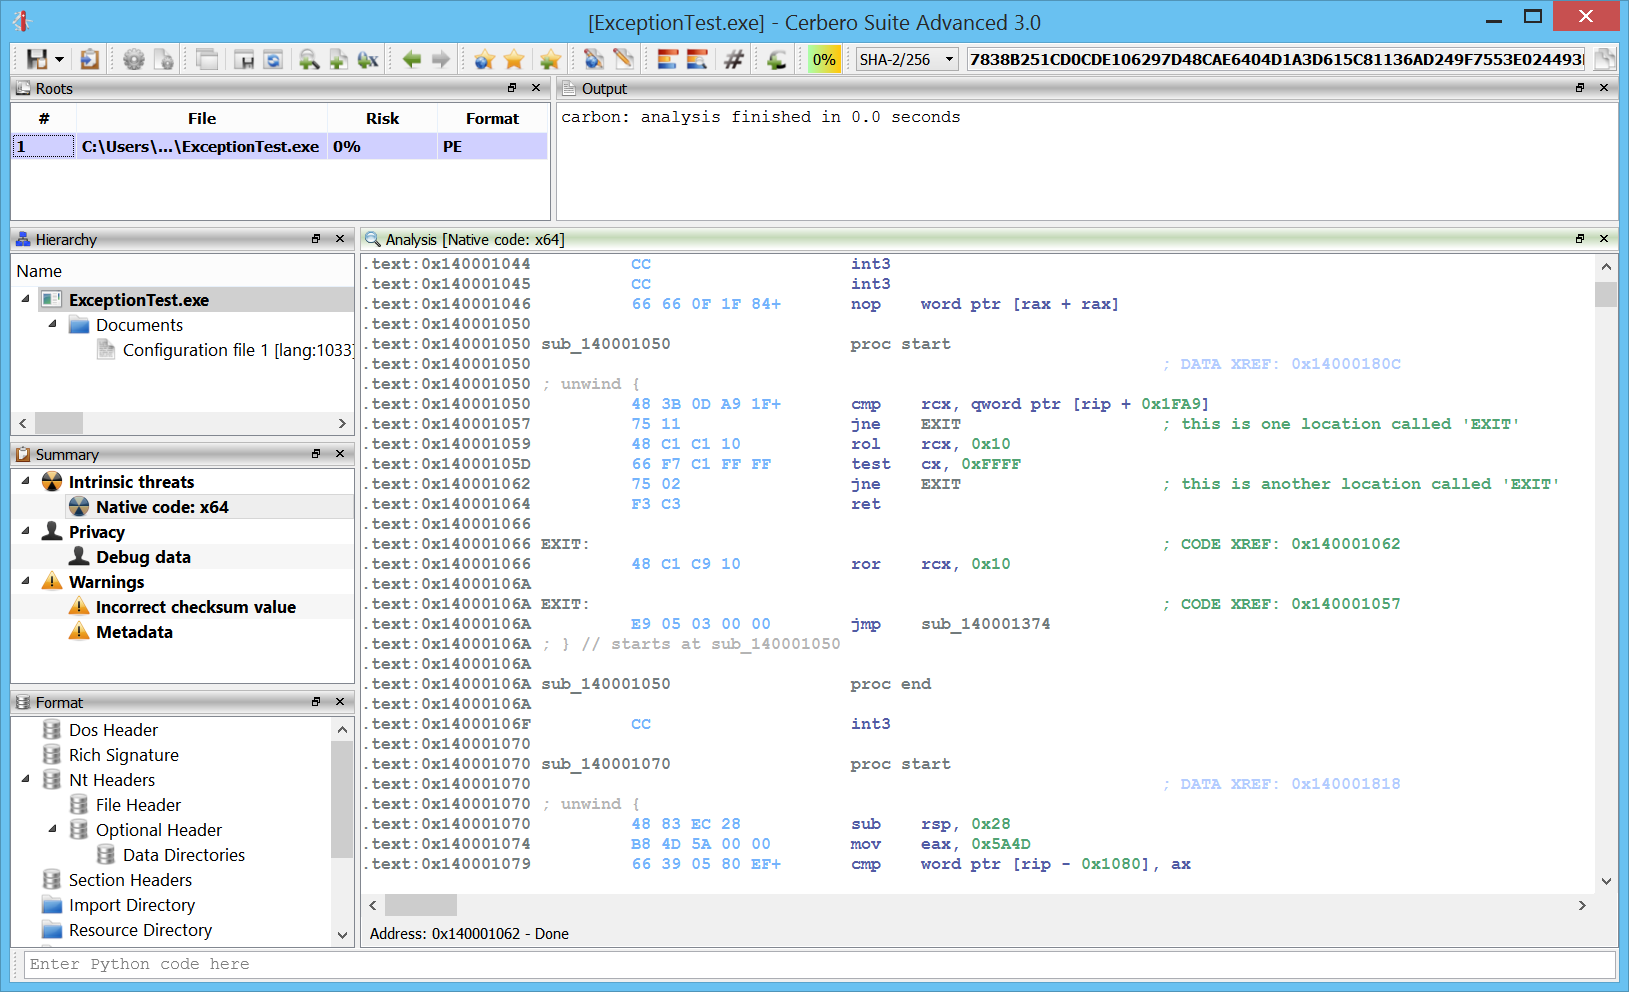
We can name and rename any location or function in the code. Duplicates are allowed. Any why shouldn’t they? We could have more than one method with “jmp ERROR” instances, even if the ERROR doesn’t point to the same location.

Make code/undefine

We can transform undefined data to code by pressing “C” or, conversely, transform code to undefined data pressing “U”.

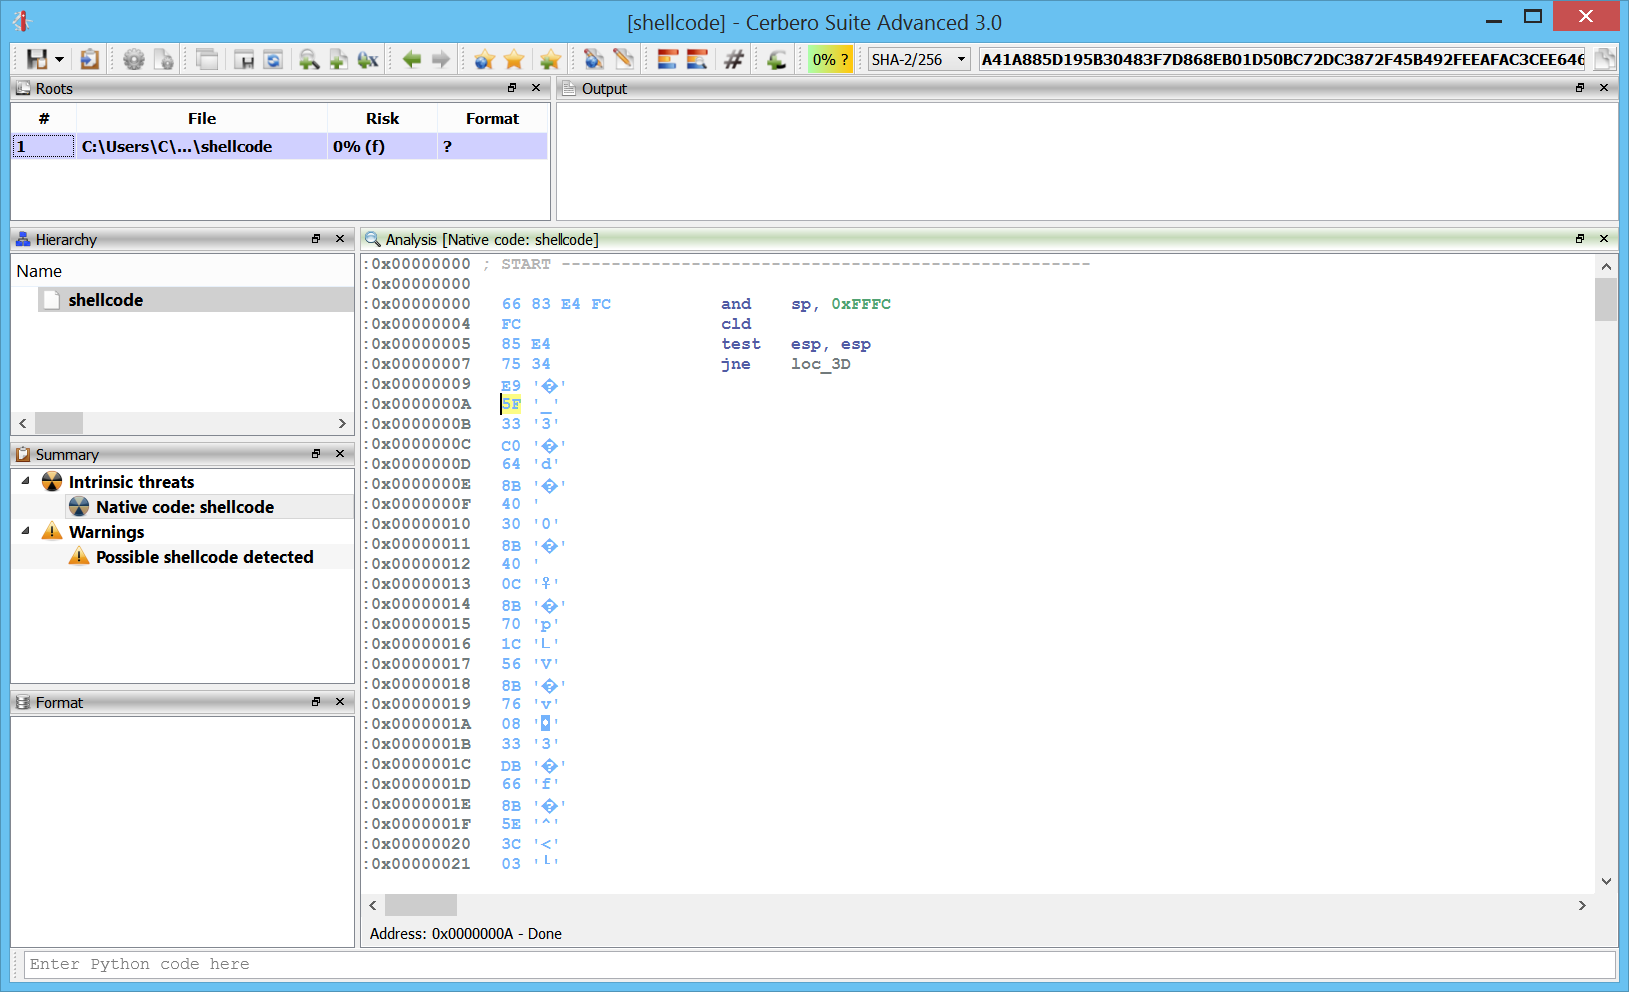
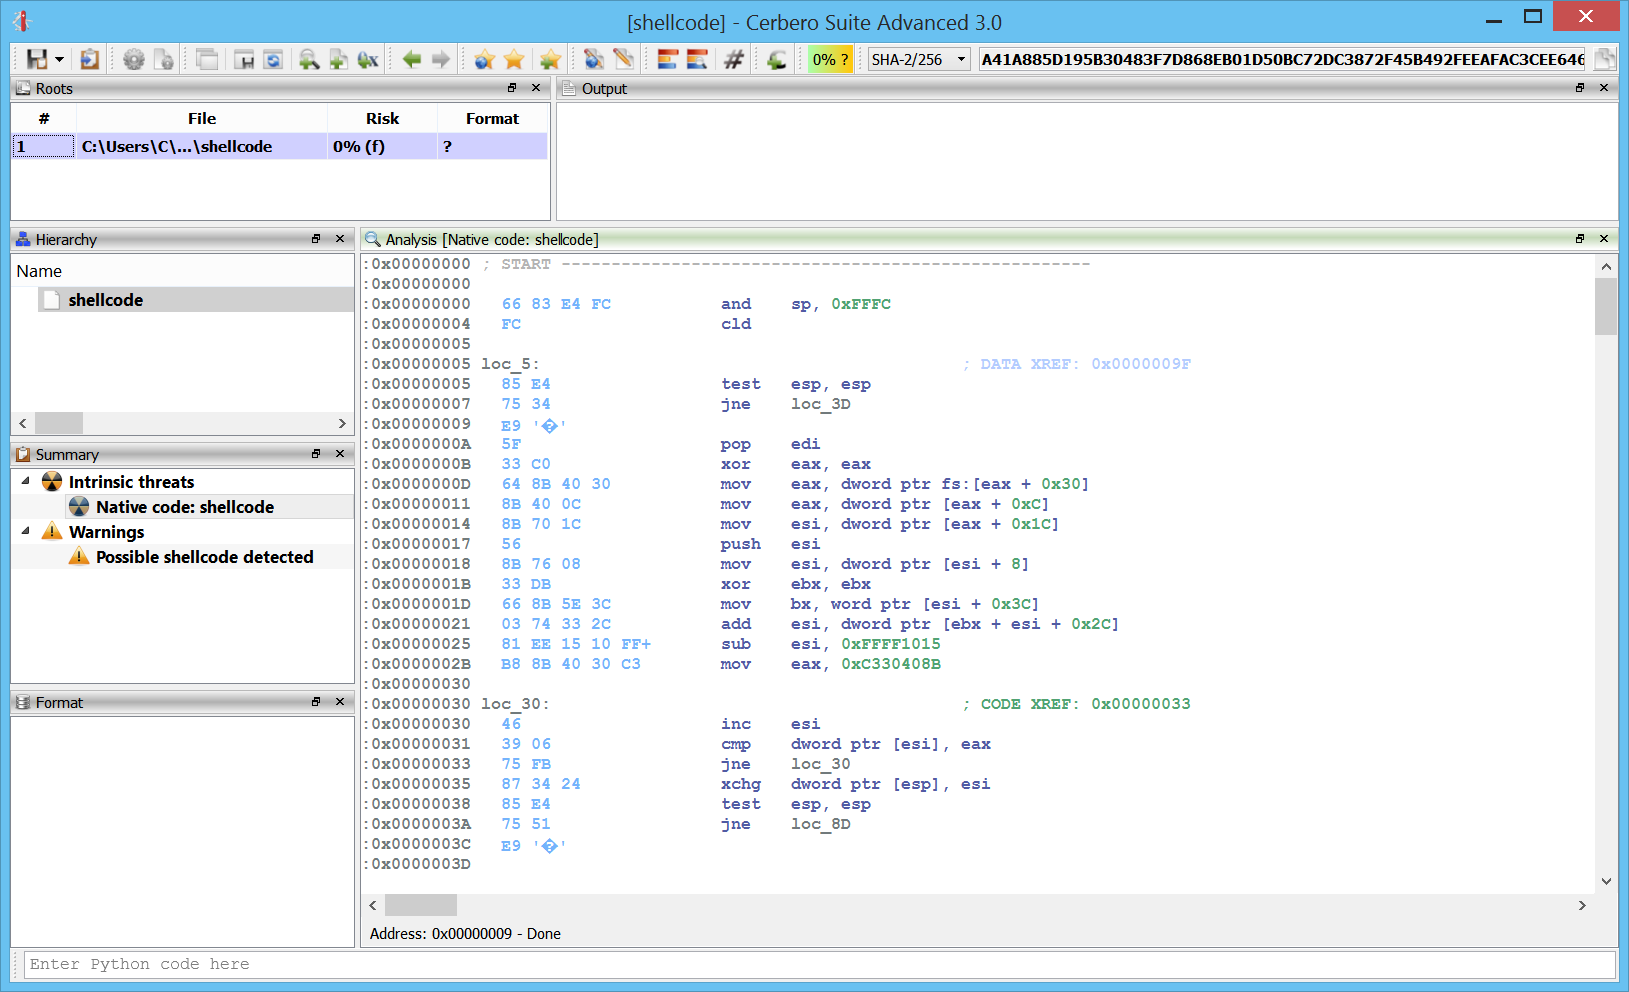
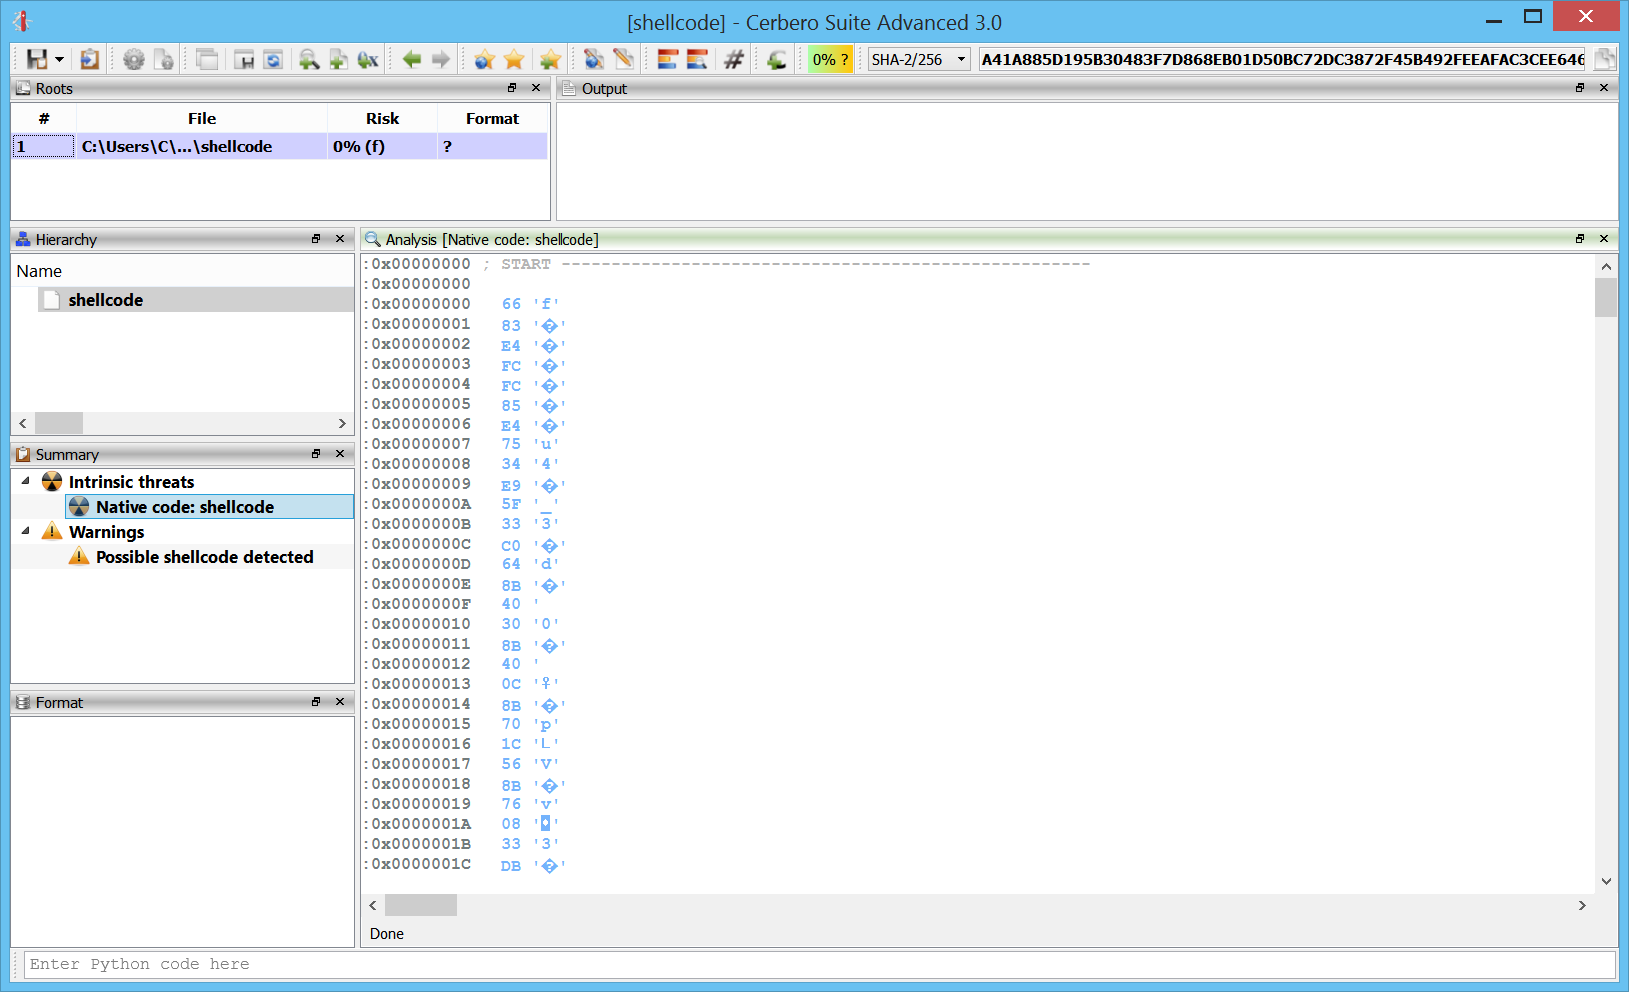
Here we add a new Carbon database to a shellcode. As you can see it’s all undefined data initially:

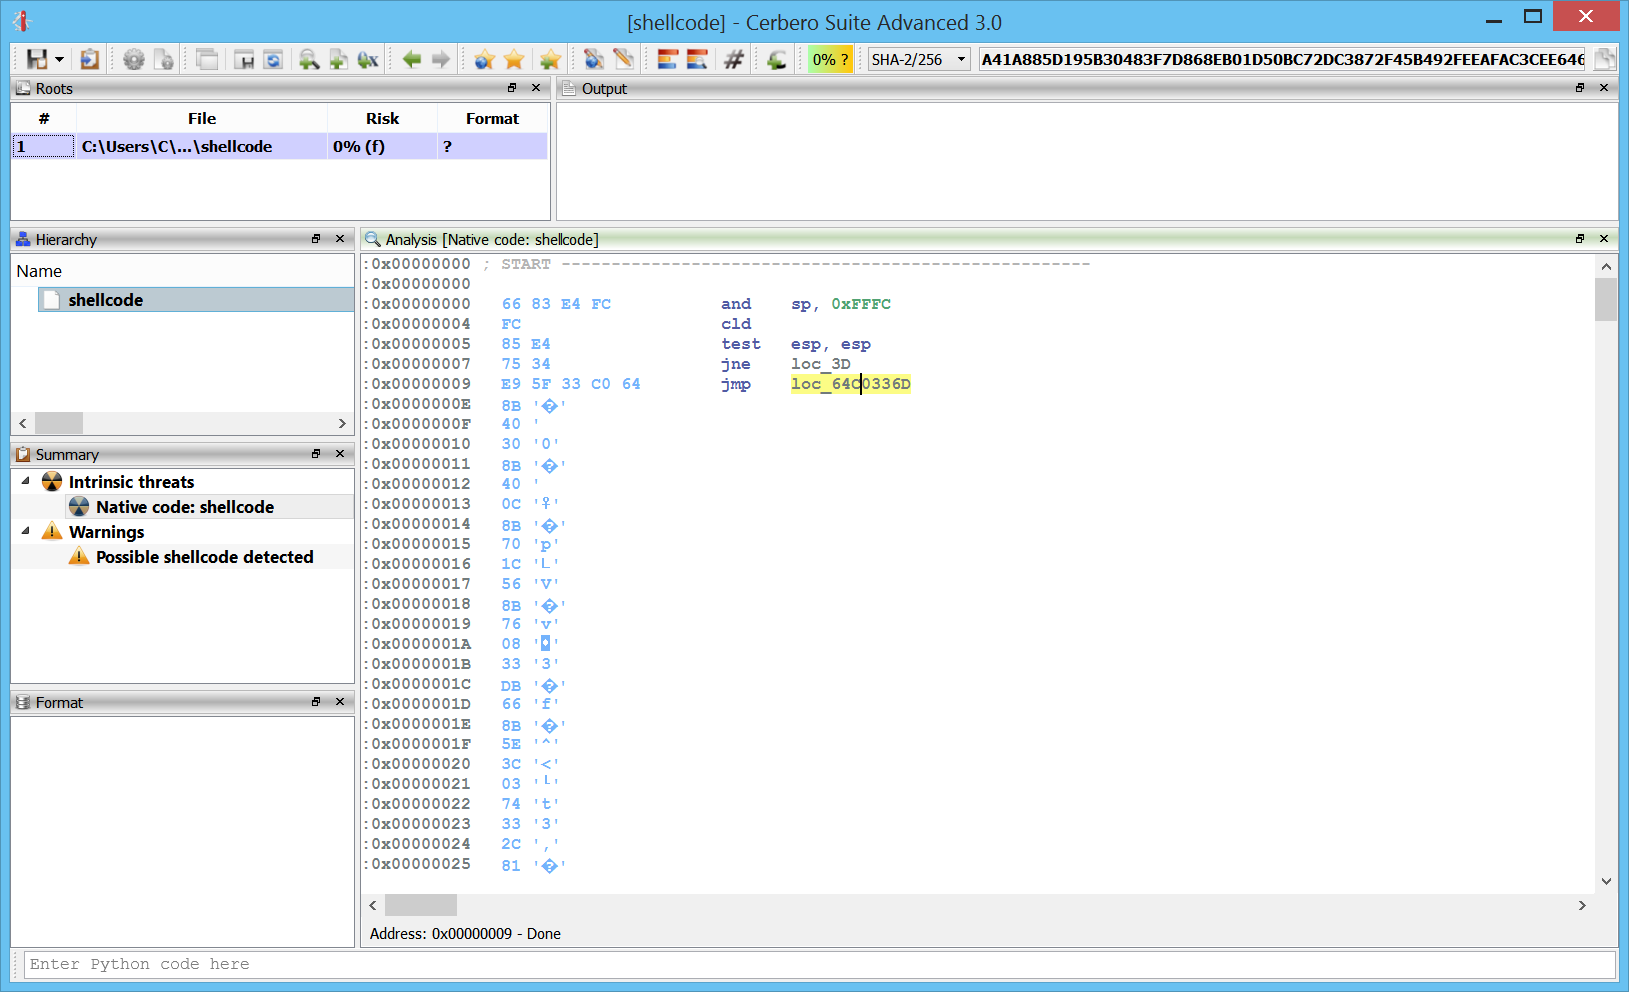
After pressing “C” at the first byte, we get some initial instructions:

However, as we can see, the highlighted jump is invalid. By following the “jne” before of the “jmp” we can see that we actually jump in a byte after the “jmp” instruction. So what we do is to press “U” on the “jmp” and then press “C” on the byte at address 0xA.

After pressing “C” again at 0xA:

Now we can properly analyze the shellcode.

Functions

We can easily define and undefine functions wherever we want.

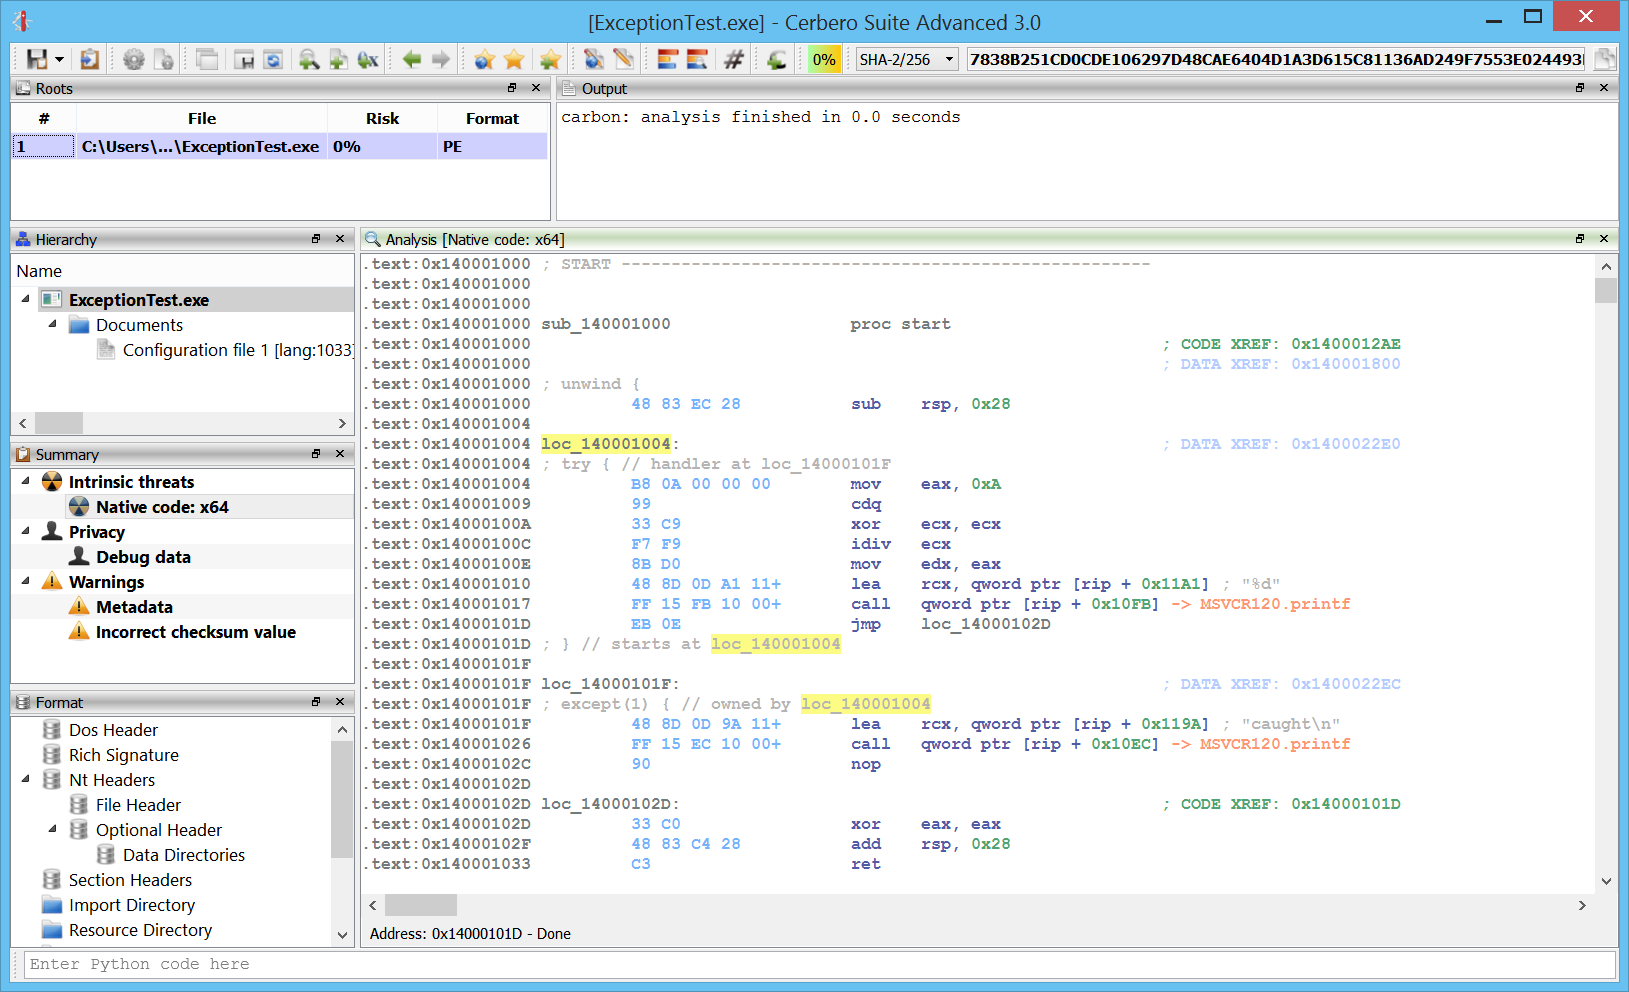
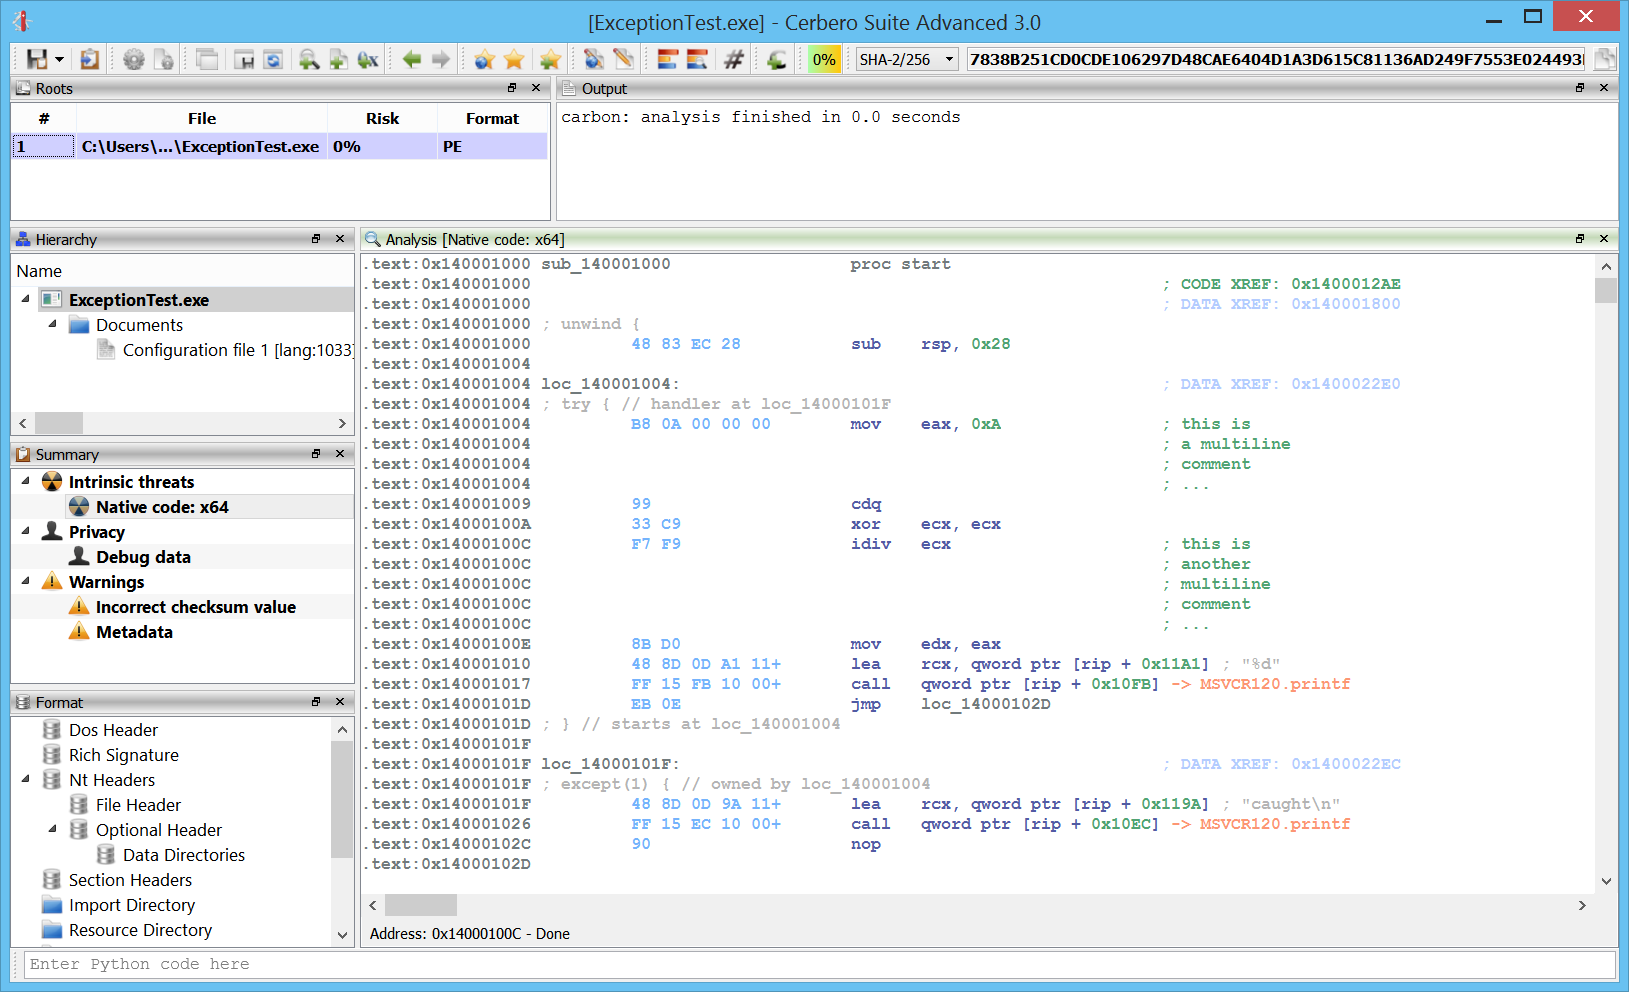
Exceptions

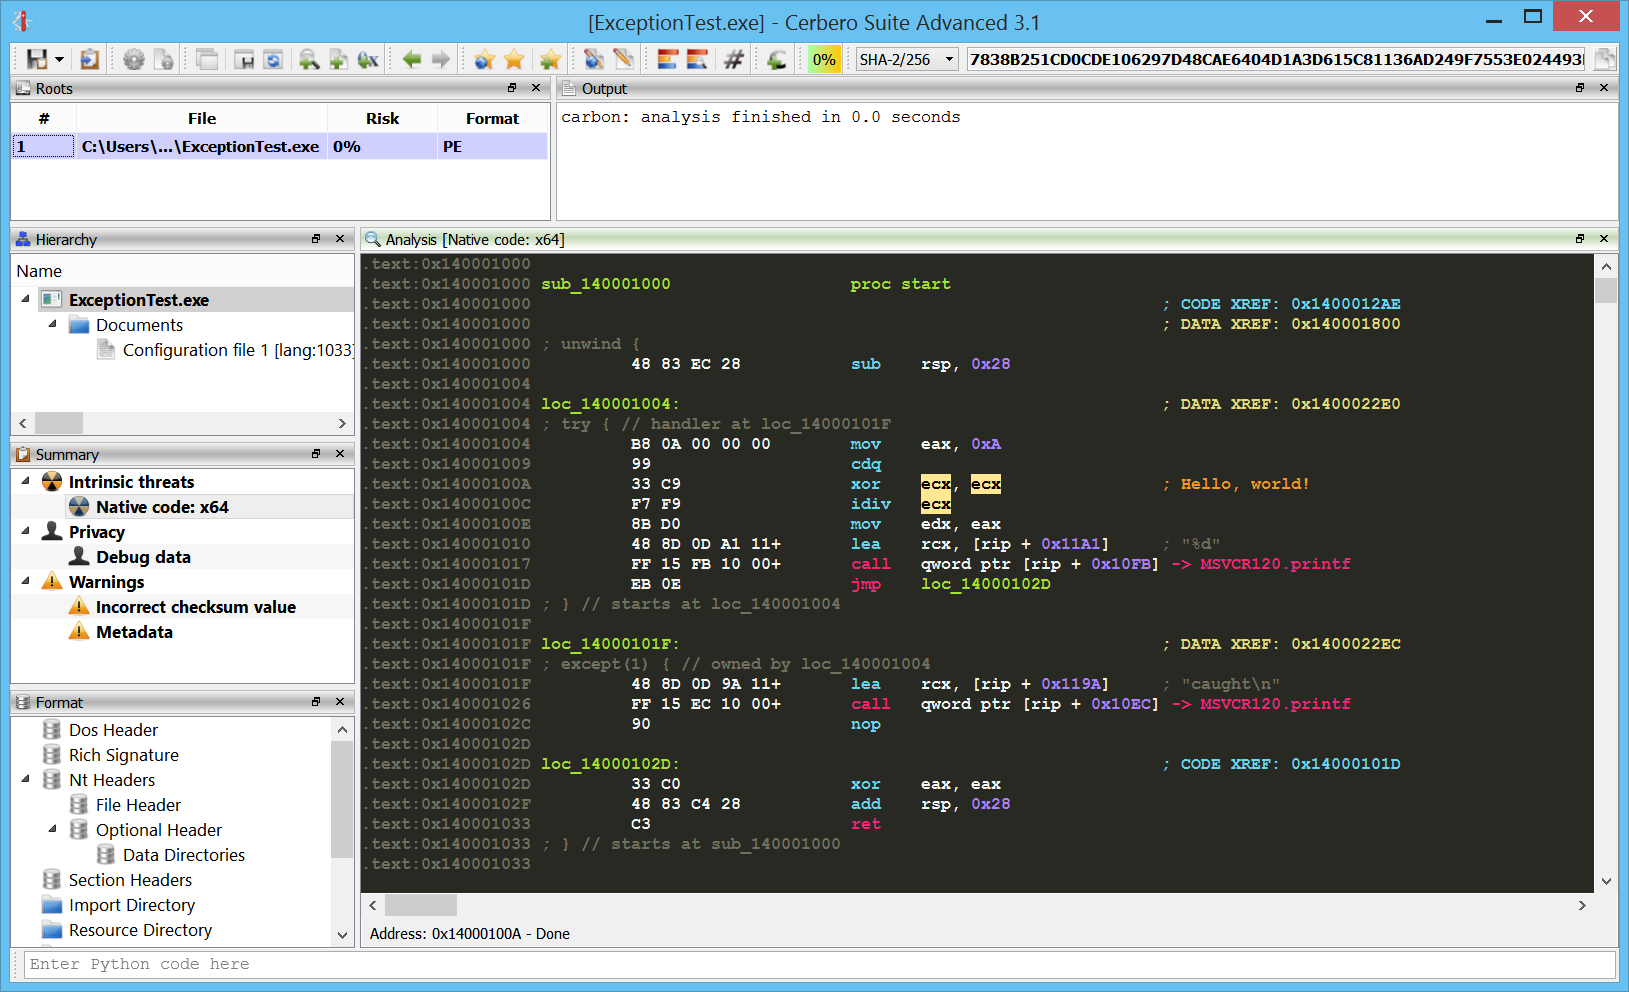
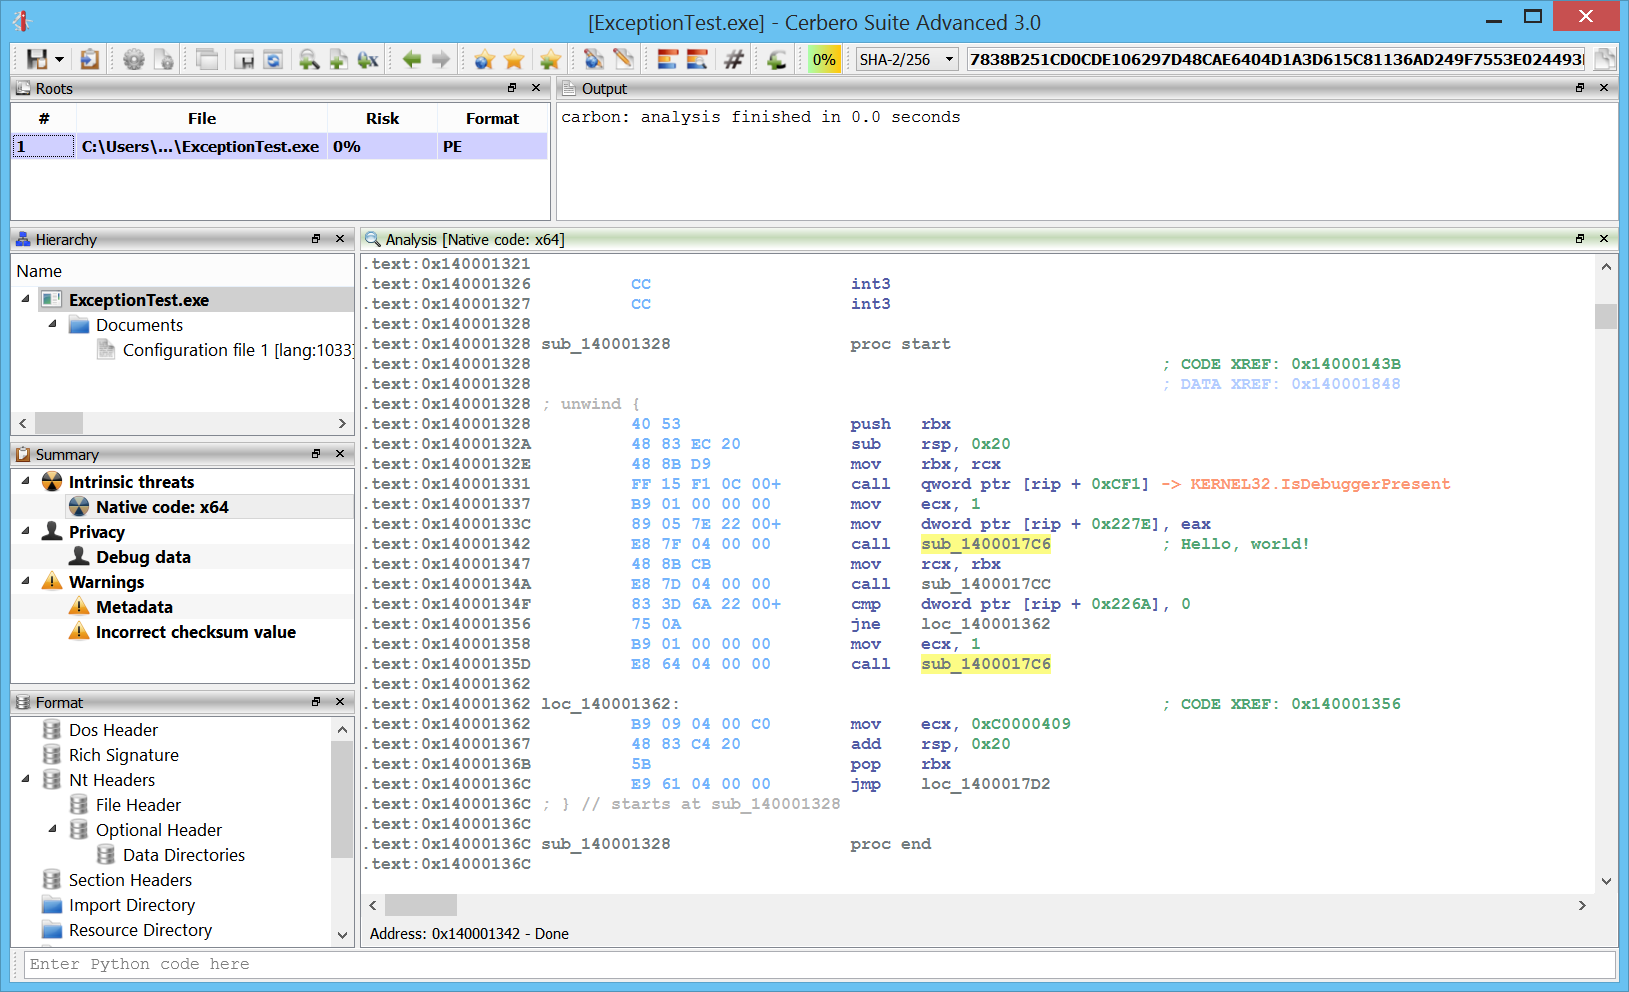
x64 exceptions are already supported.

Comments

One of the most essential features is the capability to add comments.

Flagged locations

You can also flag locations by pressing “Alt+M” or jump to a flagged location via “Ctrl+M”.

Lists

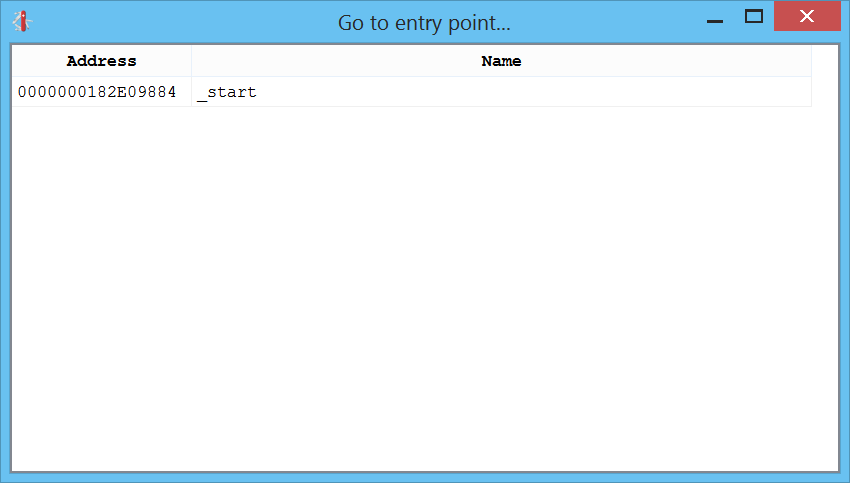
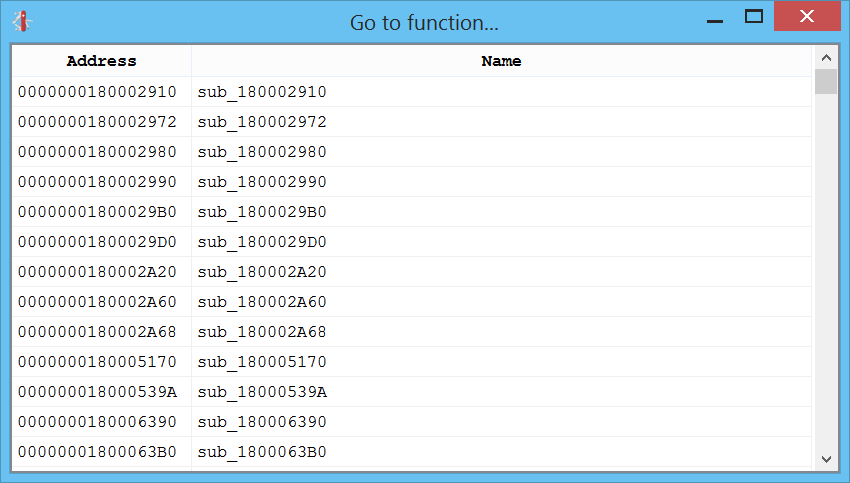
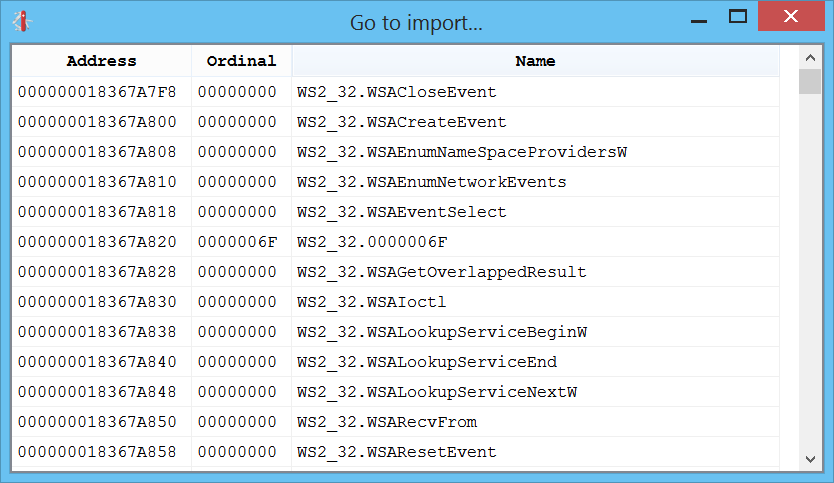
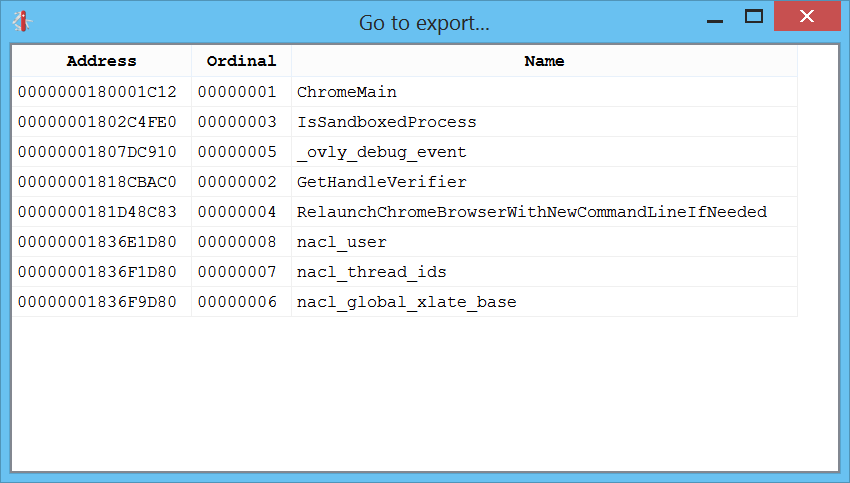
The shortcuts going from “Ctrl+1” to “Ctrl+4” present you various lists of things in the disassembly which you can go to.

Ctrl+1 shows the list of entry-points:

Ctrl+2 shows the list of functions:

Ctrl+3 shows the list of imports:

Ctrl+4 shows the list of exports:

Strings

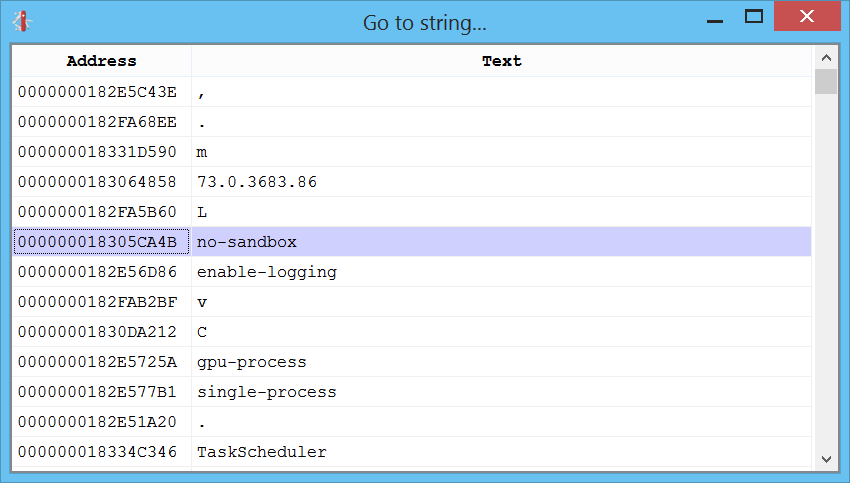
What about a good-old-days list of strings? That can be created by pressing “Ctrl+5”:

Once we jump to a string we can examine the locations in the code where it is used:

The disassembly itself will try to recognize strings and present them as self-generated comments whenever appropriate:

Integration

Great care has been taken to fit Carbon nicely in the entire logic of Cerbero Suite. Carbon databases are saved inside Cerbero Suite projects just as any other part of the analysis of a file.

While Carbon already provides support for flagged locations, nothing prevents you to use bookmarks as well to mark locations and jump back to them. The difference is that flagged locations are specific to an individual Carbon database, while bookmarks can span across databases and different files.

Themes

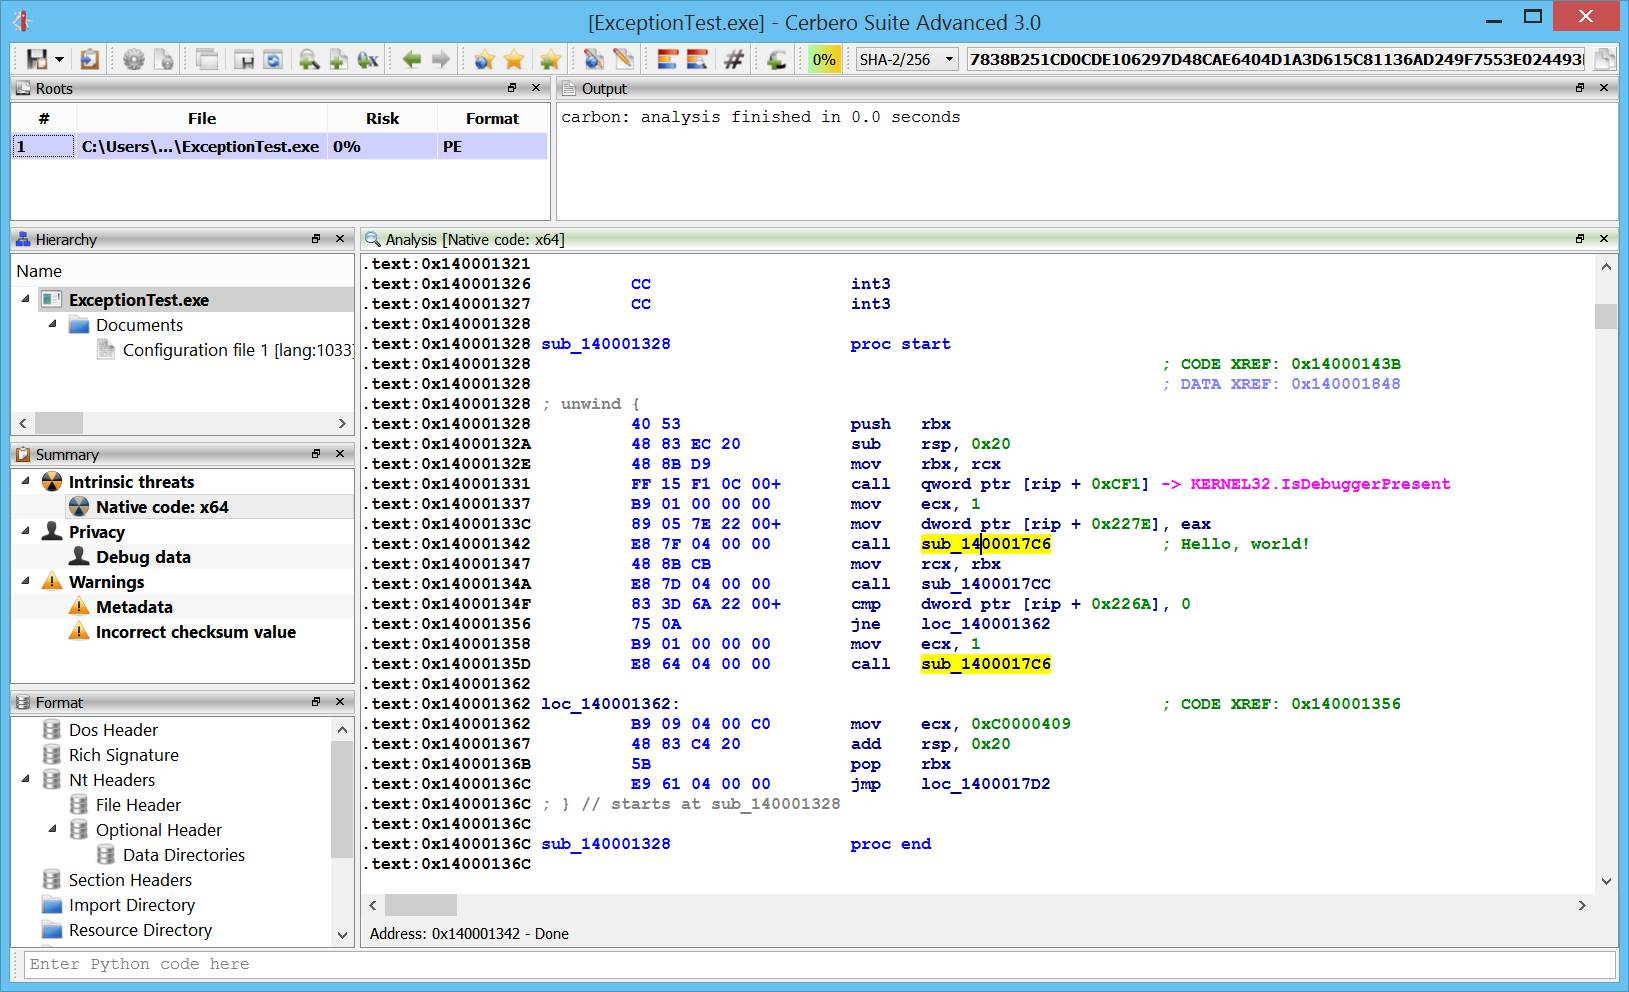
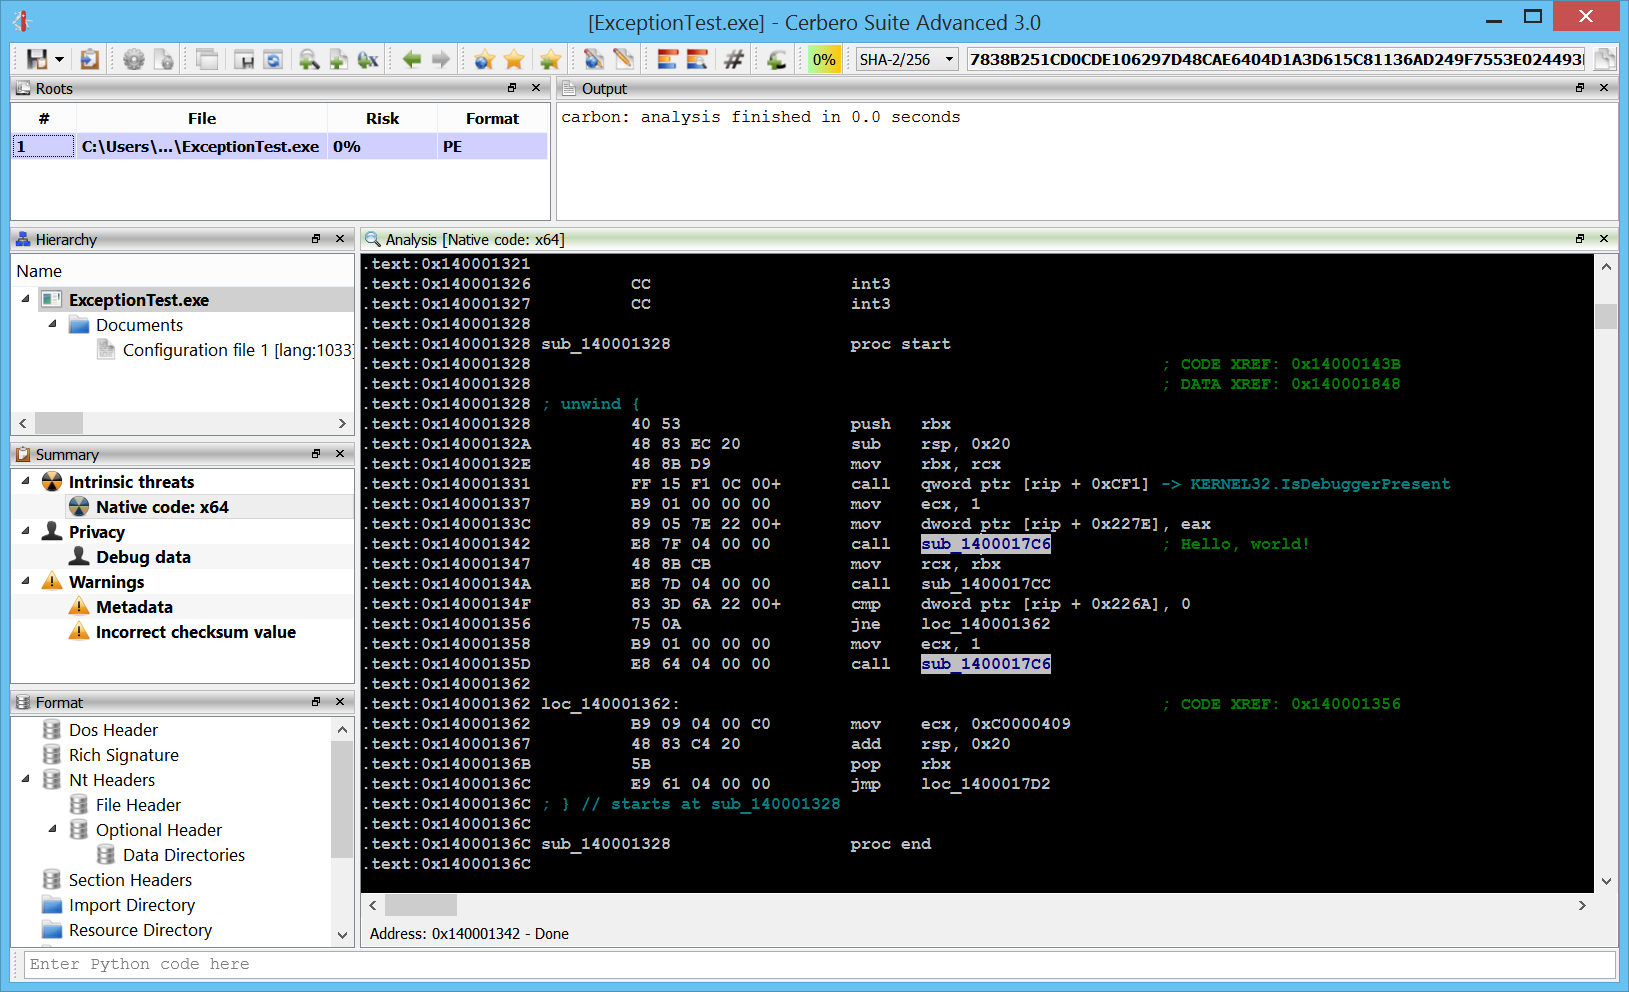
Last but not least: some eye candy. From the settings it’s possible to switch on the fly the color theme of the disassembly. The first release comes with the following four themes.

Light:

Classic:

Iceberg:

Dasm:

I’m sure that in the future we’ll be adding even more fun color themes. 🙂

Coming soon!
Profiler 2.9.2 – Windows 10 Heap

The version 2.9.2 of Profiler is out with two improvements. The first one, is more or less a rewrite of the CCITTFax decoder for PDFs, which has now been tested against more samples.

The second improvement is the addition of support for the new heap introduced in Windows 10.

This removes the limitation mentioned previously of heap parsing regarding certain Windows 10 processes such as: smss.exe, csrss.exe, services.exe, lsass.exe, svchost.exe, MicrosoftEdgeC, etc.

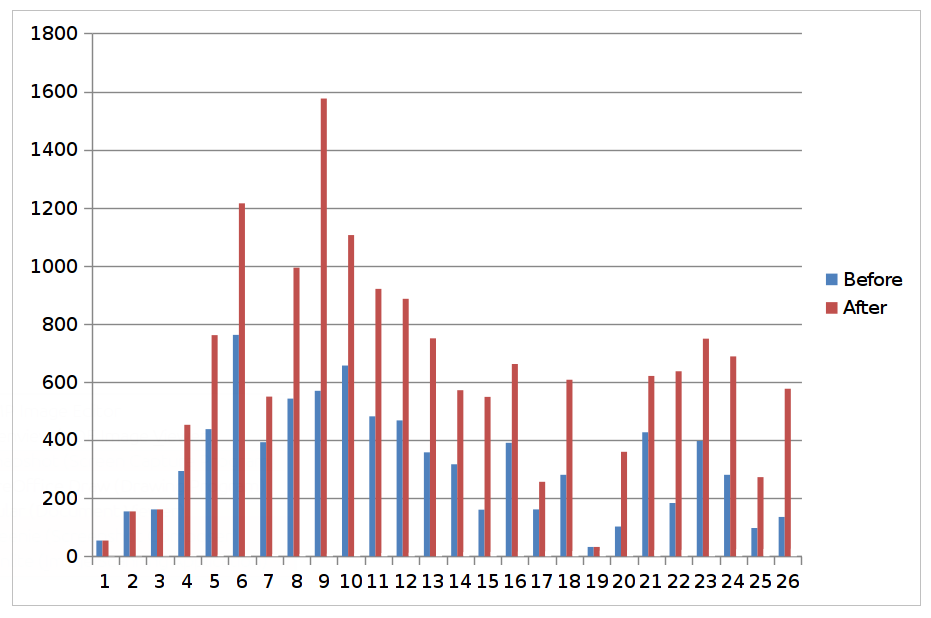
As with the older NT heap we use an aggressive approach to rebuild the Windows 10 heap as best as we can even if there are missing pages.

The schema below shows the number of chunks found using an aggressive approach versus a soft one in a Win10 x64 image.

Profiler 2.9

Profiler 2.9.1 is out with the following news (entries with the plus sign apply only to the advanced edition):

+ added parsing of Windows heap
+ added file detection in memory regions and heap
+ added file detection in memory regions and heap via libmagic
added CCITTFax decoder for PDFs
added detection of DDE field codes
added support for 64-bit shellcode to executable
+ added display of page flags in hex views
added actions for text modification
added action to dump mapped PEs to disk
+ added signature for automatic recognition of EML files
+ improved identification speed of raw Windows memory images
+ improved loading speed of raw Windows memory images
+ improved scanning speed of memory images
+ improved global address space hex view
+ improved user address space view
improved fault tolerance of the XML parser
– improved CFBF support
– improved support of embedded OLE objects
– improved extraction of VBA code
– improved PDF decryption
– updated SQLite to 3.21.0
– updated libmagic to 5.32
– fixed XML to text action
– fixed Python multithreading issues
– fixed many small issues
– removed PasteBin action

We’ve waited for the official announcement of the new release, because we wanted to pack some more features inside 2.9.1!

After this edition, we will continue to release minor versions, while preparing a major 3.0 edition scheduled for the second half of this year.

Windows memory image identification speed

One of the main things we improved in 2.9 is the speed of opening memory images. The user has now the option whether or not to scan files in memory. Most of the times scanning files in memory is not needed and makes the opening of a memory image unnecessarily slow.

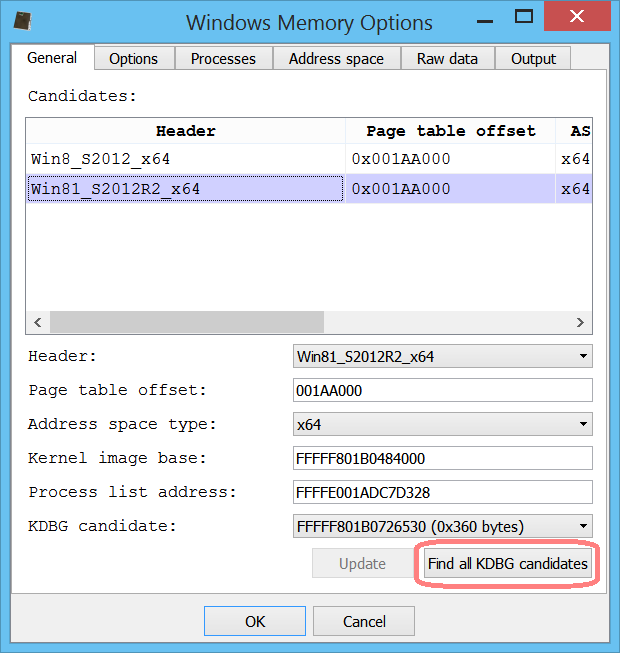
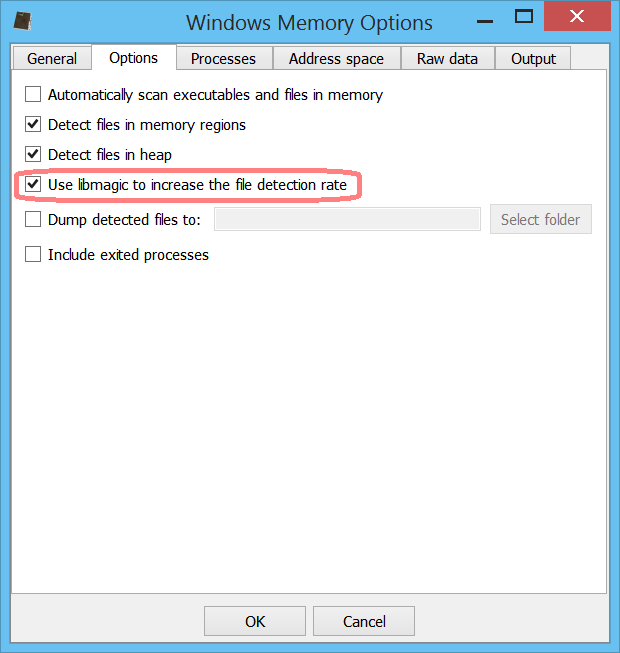
Version 2.9.1 comes with an additional very important speed improvement: the options dialog will pop up at the first occurrence of a valid KDBG structure. The user can still opt to look for additional KDBG structures as highlighted in the screenshot below.

Memory file detection via libmagic

The main addition in version 2.9.1 versus 2.9.0 is the capability to increase the file detection rate of files in memory using libmagic.

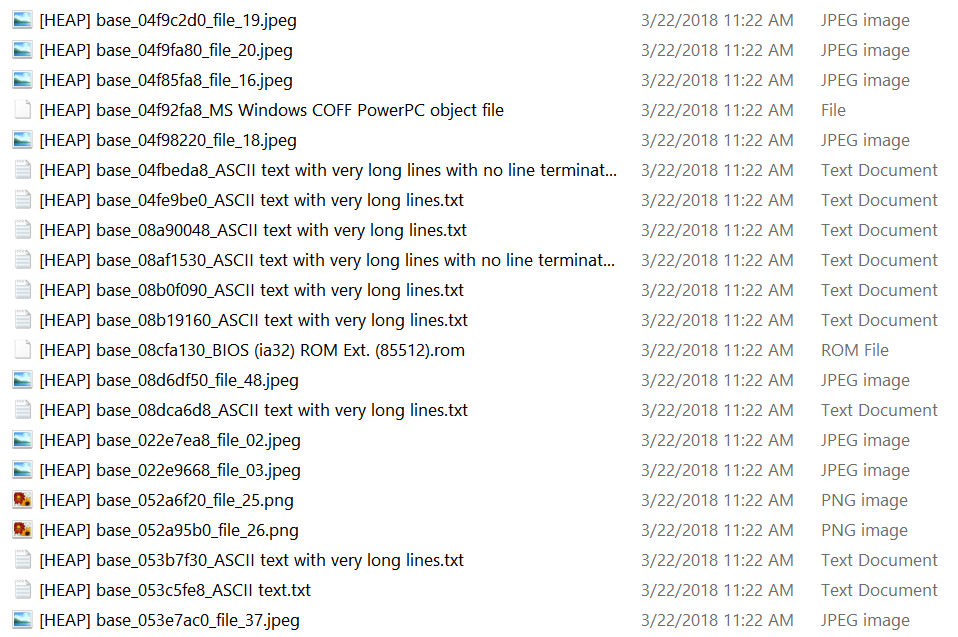
We can dump all files detected to disk as well.

While libmagic increases the detection rate, it also adds many false positive. A nice effect of using libmagic is the detection of text files and scripts.

Memory page flags

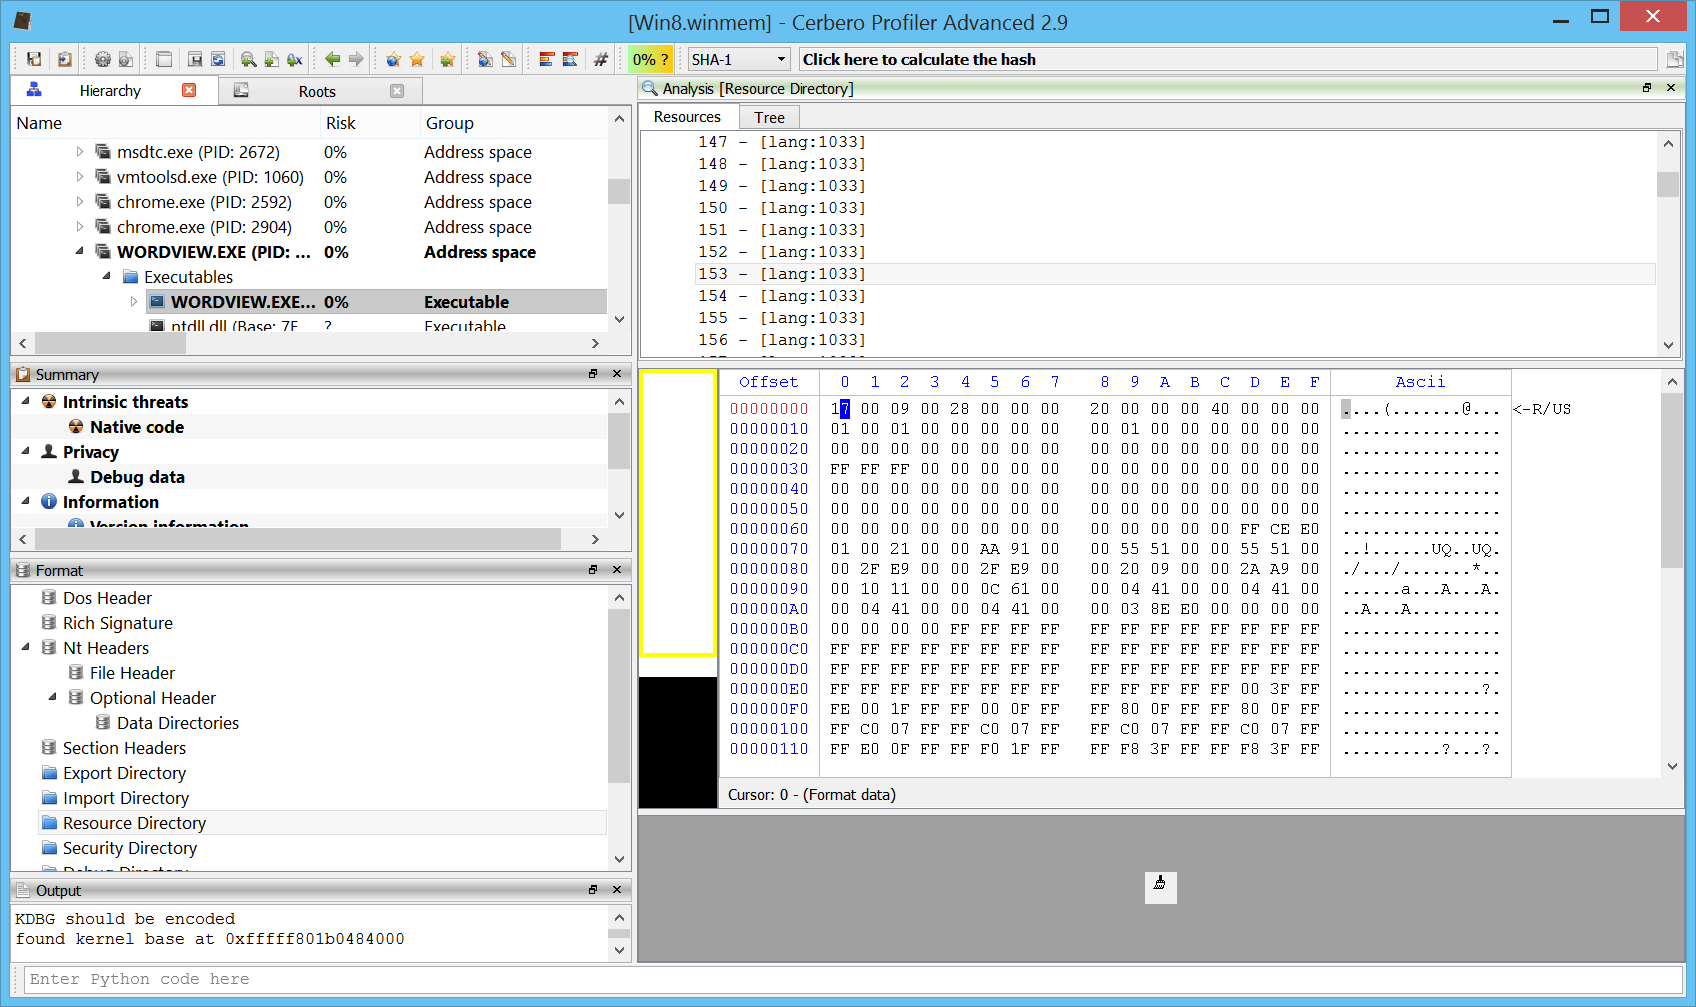
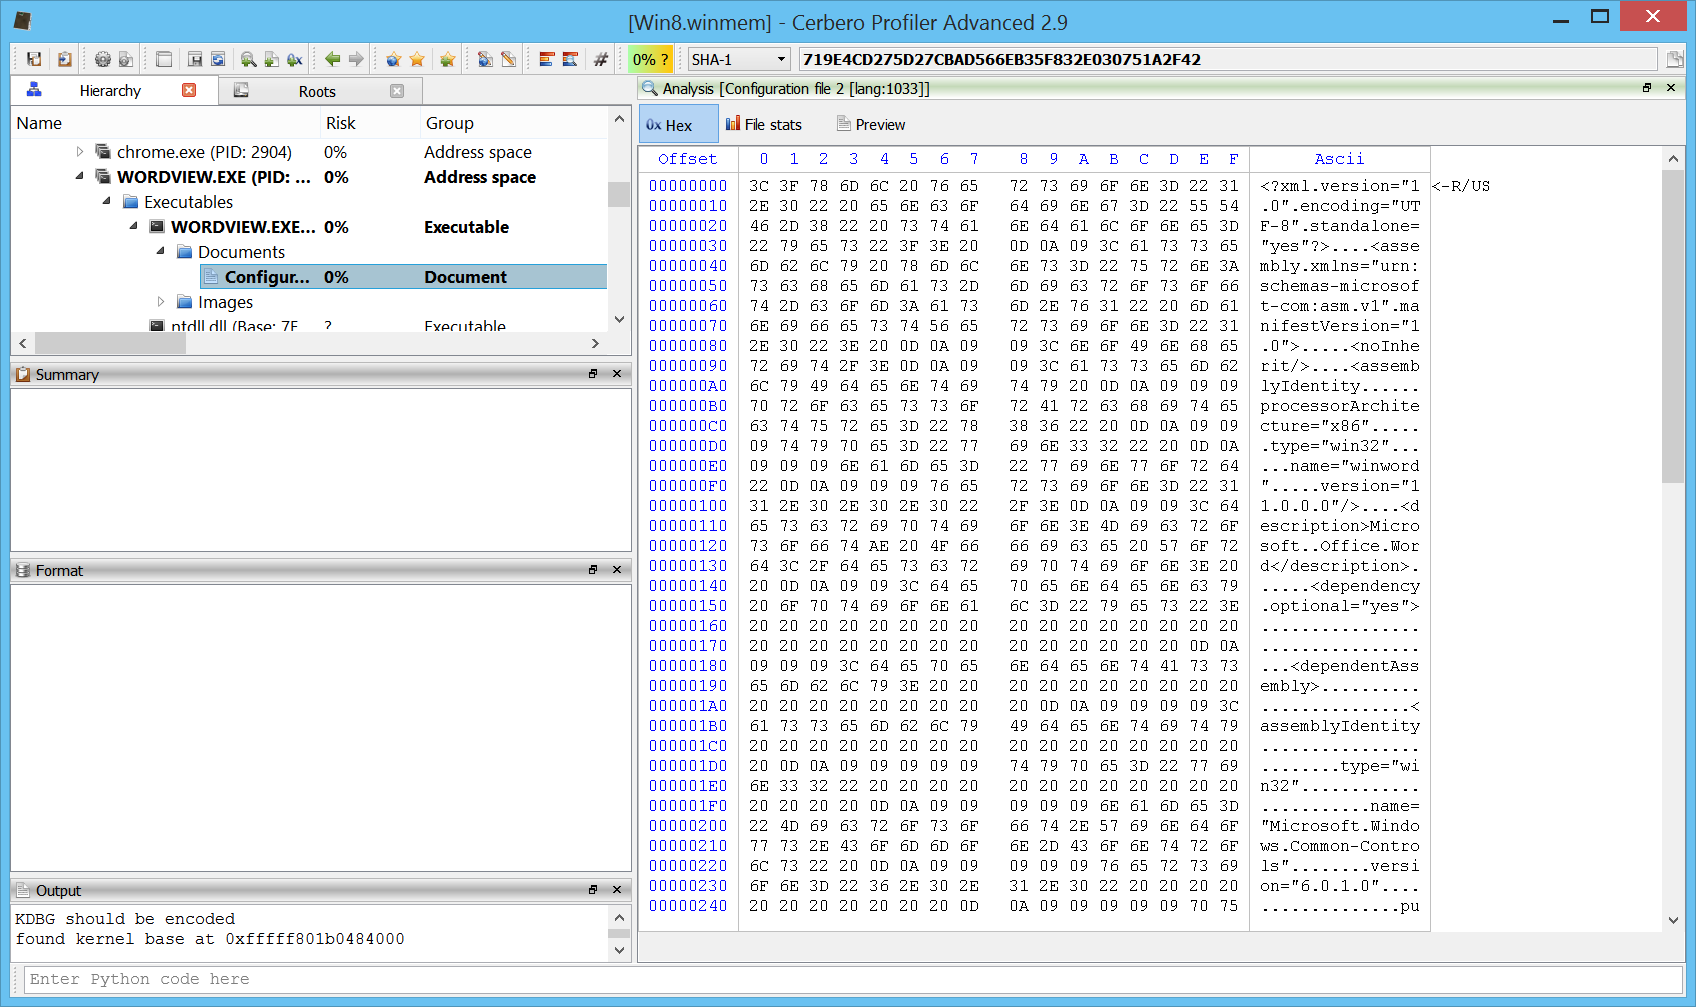
Page flags are now visible in the hex view for memory images. Not only when viewing the main address space of a process, but also when opening a mapped file.

Or the structures of a mapped file.

Or any children or resource of a mapped file.

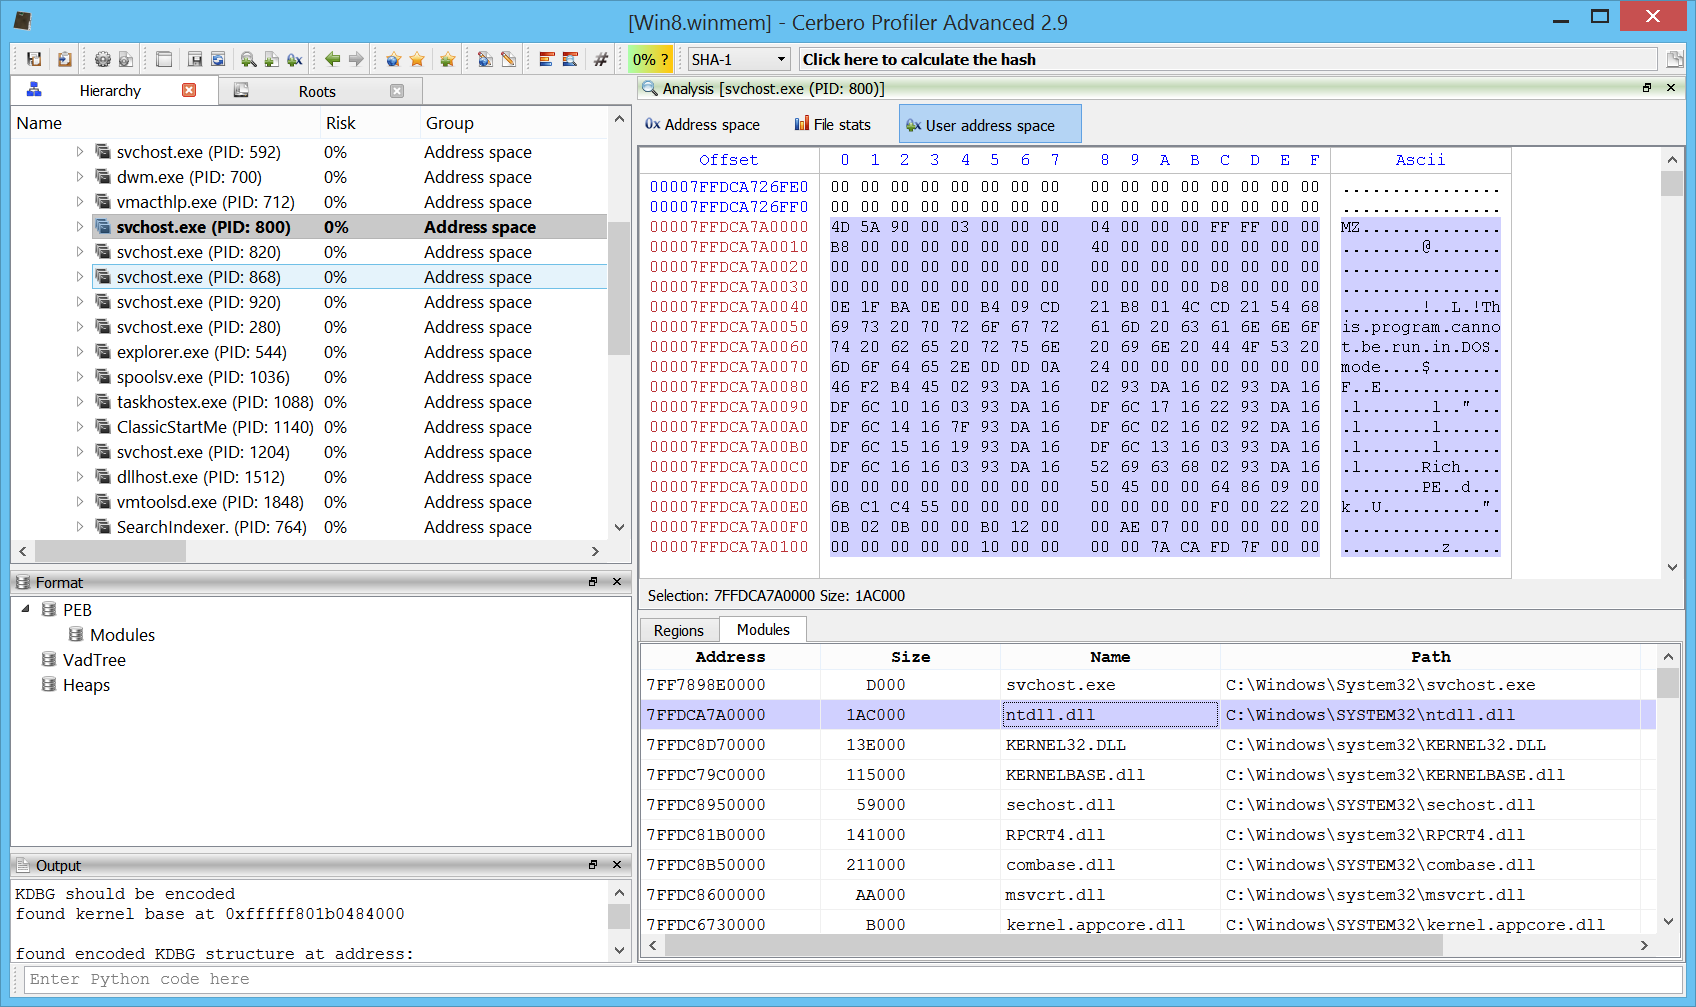
Improved user space view

The user space view for every process now shows also the list of mapped modules.

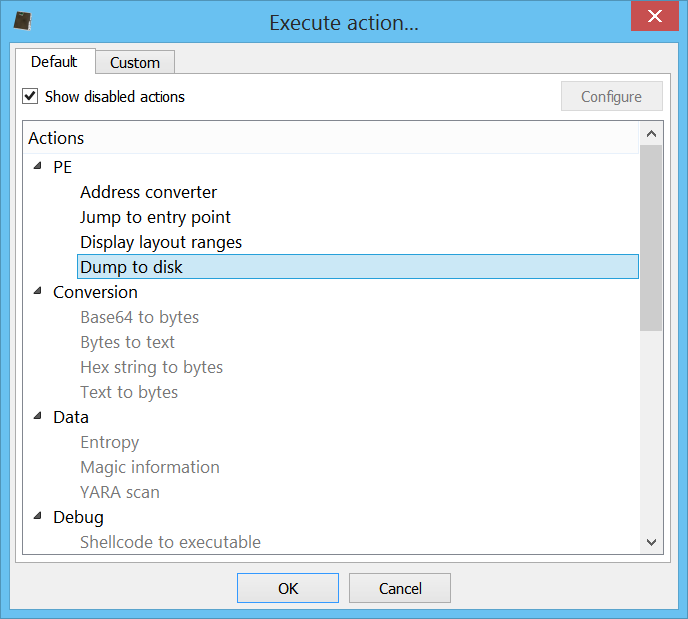
Dump PE to disk

When inspecting a memory mapped executable, we can now dump the file to disk and Profiler will take care of adjusting the PE header in order to be able to inspect the file using external tools as well.

XML fault tolerance

The XML parser has been improved to handle incorrect XML files. This is especially important when handling PDF malware which contains malformed XDP data.

CCITTFax decoder

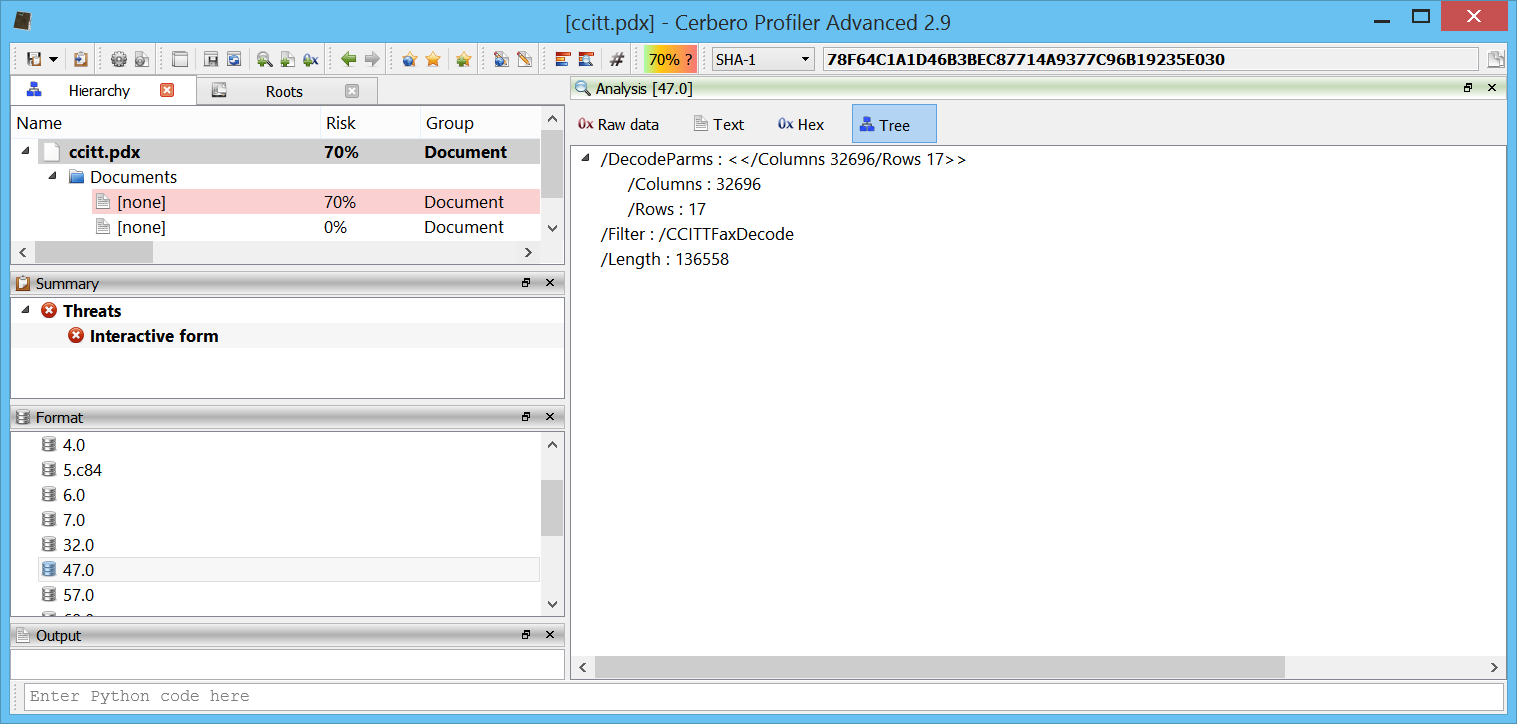
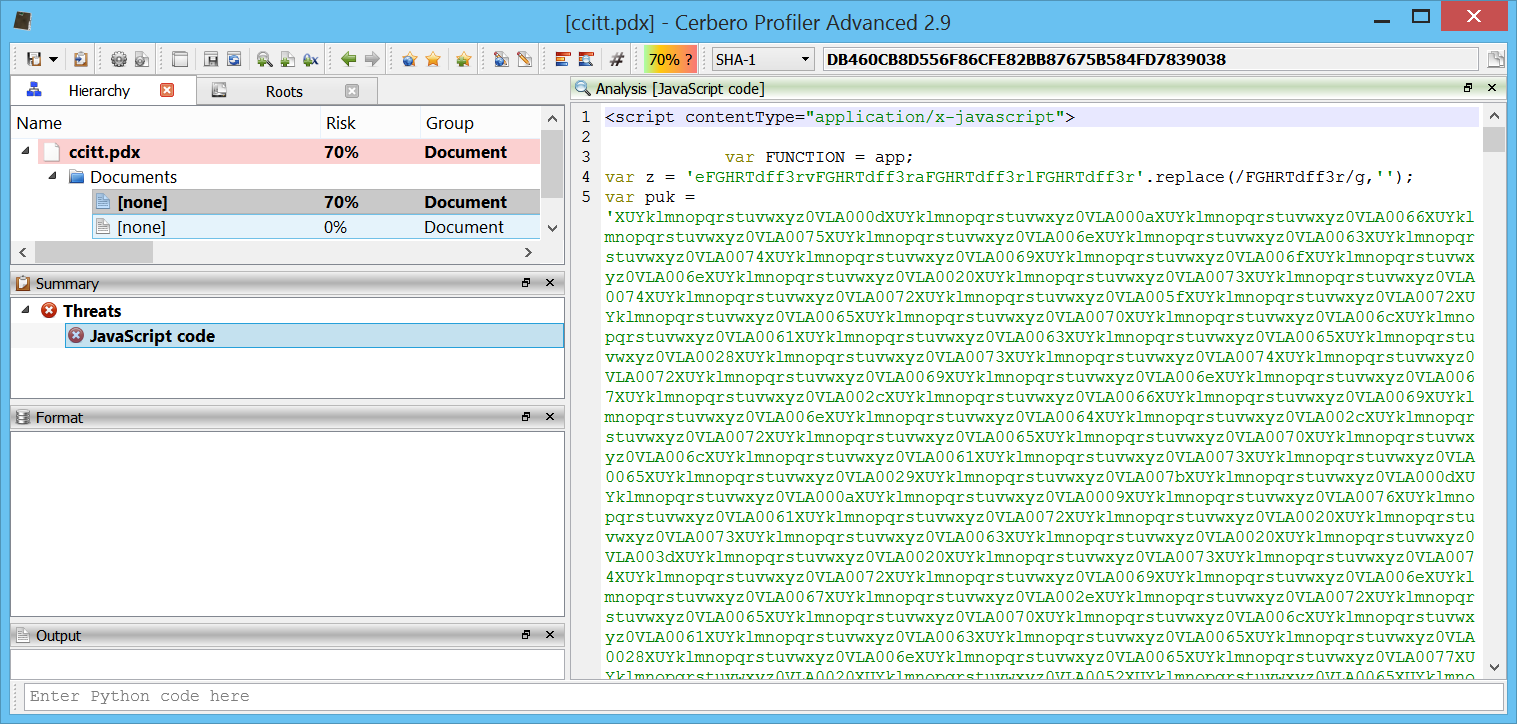
Yet another decoder has been added to our PDF support. Here we can see a malware sample using this codec to conceal some JavaScript code.

64-bit shellcode to executable

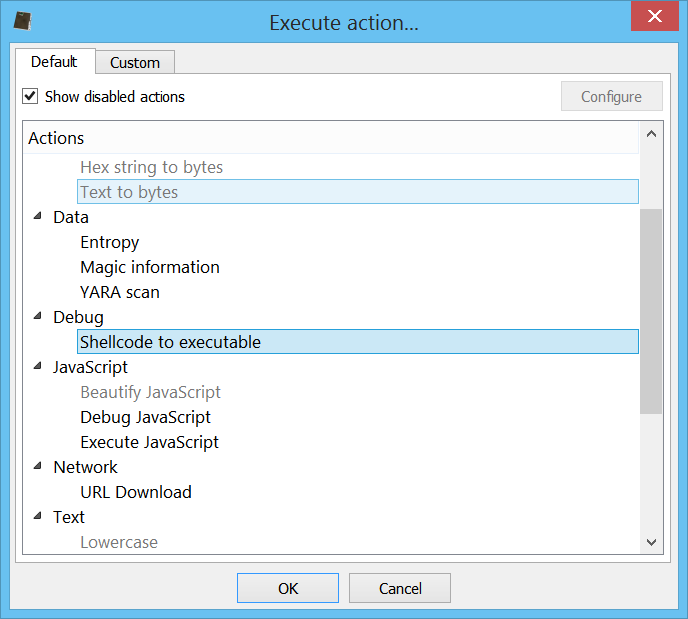
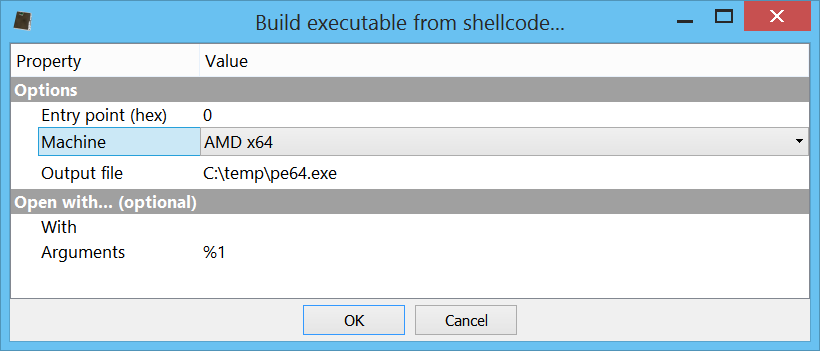
It is now possible to convert x64 shellcode to executable. In the past this feature was limited to x86 shellcode.

To handle x64 shellcode it is necessary to specify “AMD x64” as Machine.

Text modification actions

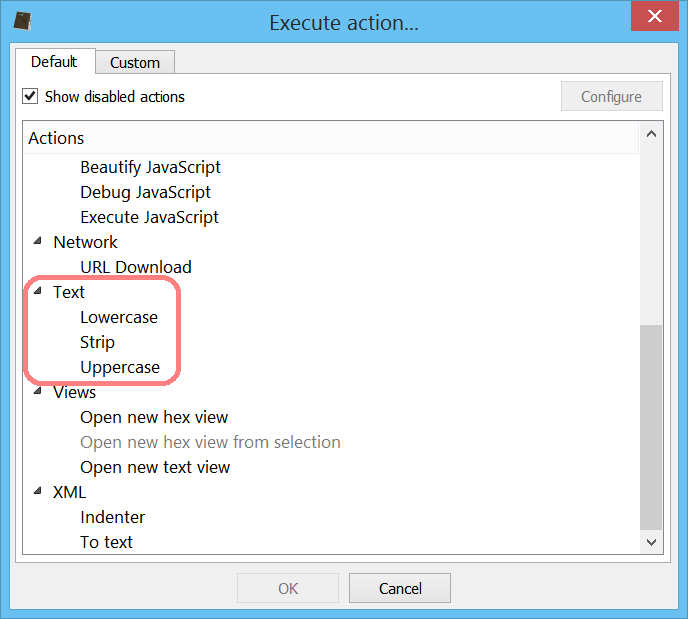
When being in the context of a text editor, we can now use text actions to do some basic text operations like converting text to lowercase or uppercase or removing spaces.

Enjoy!

Heap & File Carving

Along with the newly released 2.9 version of Profiler Advanced, we have improved support for memory images.

Before going into the main topics of this post, it is worth mentioning that loading and scanning times have been drastically improved for memory images. Apart from the important internal optimizations, the user is now given the choice of scanning or not the files in memory.

If the user chooses not to scan the files in memory right away (they are still scanned once individually opened in the UI), the loading process of the memory image takes only a few seconds if that.

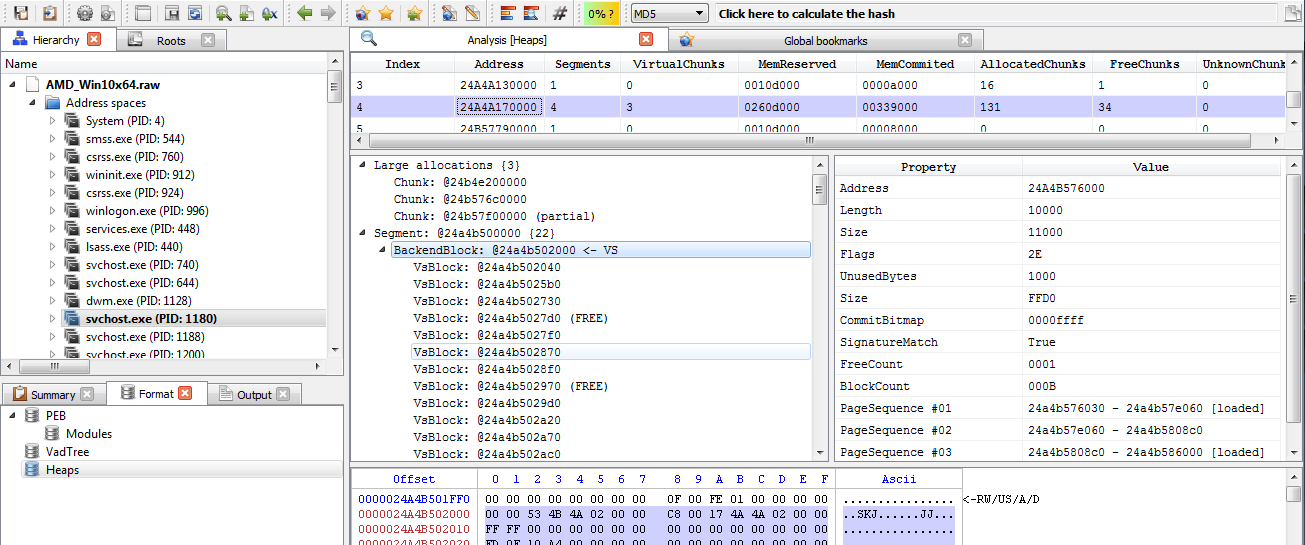
One of the main news in 2.9 is the support for heap parsing for all Windows versions from Windows XP to Windows 10. The only limitation is that we don’t yet support the new heap type found in Metro/Modern applications. This new type of heap can also be found in certain Windows 10 processes such as: smss.exe, csrss.exe, services.exe, lsass.exe, svchost.exe, MicrosoftEdgeC, etc.

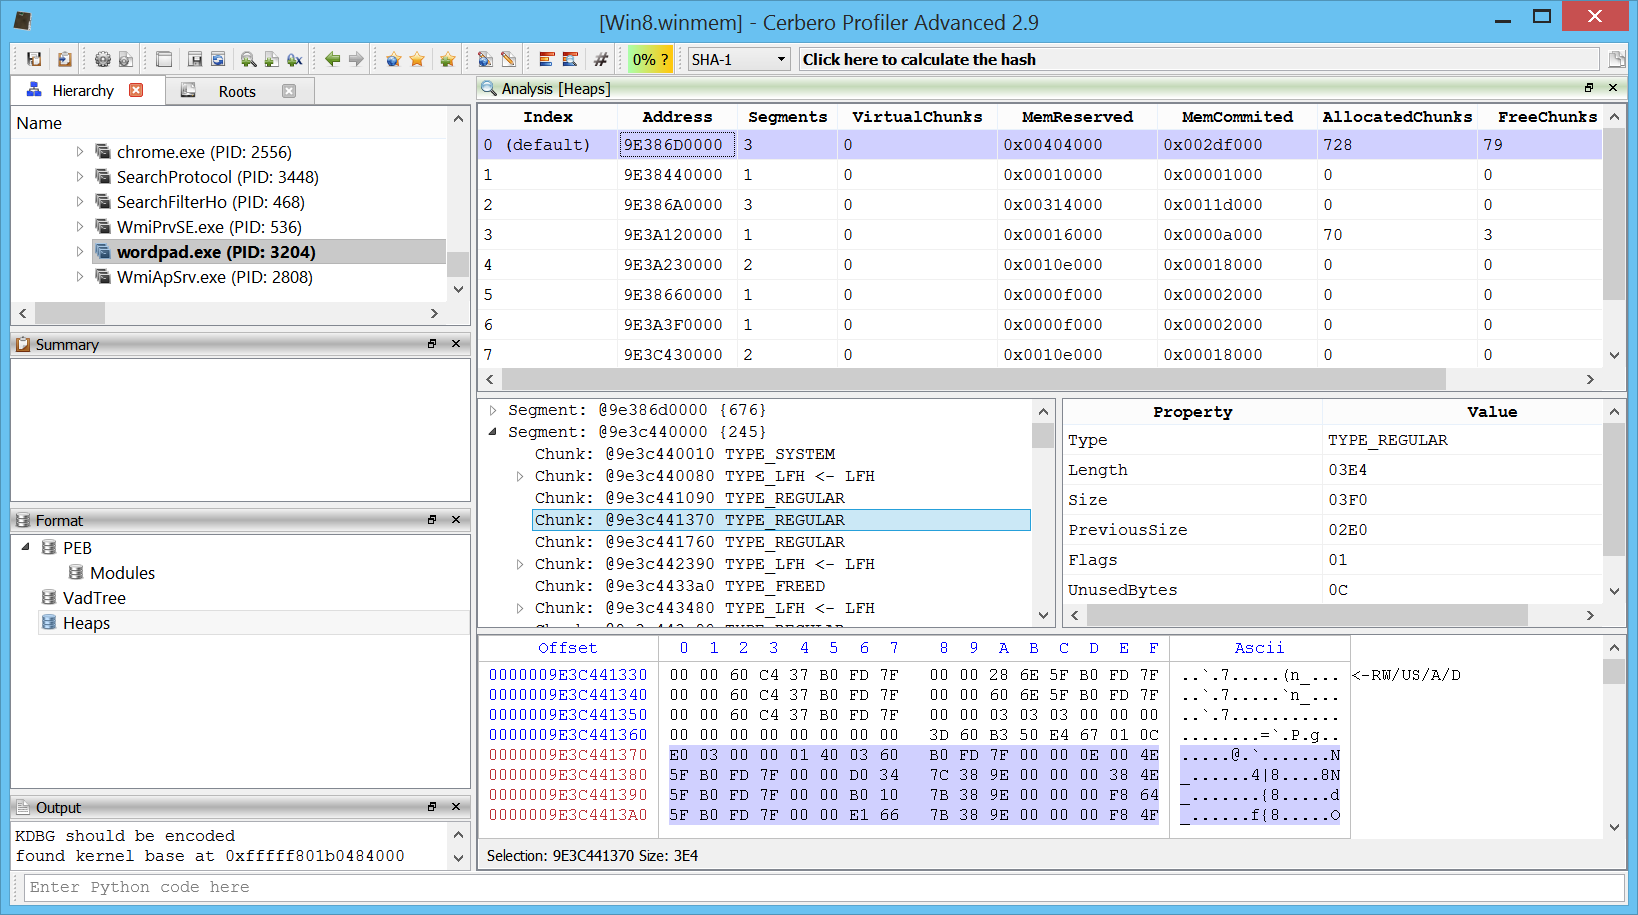
The heap of every process can be inspected in the UI.

It’s not trivial to parse a heap which might also be corrupted because of paged out memory regions. We put effort into parsing what is available.

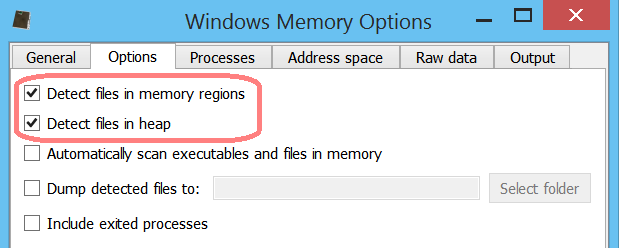
You might wonder why the effort of parsing the heap in the first place. The main reason was due to a new feature introduced in Profiler 2.9, namely file identification in memory regions. Since we anyway wanted to identify files loaded in memory regions, we thought it was a good idea to try to identify files in the heap as well. Hence, the user can now enable file identification in memory regions and heap.

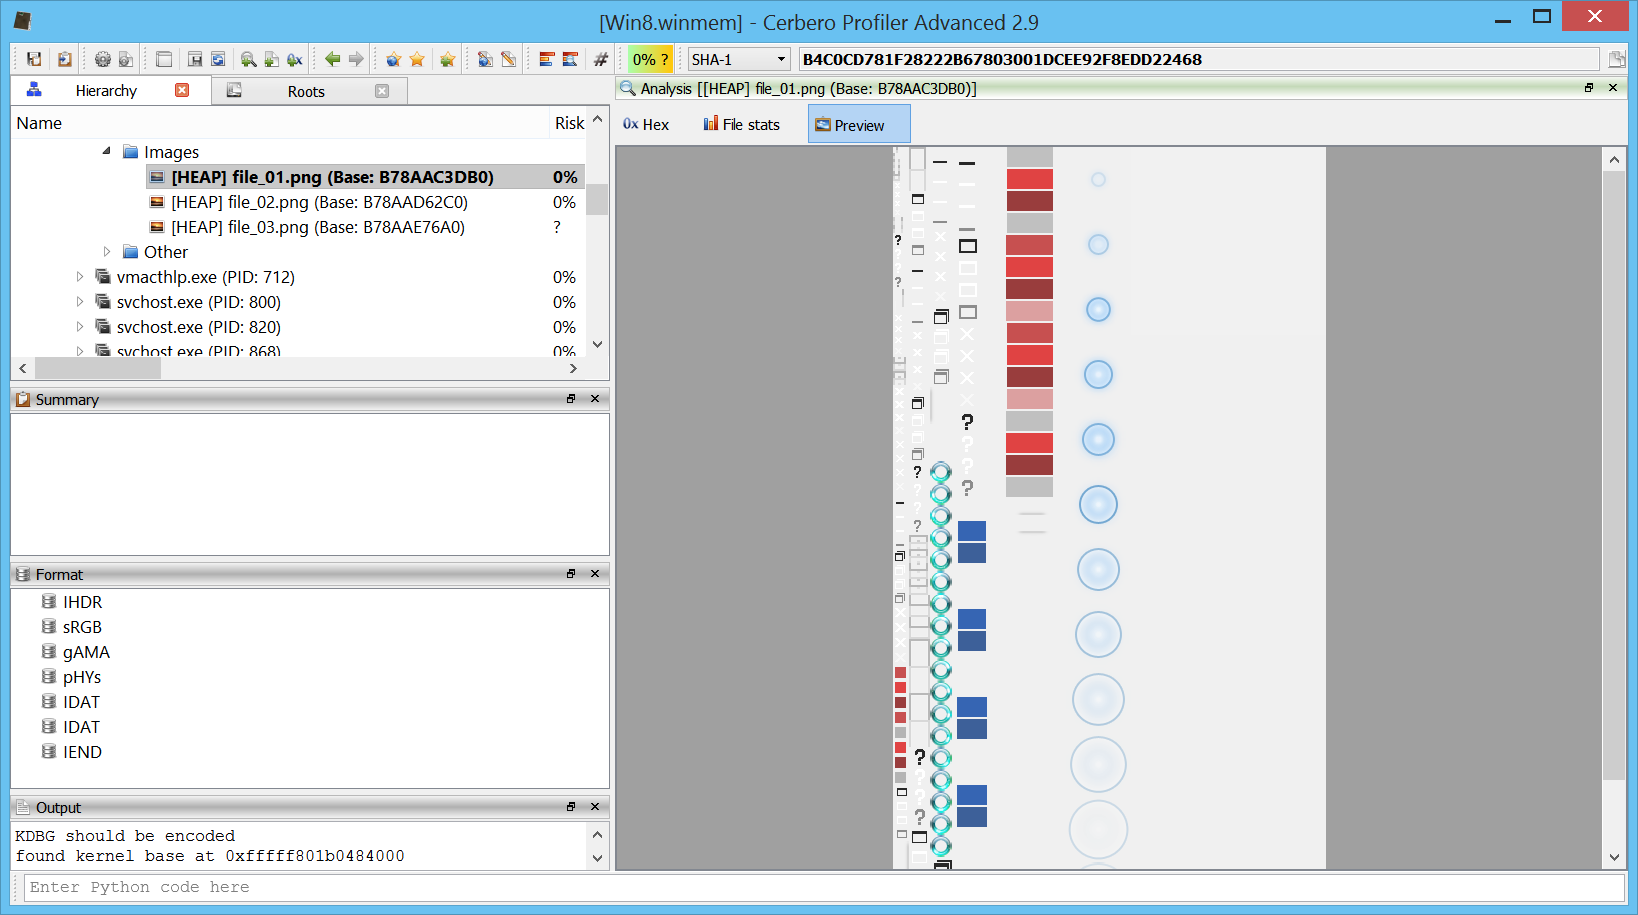
Of course, the user can inspect all the identified files in the UI. This for instance is an image found in the heap of the dwm process.

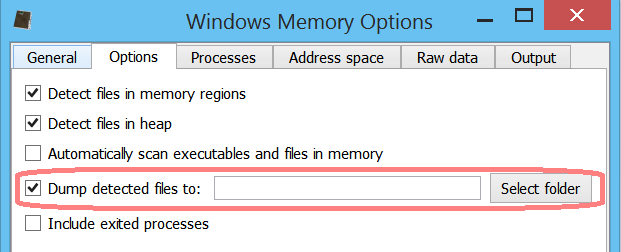
The user may also choose to dump all identified files to a specific folder.

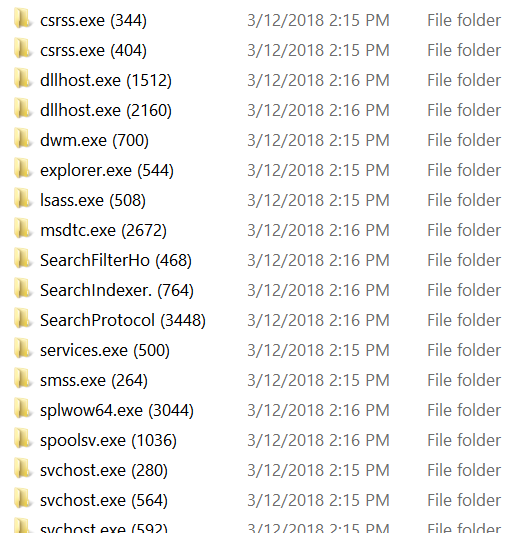
The dump output is divided into directories, one for each process.

Each process contains one or all of the following directories and an info.txt file.

The info.txt file contains a list of dumped files and their respective names in the Profiler UI, along with possible errors:

OK: "WORDVIEW.EXE (Base: 30000000)" => "Modules64\base_30000000_WORDVIEW.EXE"
OK: "ntdll.dll (Base: 7FFDCA7A0000)" => "Modules64\base_7ffdca7a0000_ntdll.dll"
OK: "version.dll (Base: 747F0000)" => "Modules32\base_747f0000_version.dll"
OK: "comctl32.dll (Base: 71C30000)" => "Modules32\base_71c30000_comctl32.dll"
OK: "MSO.DLL (Base: 6B880000)" => "Modules32\base_6b880000_MSO.DLL"
OK: "msimg32.dll (Base: 6B3A0000)" => "Modules32\base_6b3a0000_msimg32.dll"
OK: "MSOHEV.DLL (Base: 325C0000)" => "Modules32\base_325c0000_MSOHEV.DLL"
OK: "GDIPLUS.DLL (Base: 6B1F0000)" => "Modules32\base_6b1f0000_GDIPLUS.DLL"
OK: "RICHED20.DLL (Base: 6B3F0000)" => "Modules32\base_6b3f0000_RICHED20.DLL"
OK: "sti.dll (Base: 6B3B0000)" => "Modules32\base_6b3b0000_sti.dll"
OK: "msi.dll (Base: 6B500000)" => "Modules32\base_6b500000_msi.dll"
BadFormat: "propsys.dll (Base: 71360000)" => "Modules32\base_71360000_propsys.dll"
OK: "winspool.drv (Base: 6EA40000)" => "Modules32\base_6ea40000_winspool.drv"
BadFormat: "winsta.dll (Base: 6E4C0000)" => "Modules32\base_6e4c0000_winsta.dll"
OK: "dwmapi.dll (Base: 71940000)" => "Modules32\base_71940000_dwmapi.dll"
OK: "srvcli.dll (Base: 71B60000)" => "Modules32\base_71b60000_srvcli.dll"
OK: "apphelp.dll (Base: 74600000)" => "Modules32\base_74600000_apphelp.dll"
OK: "wiatrace.dll (Base: 73F70000)" => "Modules32\base_73f70000_wiatrace.dll"
etc.

We’ll further improve this feature in the next time, so stay tuned!

Windows Memory Forensics: Close to Release

We’re extremely proud to announce that the upcoming 2.8 version of Profiler Advanced comes with full-fledged support for raw Windows memory images! As few of our users might remember a two years old demo about this topic. Thanks to the work of the past months of our team, we could finalize that idea into a real product.

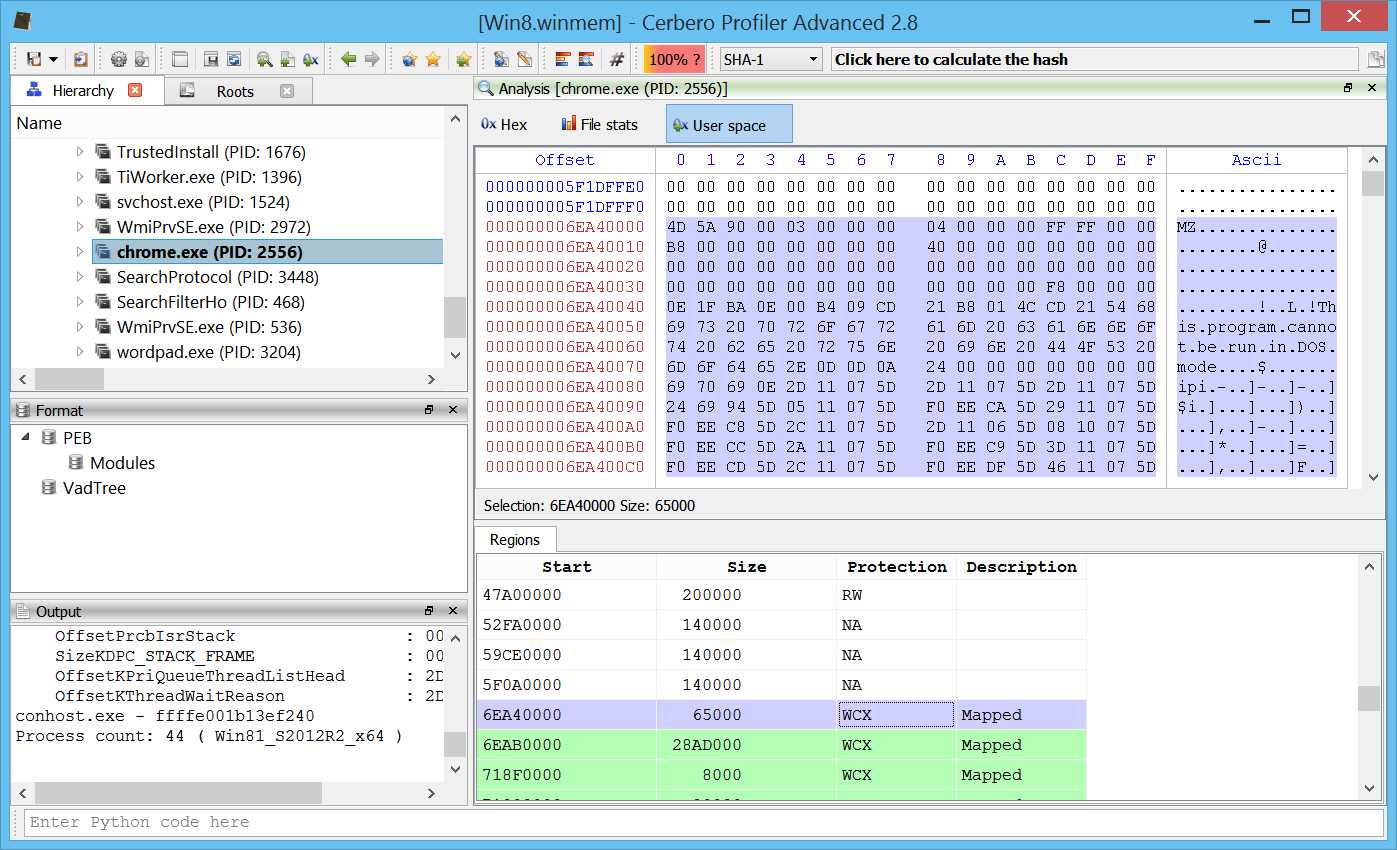
This is a hex view showing the user space regions of a process on Win8 x64.

We currently support WinXP to Win10 both x86 and x64. And, of course, the support for Windows memory forensics is available on all platforms which Profiler runs on: Windows, OS X and Linux.

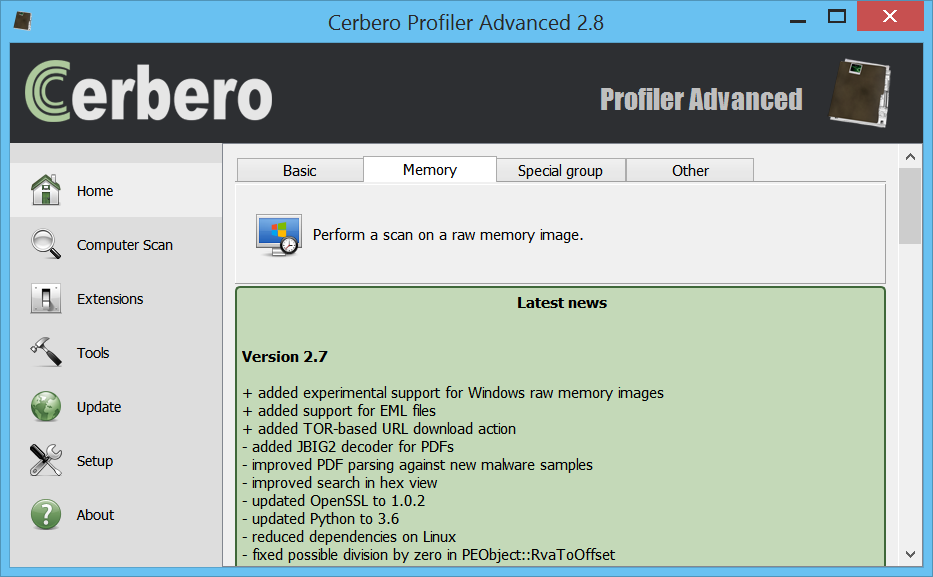
Opening and exploring a raw memory image in Profiler is extremely simple. The first step is to open the memory image from the UI.

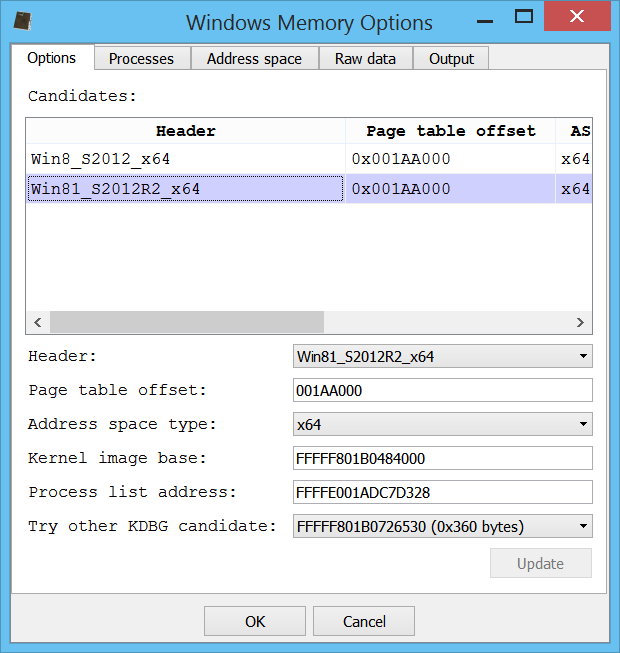
Profiler automatically tries to identify the correct Windows version and the user is presented with an options dialog, which allows modifications to the default parameters.

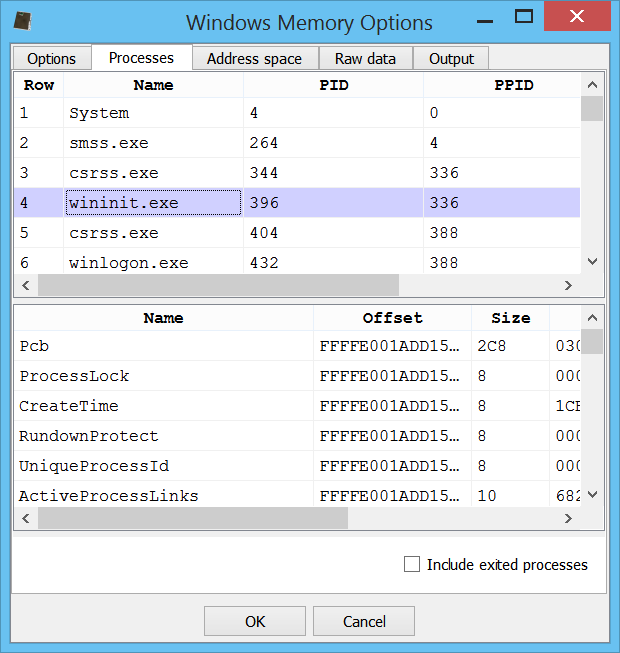
If the user decides to modify the parameters, he can verify the correctness of the results by exploring processes and other parts.

Once the users is satisfied with the configuration, he may press “OK” and let Profiler analyse the image. Once the detection and analysis of embedded modules and files is finished, the user is presented with the workspace.

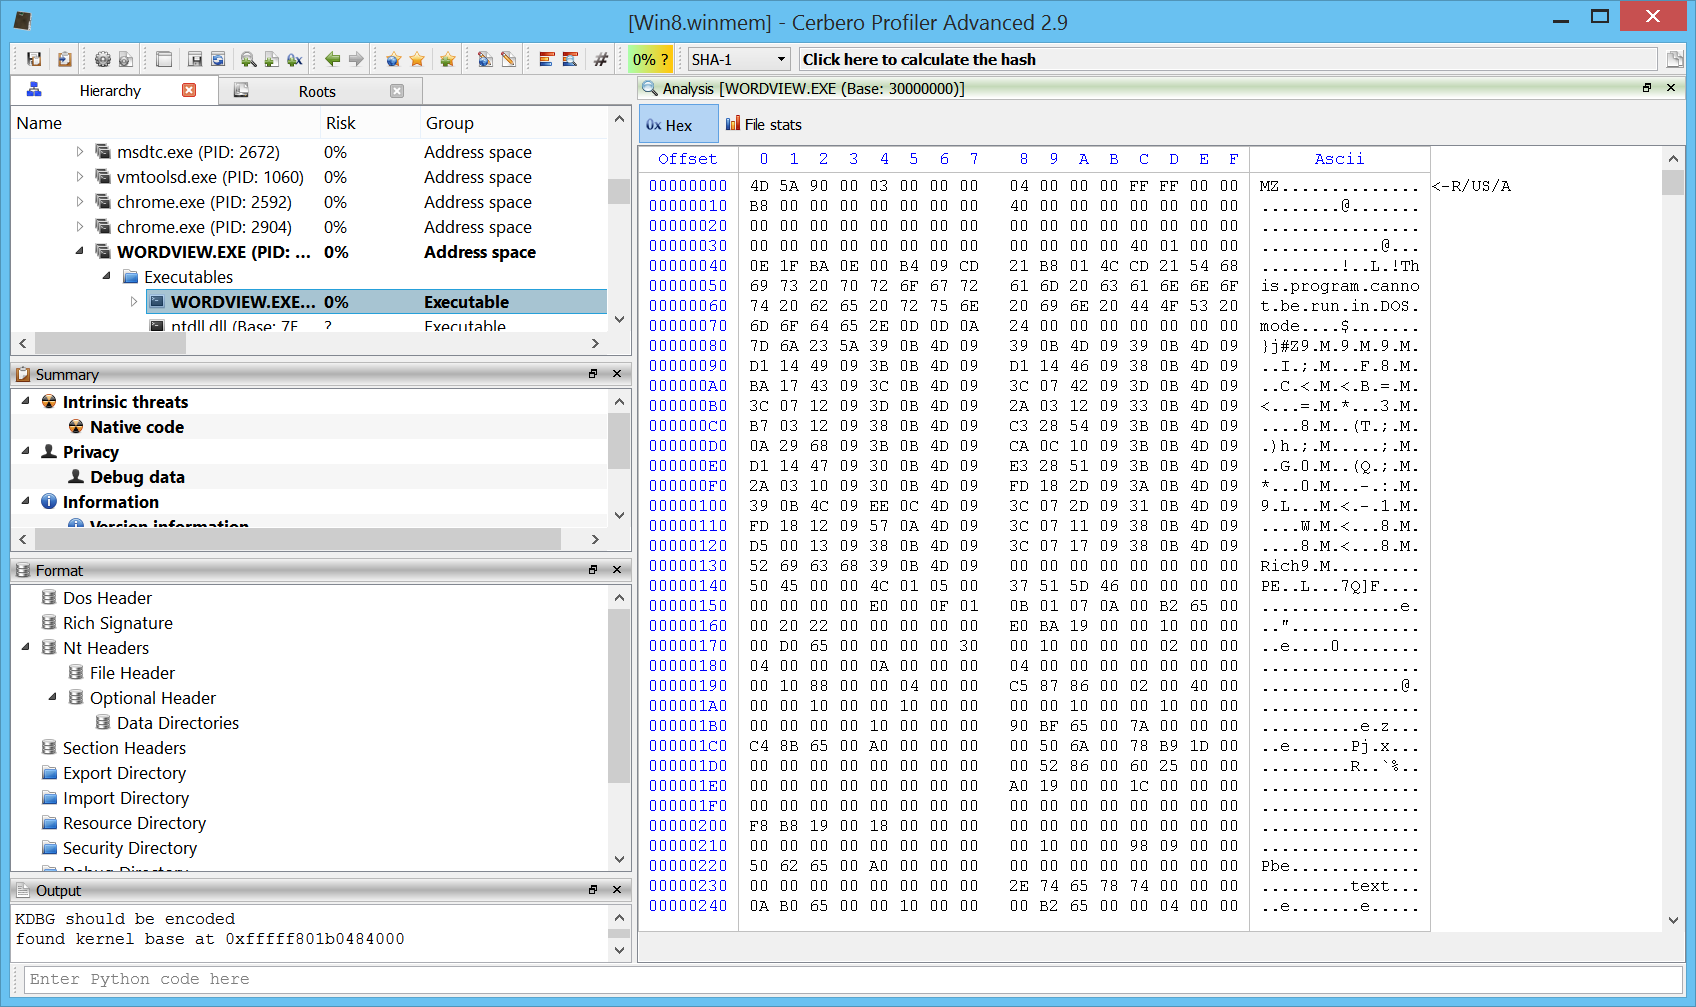
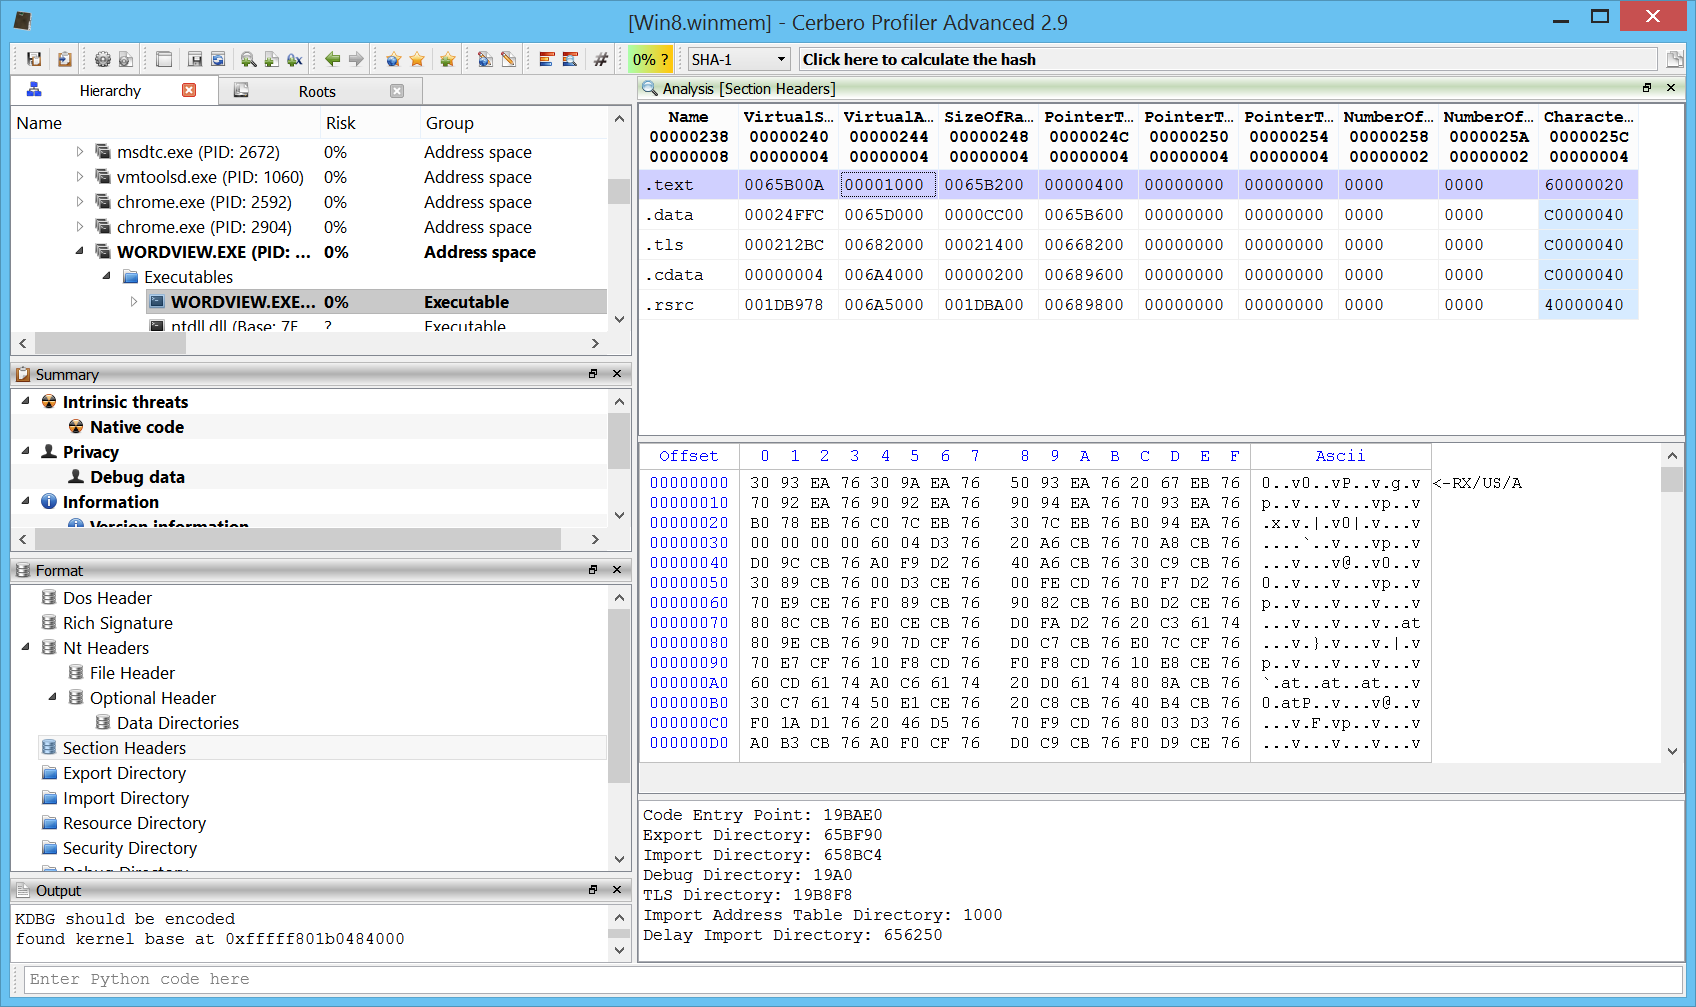
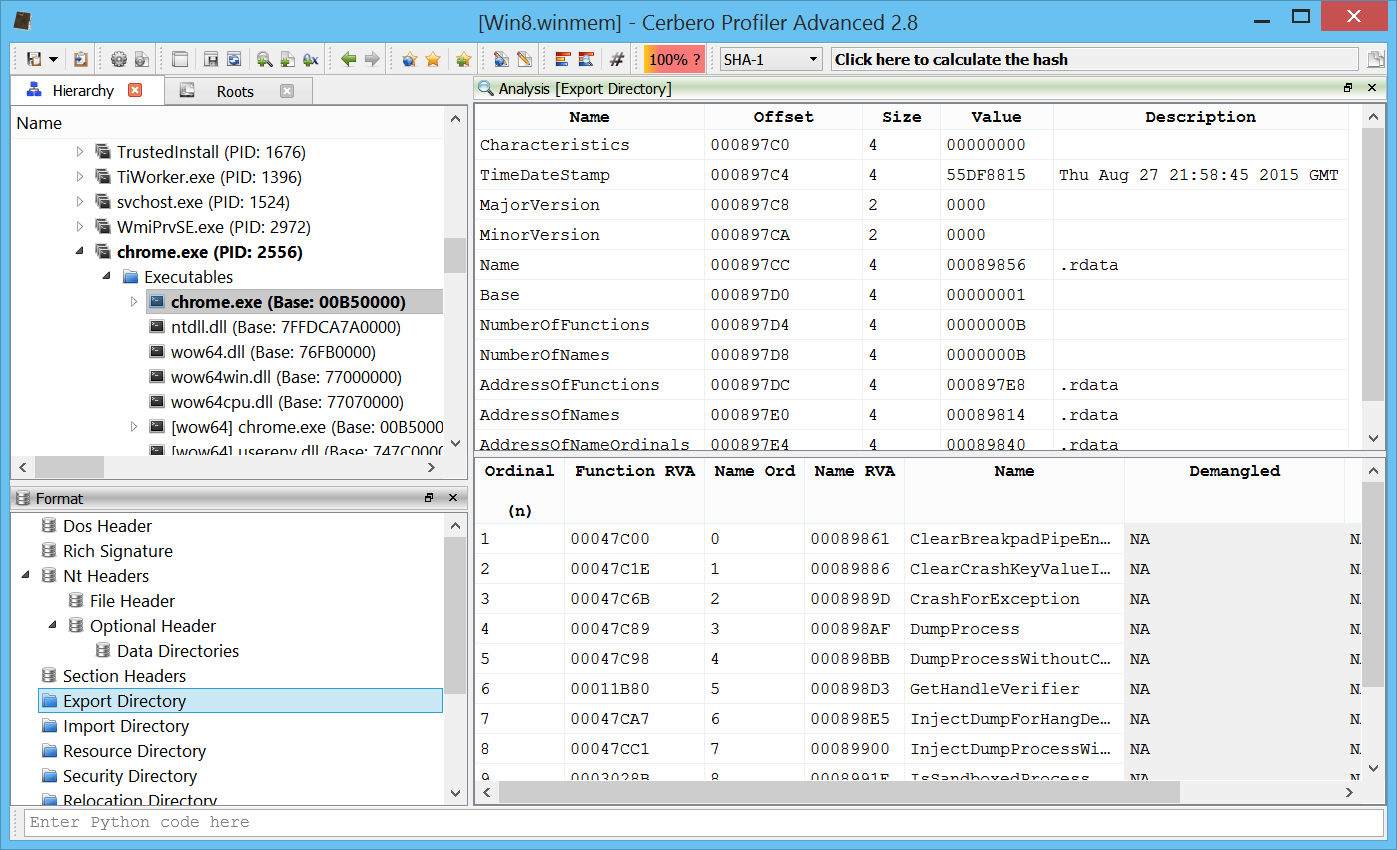
In the workspace the user can explore executables loaded in memory (Wow64 is supported).

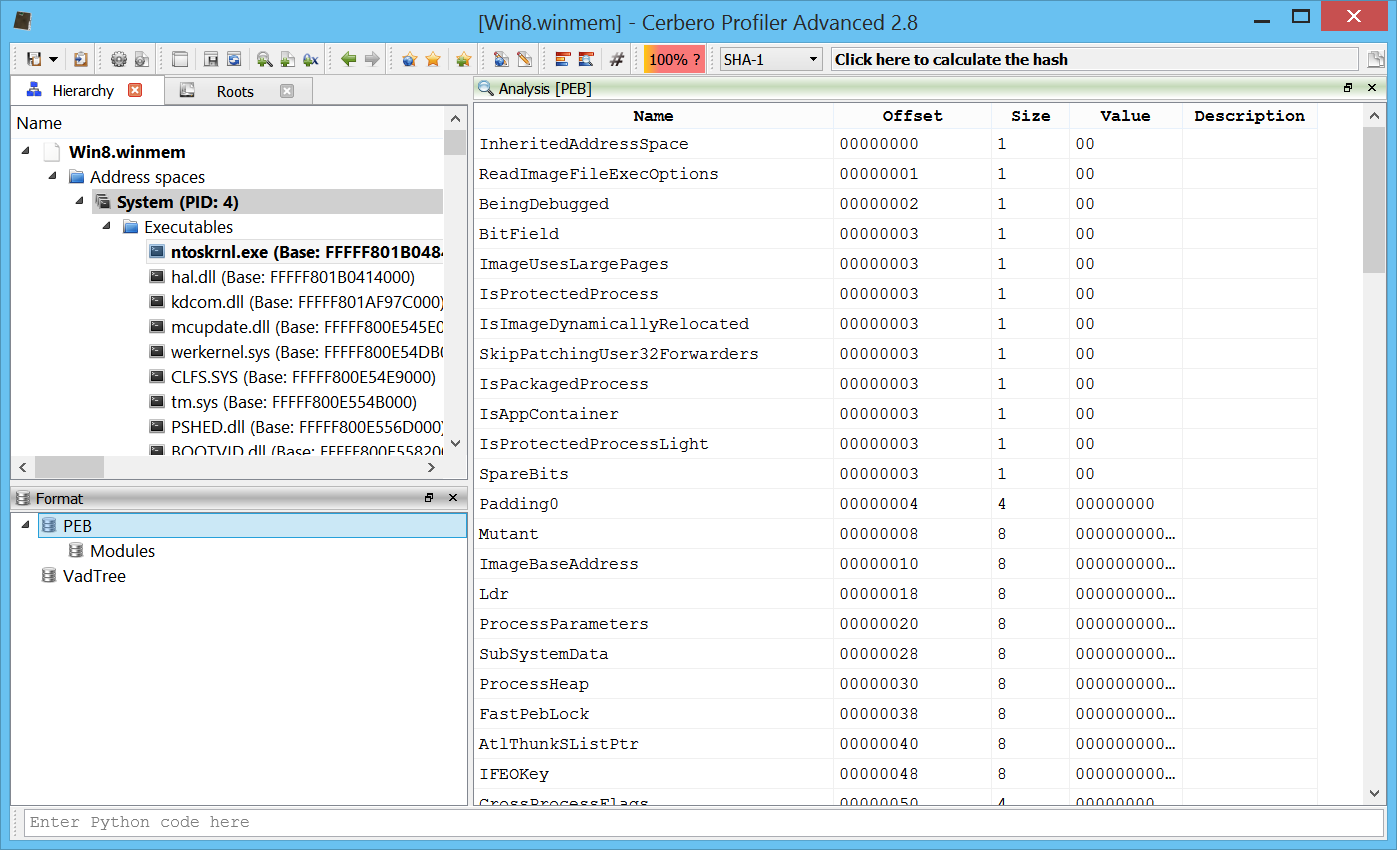
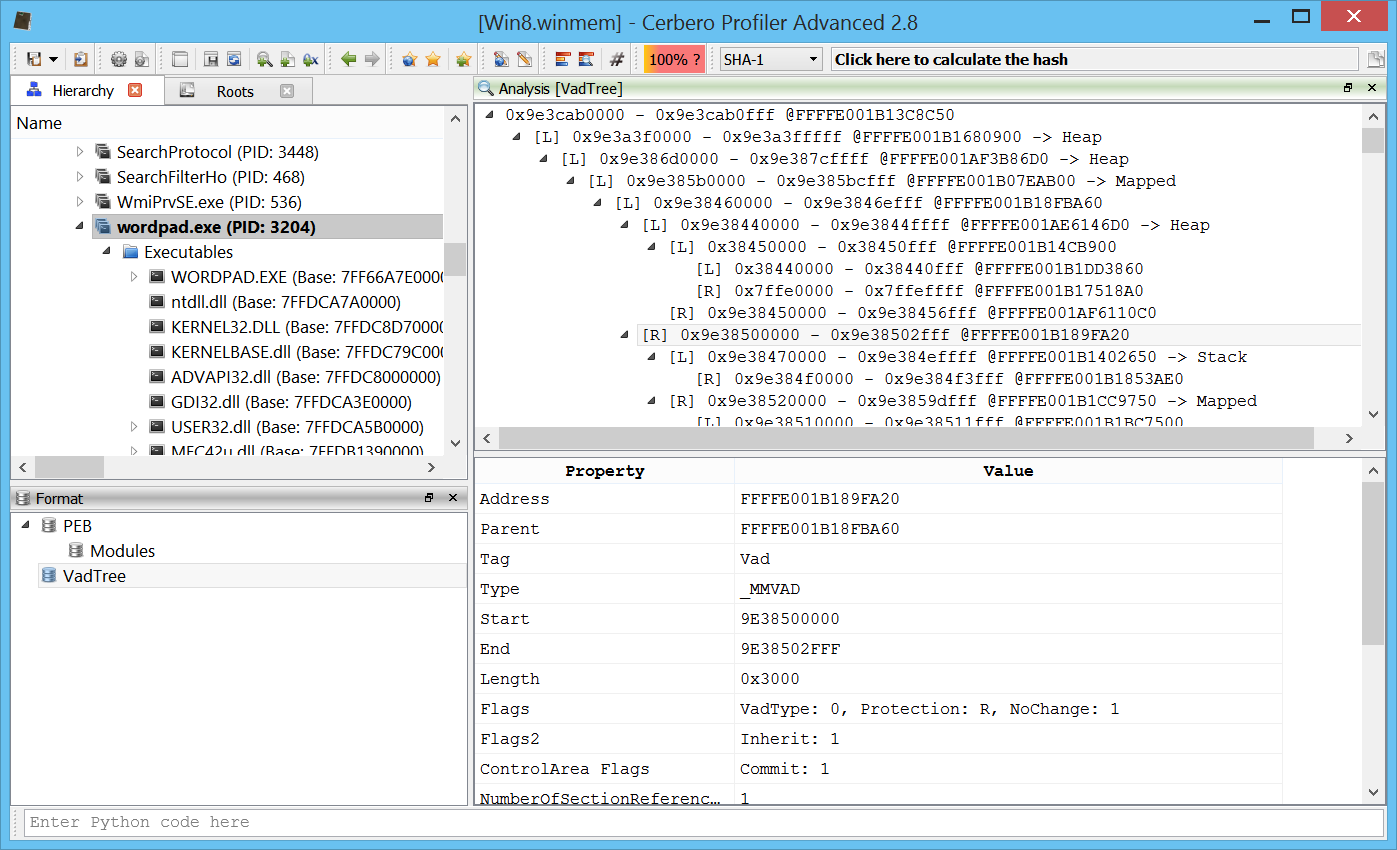
He may explore the PEB of a process.

Or its VAD tree.

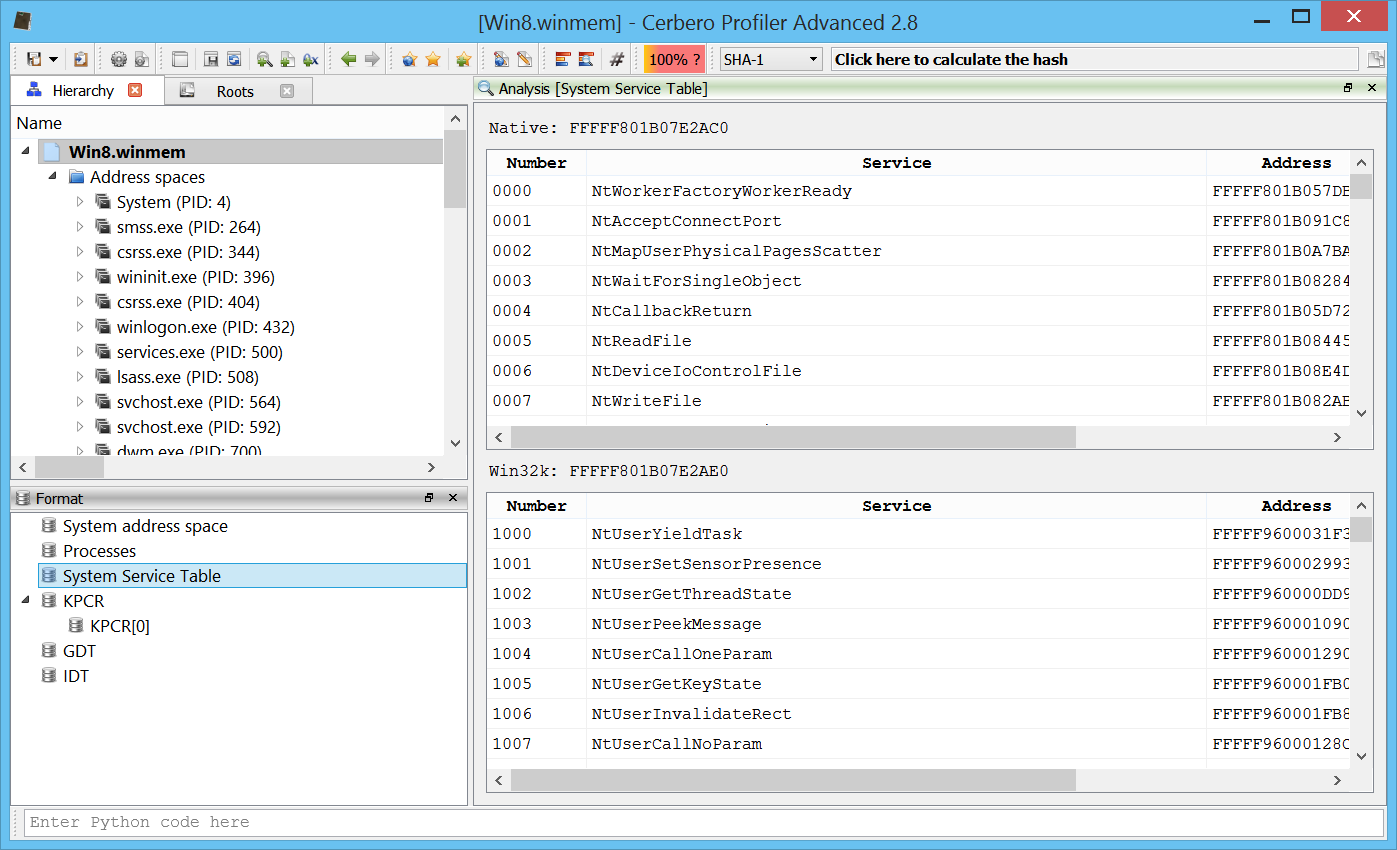
The System Service Descriptor Table (SSDT).

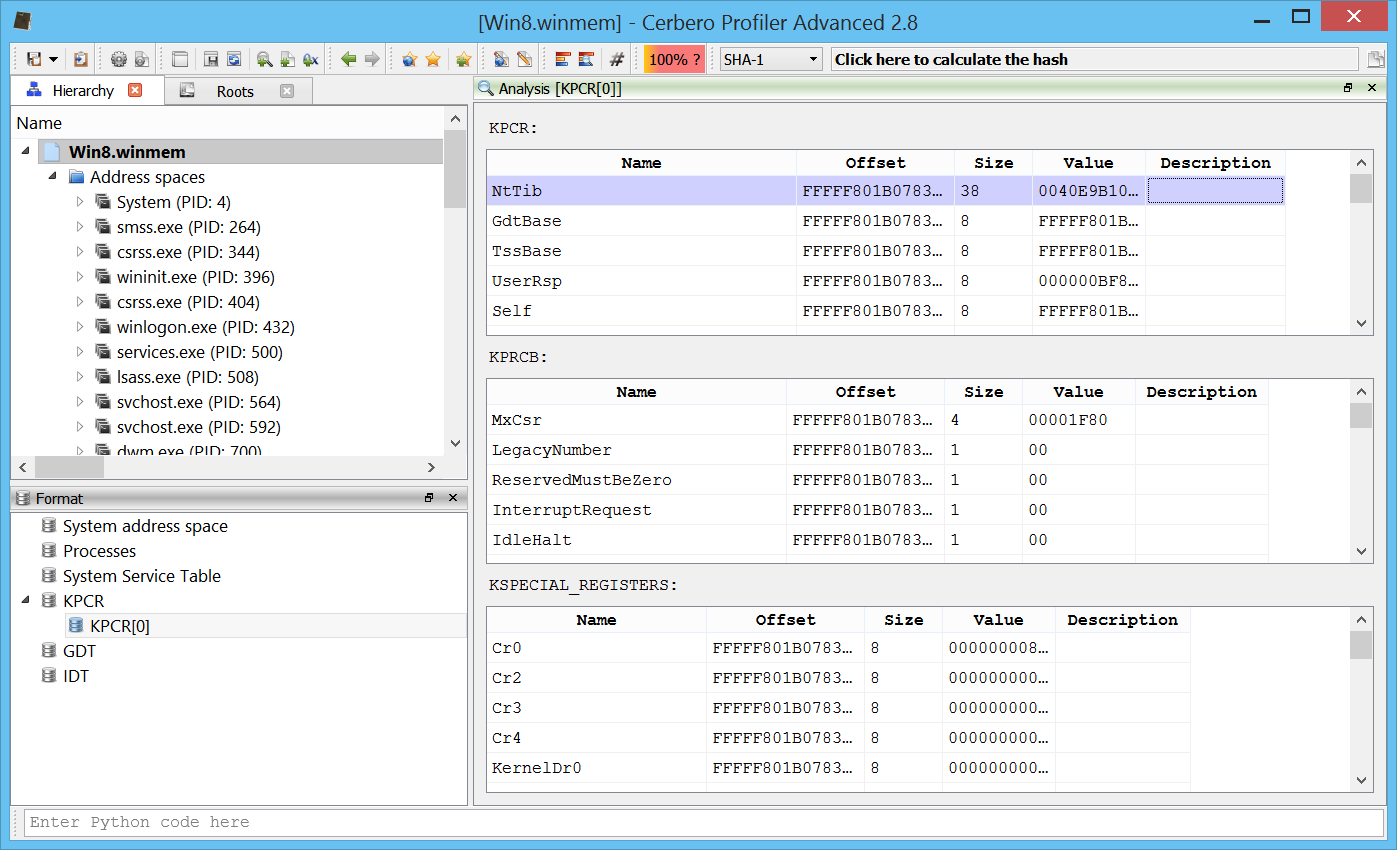
The Processor Control Block (KPRCB).

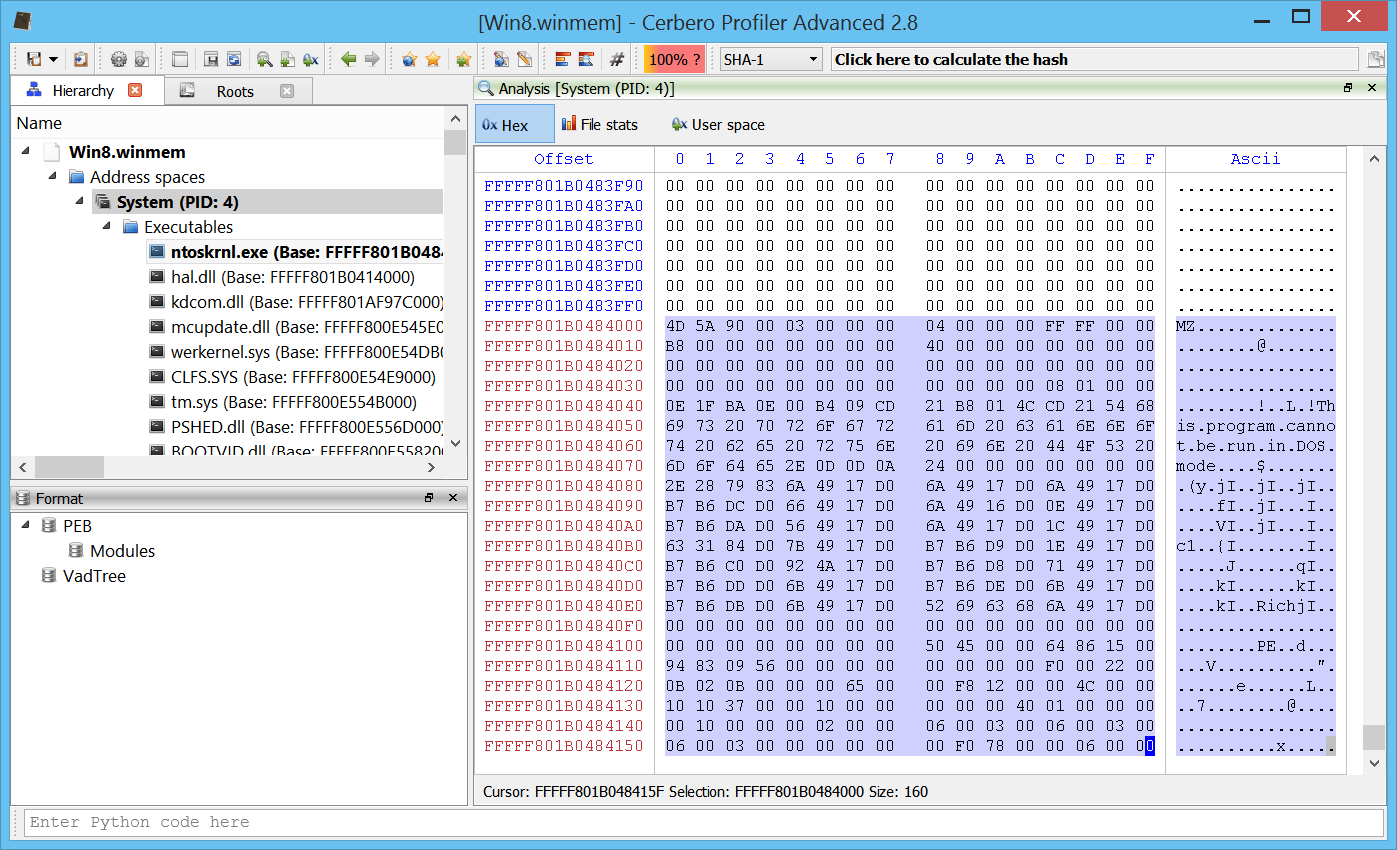
And of course explore kernel memory and drivers as well.

As usual, once the initial analysis is finished, everything can be saved into a project along with notes, bookmarks, layouts and so on. Loading a memory image from a project is immediate and saves a lot of time when analysing the same memory image multiple times.

This is just the beginning: we have many ideas and expect to release more frequently than in the past. I’m sure, we’ll be able to pleasantly surprise you!

URL Download Action (Tor)

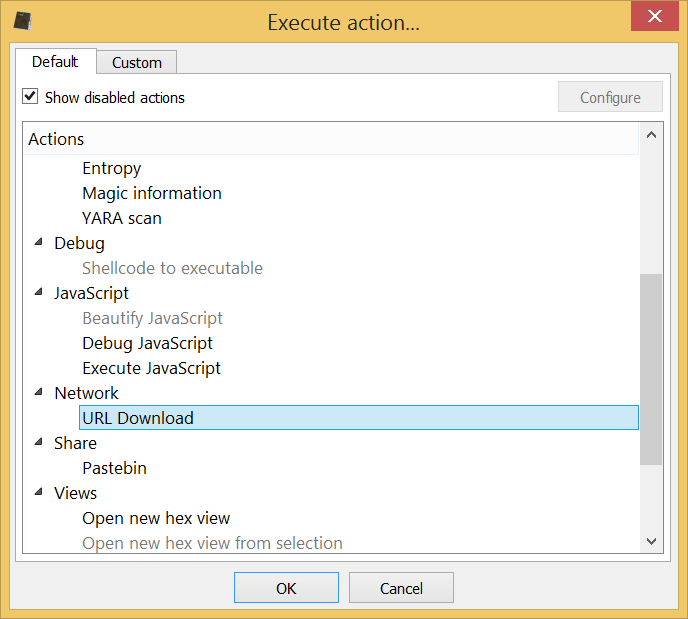
In the upcoming version of Profiler Advanced we have introduced a new useful action, namely the URL Download action.

Many times in previous posts we have analyzed some malware which at the end of its shellcode ended up downloading a binary from the internet and executing it. We thought it would be nice to give our users the possibility to anonymously download content from the internet in order to continue the analysis.

One way to download anonymously from the internet using our new action is via Tor. On Windows it’s sufficient to install and run the Tor browser.

The action will automatically try to load a possible URL from the current context, be it hex view, text editor or clipboard.

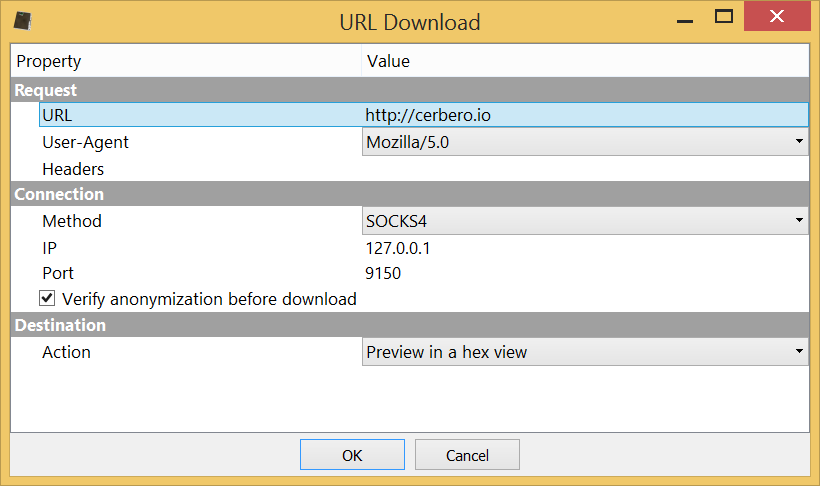
The dialog of the action offers different configuration settings: headers, user agent, download method (direct, SOCKS4, SOCKS5) along with relative parameters, anonymity check and also what to do with the downloaded content (either download it to file or preview it in a hex view).

Since we’re using Tor, we can either use the SOCKS4 or 5 method. We specify our local address and the port onto which Tor is listening for connections, in this case 9150.

The anonymity check is performed against our own https secured server: it will fetch the real IP by connecting to our server and then try to connect again via the secure method.

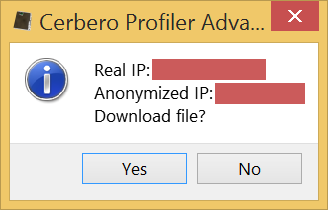
When the anonymity verification option is selected, before downloading the payload, we are asked by a message box to confirm the success of the anonymization.

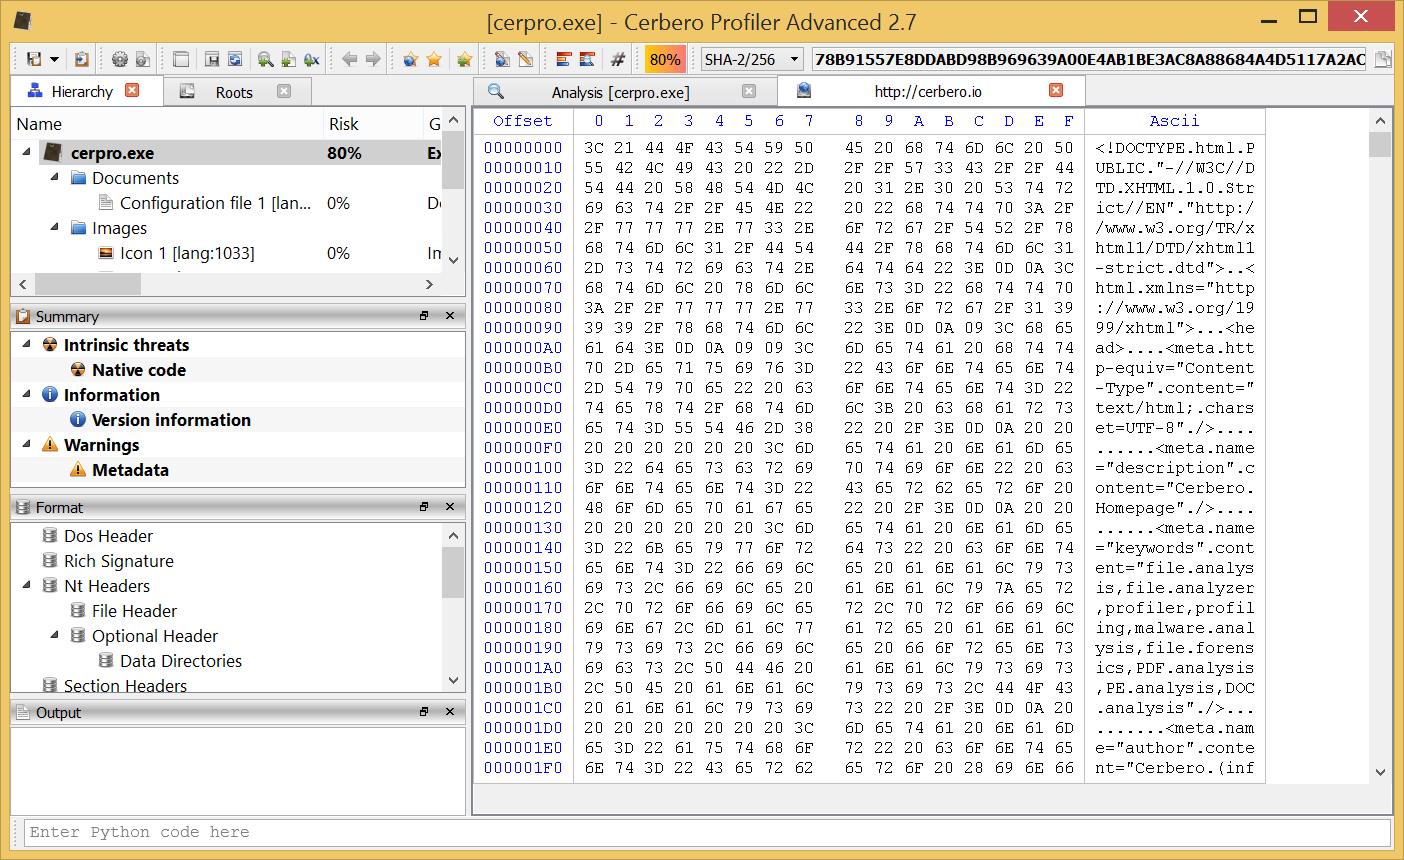
If we click on OK, Profiler will then fetch the actual payload.

If we chose to preview the content in a hex view and decide later that we want to save it on disk, we can do so by selecting all the bytes (Ctrl+A) and then copying them into a new file via the copy menu.

EML support

The upcoming 2.7 version of Profiler Advanced introduces support for the EML file format.

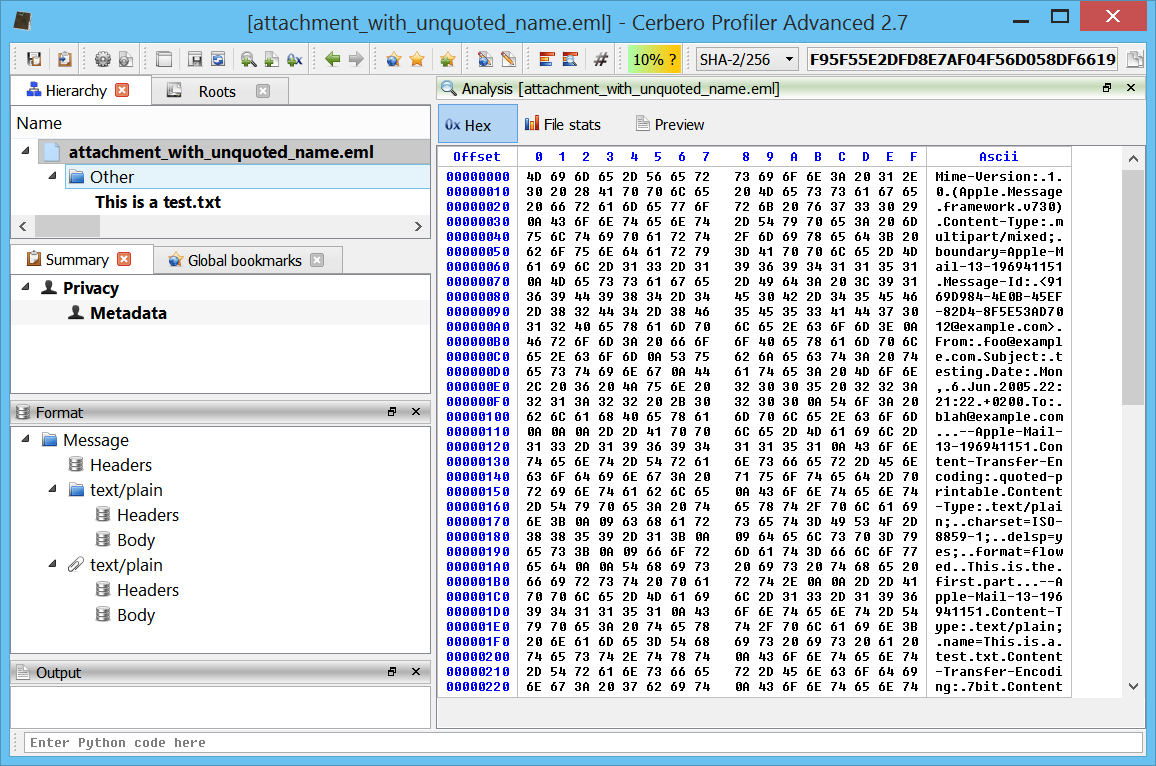
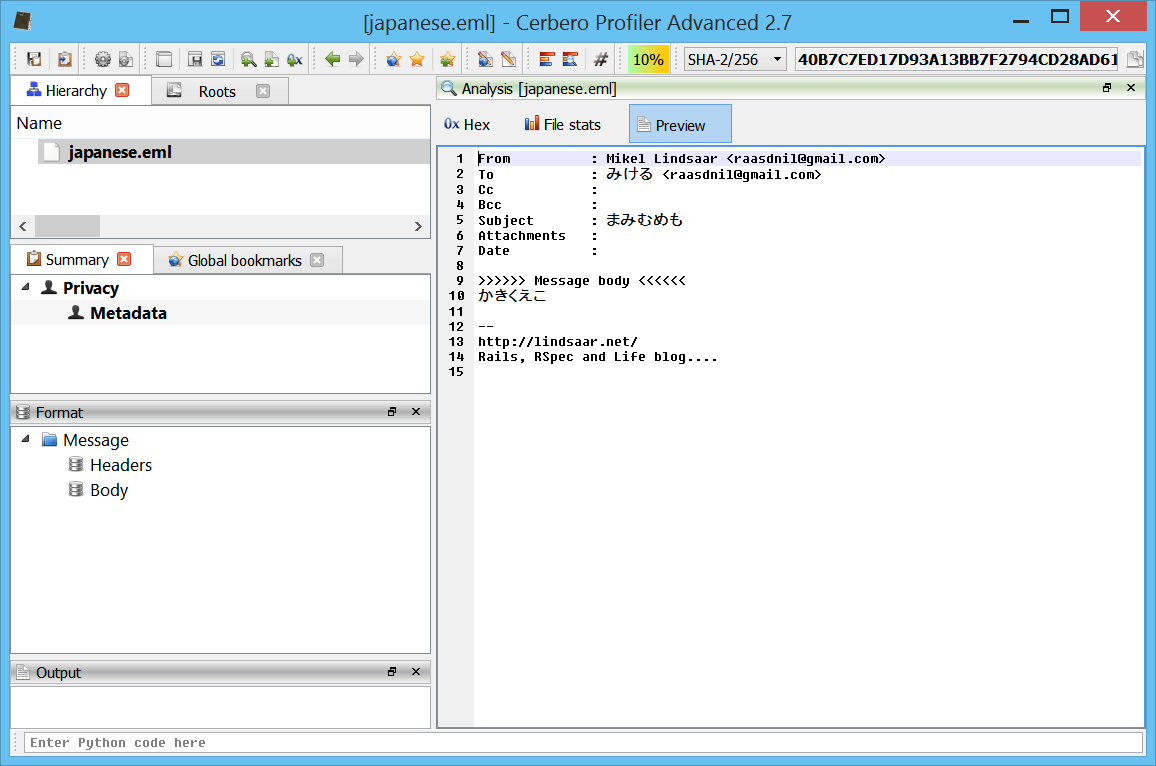
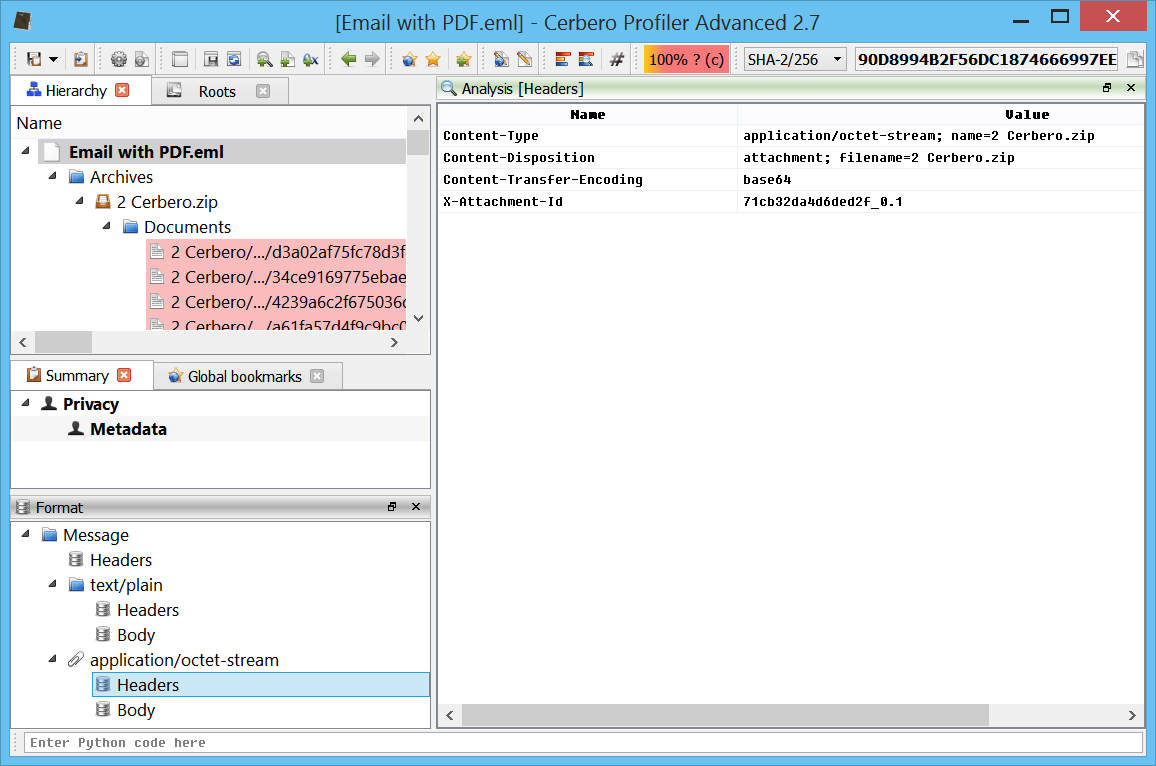
Support for EML files had until now only been present as experimental hook to extract attachments. We have now introduced full-fledged EML support and have removed the previous experimental code.

It’s possible to preview the email messages:

Inspect their file format:

And, as expected, inspect their attachments:

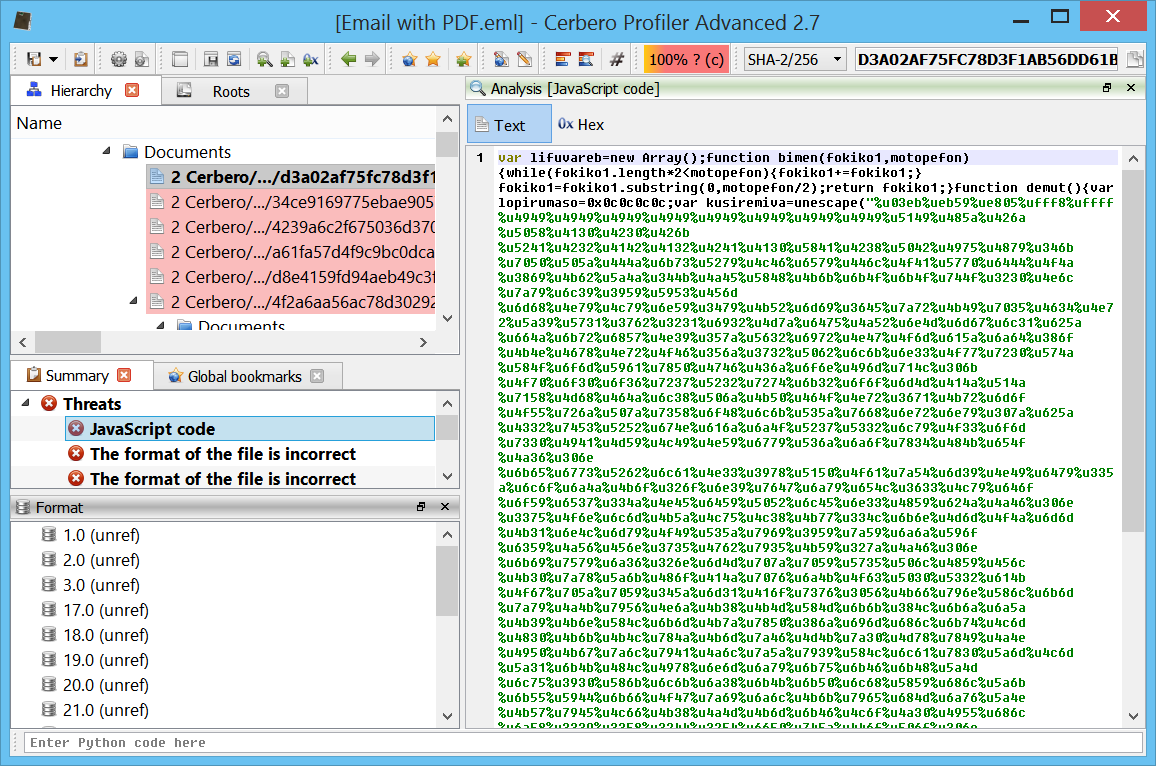
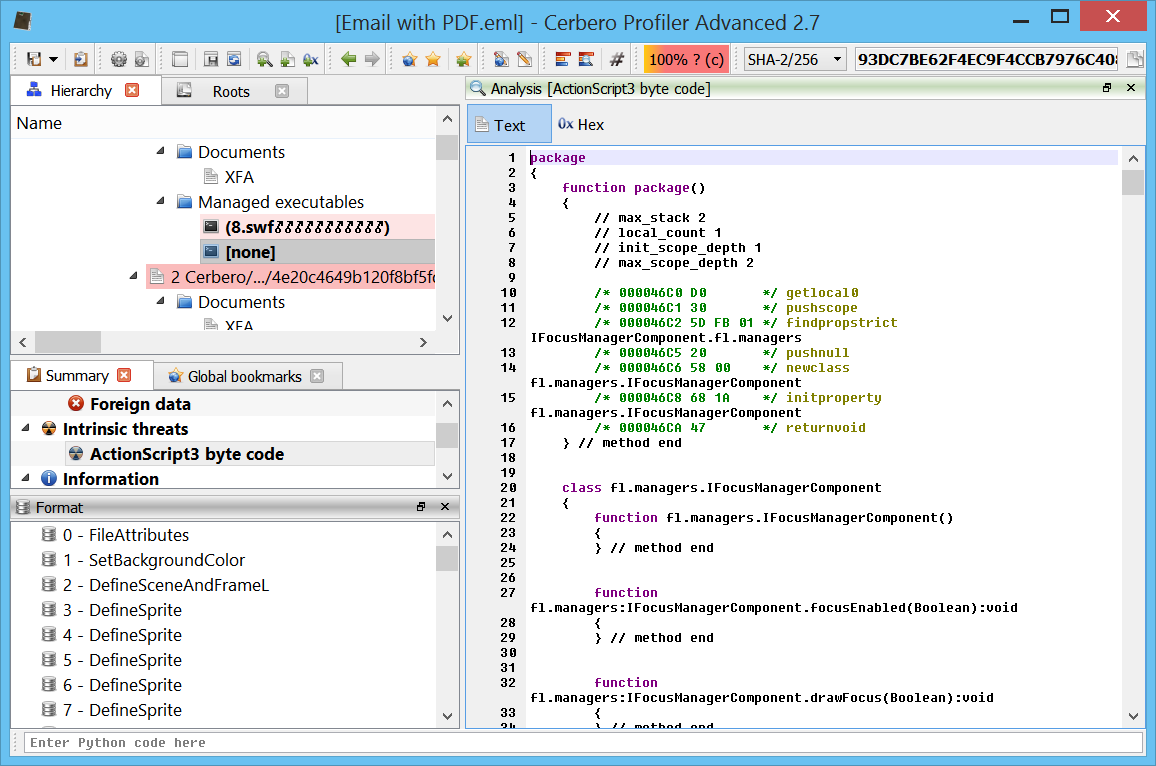
The image above shows JavaScript contained in a PDF inside a Zip archive attachment, while the image below shows ActionScript3 byte code of a SWF contained in a PDF inside a Zip archive attached to an email.

Enjoy!