We are excited to announce the release of the Memory Analysis 0.7.6 package. This version introduces several improvements, some of which stem from testing our solution against various CTF challenges and didn’t make it into version 0.7.
- Code Injection
- Unlinked Modules
- Process Pool Scan
- File Object Data Extraction
- Mapped Executable Analysis
Code Injection
In this release we’ve added two new options. The first is code injection detection.
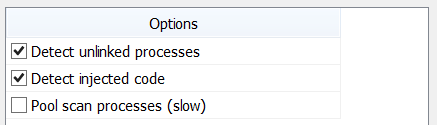
If you didn’t select the option in the initialization dialog, you can still run the scan using the dedicated action. When code injection is detected, the following view is displayed.
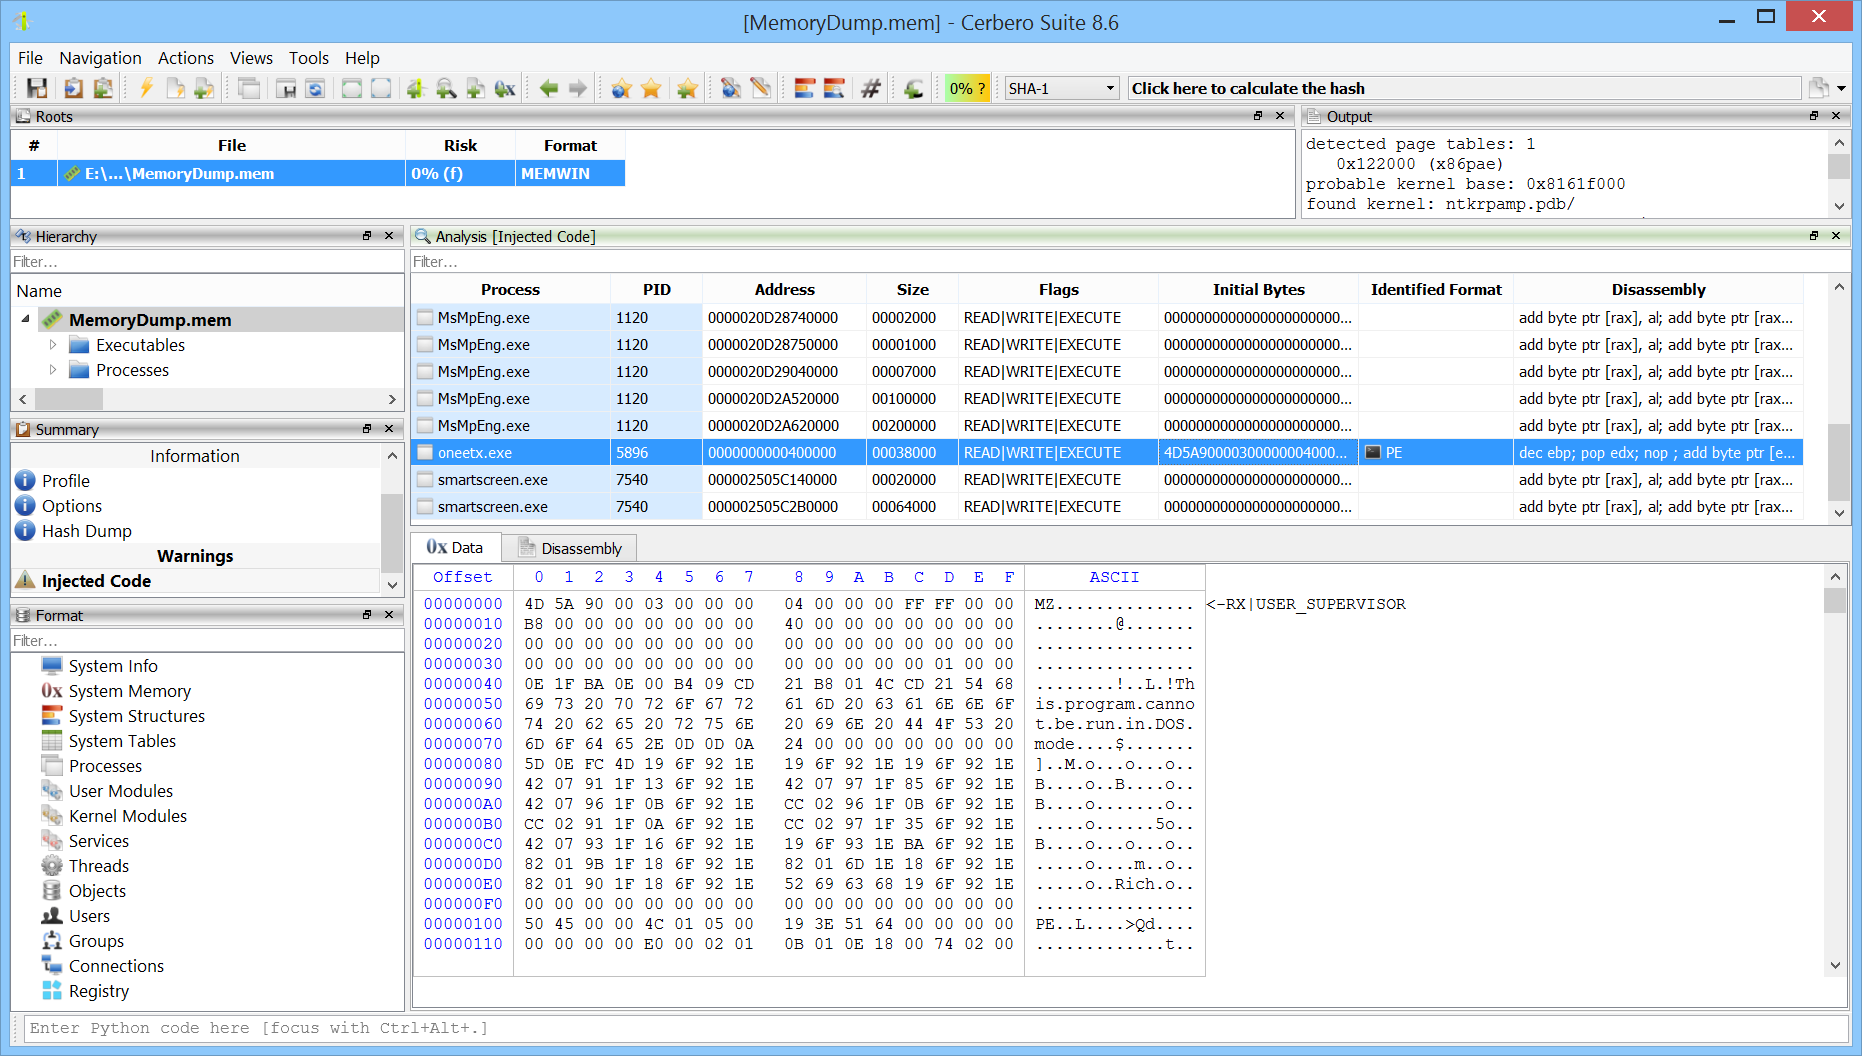
Each entry shows the initial bytes of the region, its disassembly, and the file format if identified. In this example, we can see an injected executable.
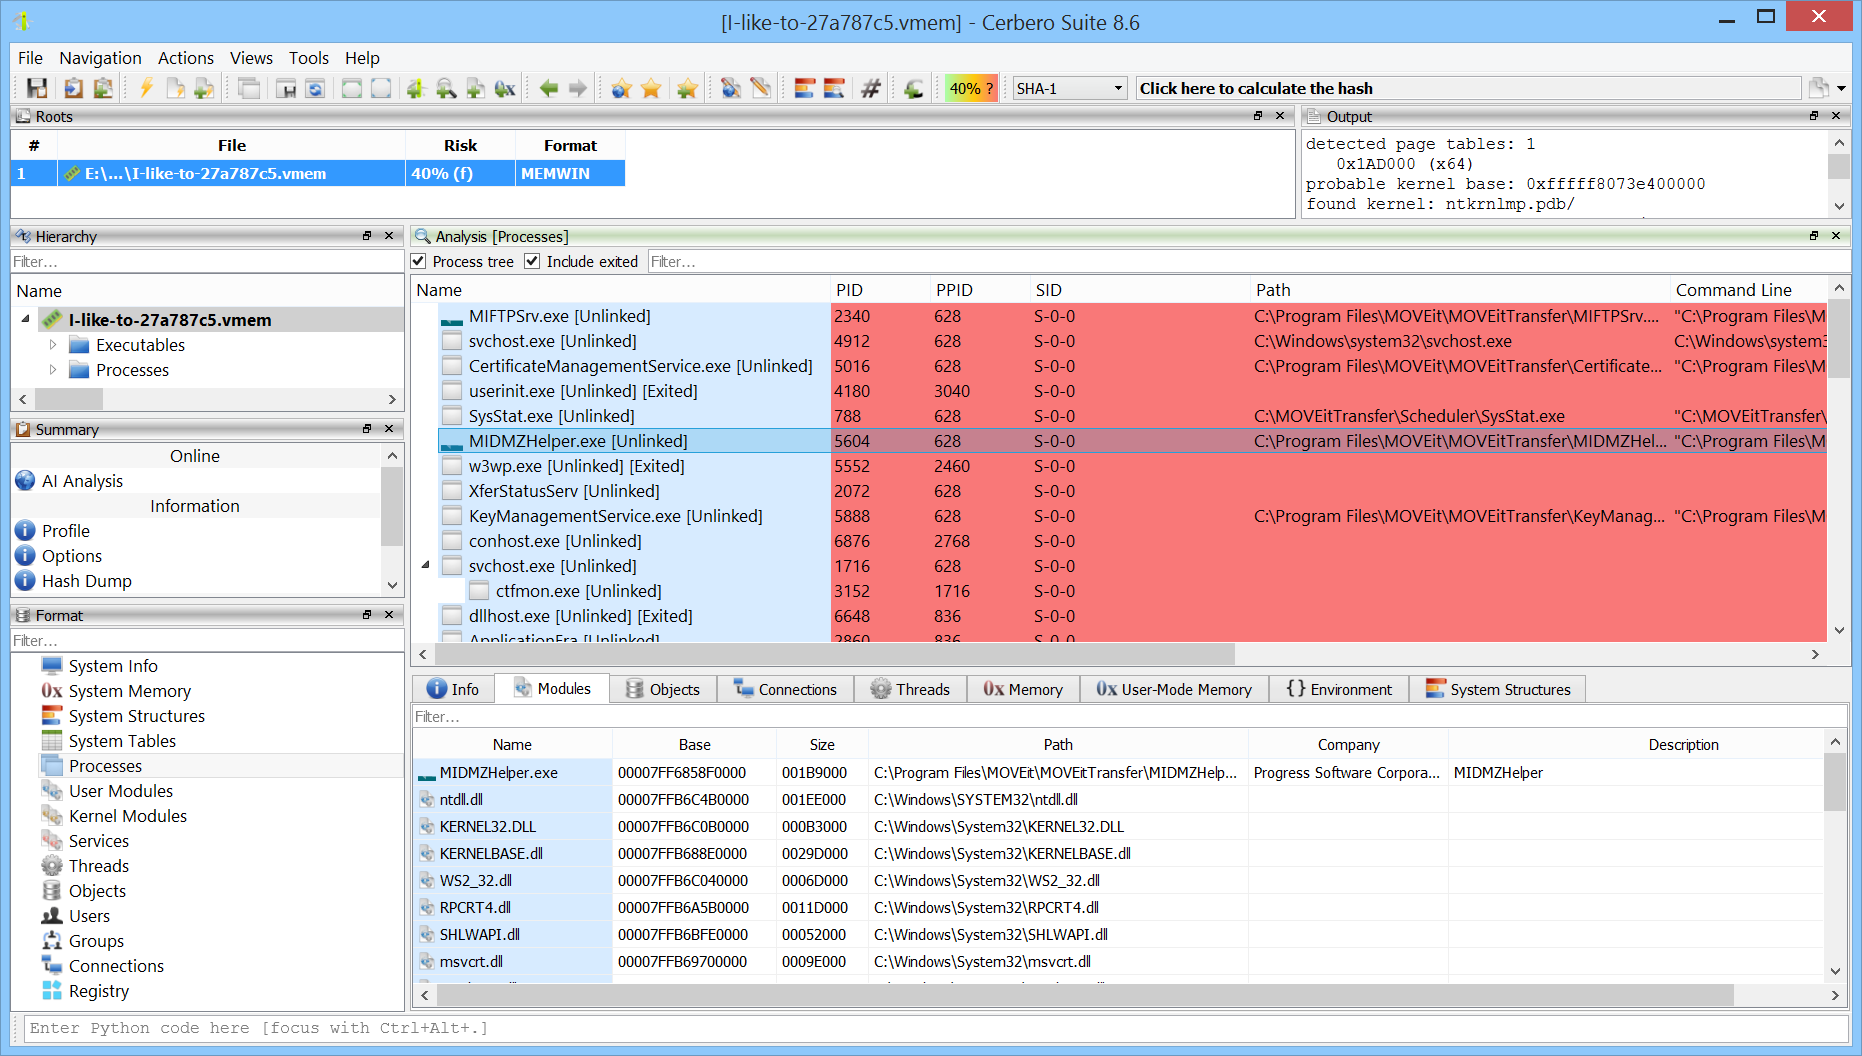
Unlinked Modules
To scan for unlinked user-mode modules, use the dedicated action.
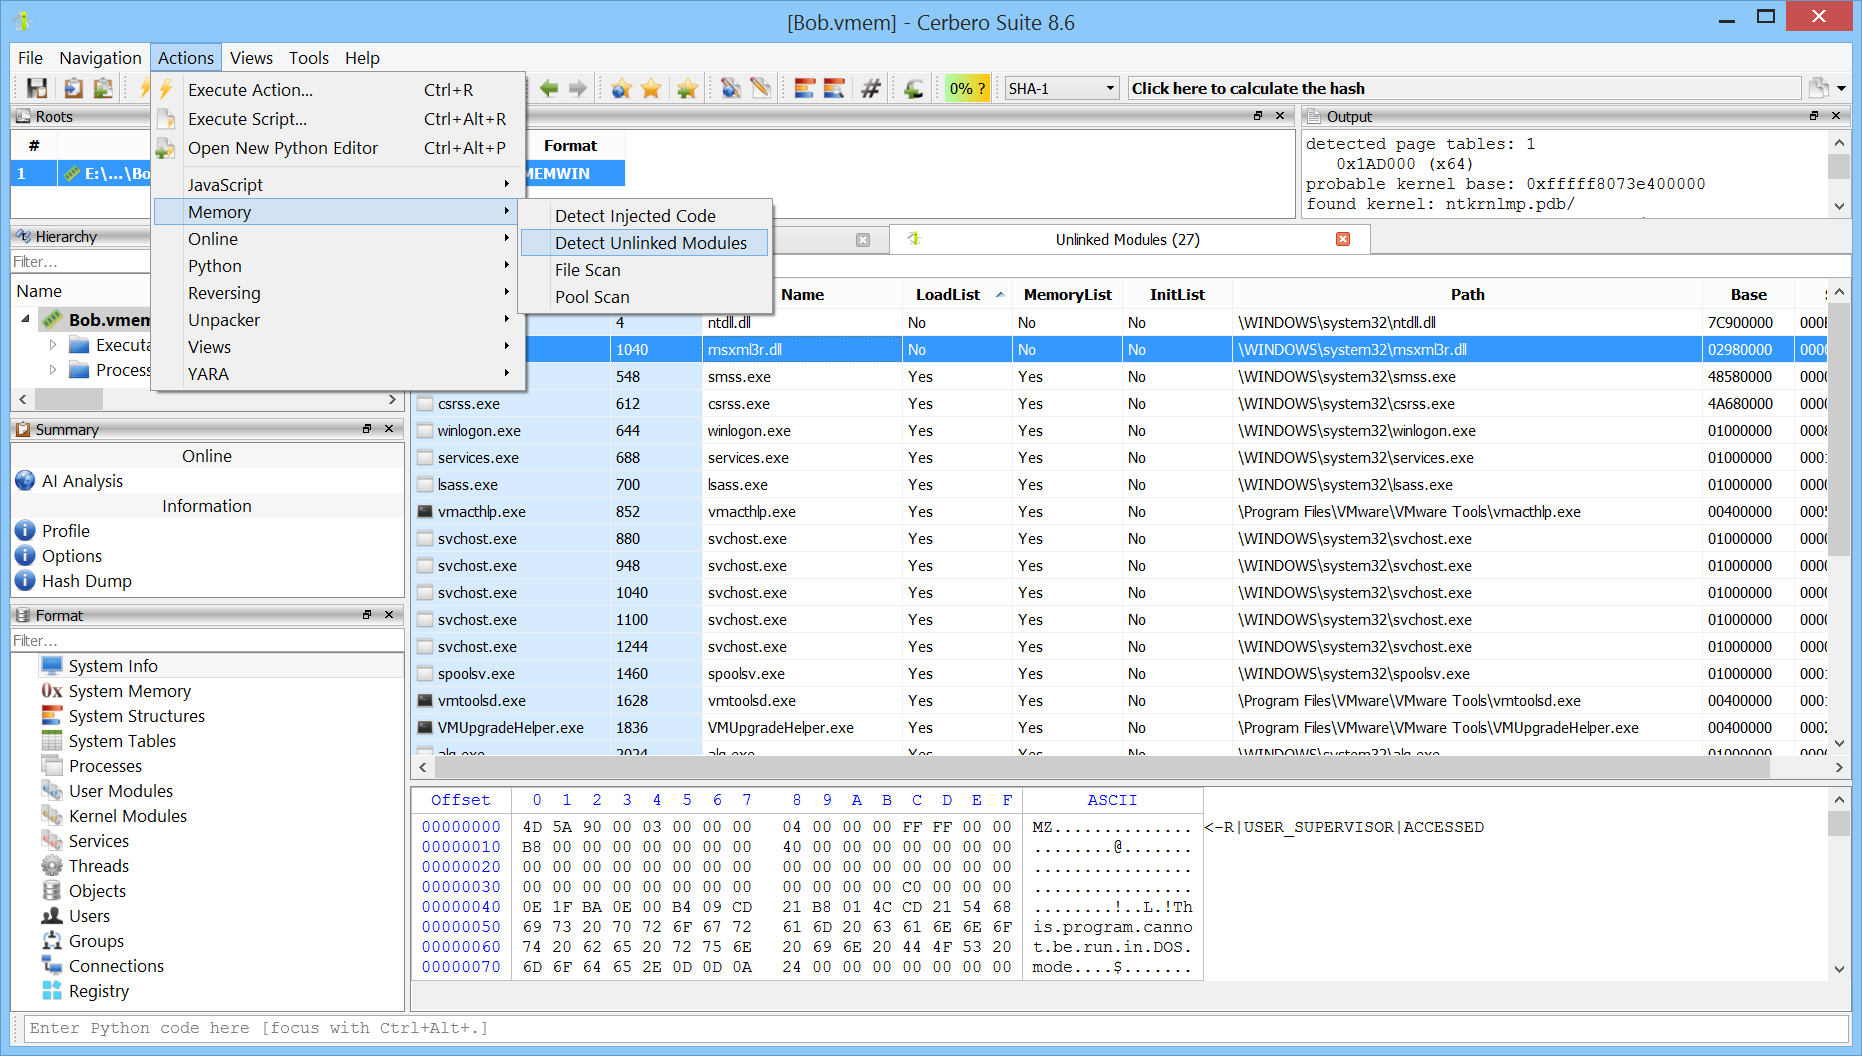
Each module entry displays the lists that reference it. The selected module, for instance, does not appear in any of the linked lists.
Process Pool Scan
You can now perform a pool scan for processes to avoid relying on system lists to retrieve them.
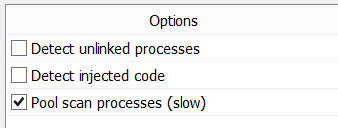
While this option is slow, it is especially useful when working with corrupted memory dumps.
The image above shows a memory dump that cannot be parsed correctly. The pool scan for processes allows us to at least partially explore the processes.
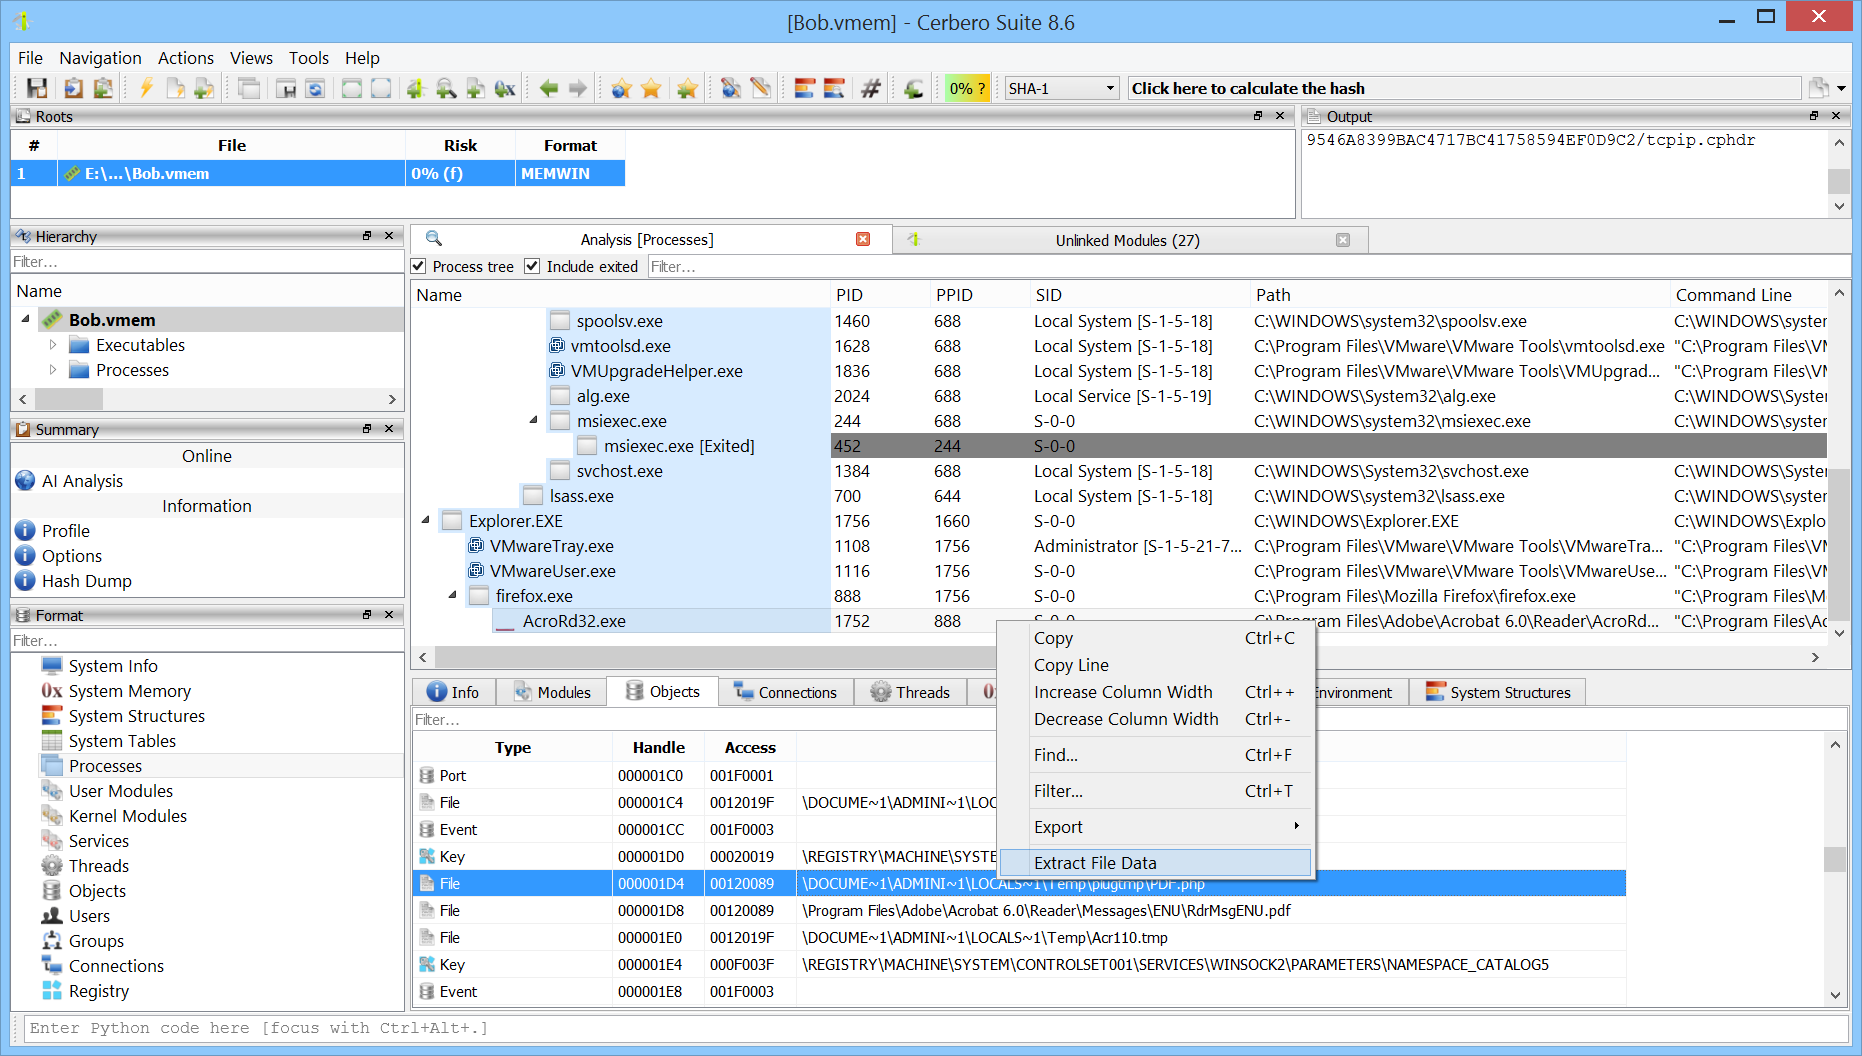
File Object Data Extraction
Although the file scan introduced in version 0.7 already allowed dumping cached file data from memory, it wasn’t possible to extract the same data from object lists. This capability has now been added.
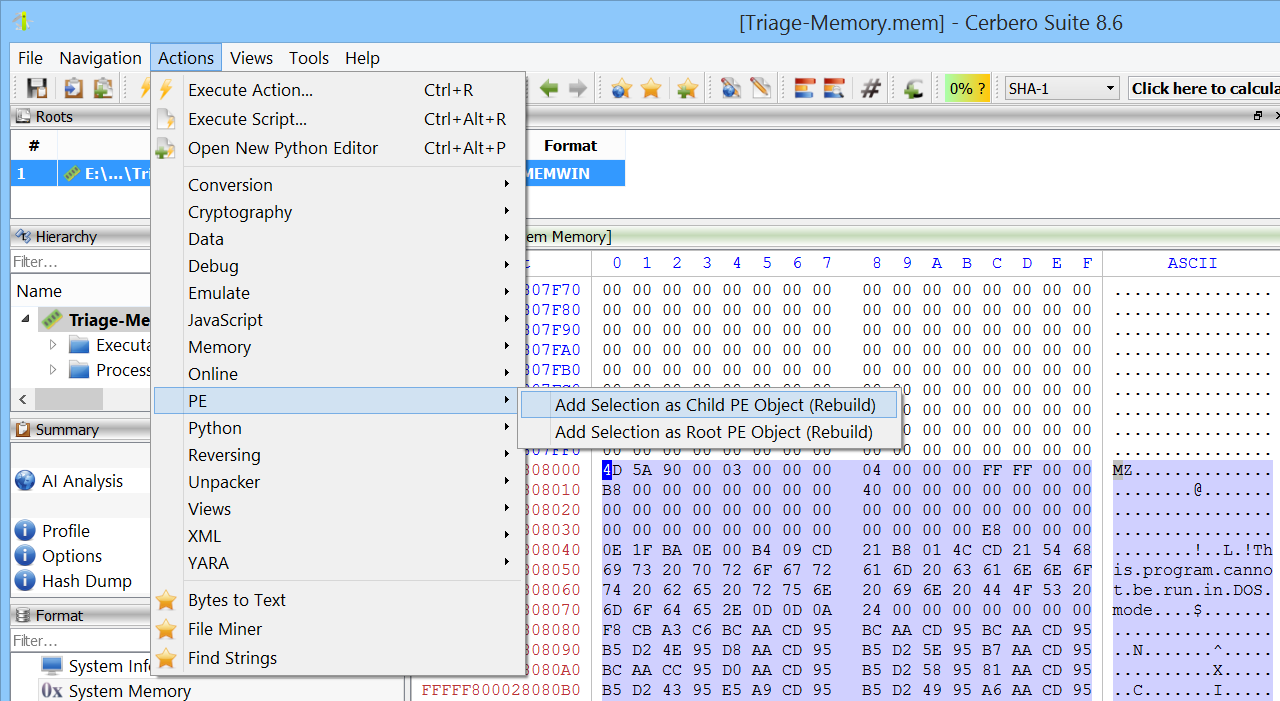
Mapped Executable Analysis
It is often necessary to analyze a Portable Executable (PE) mapped in memory but not referenced anywhere. To address this, we’ve added an action that rebuilds the mapped executable so it can also be examined with external tools.
Alongside these features, this release includes several minor improvements and bug fixes.