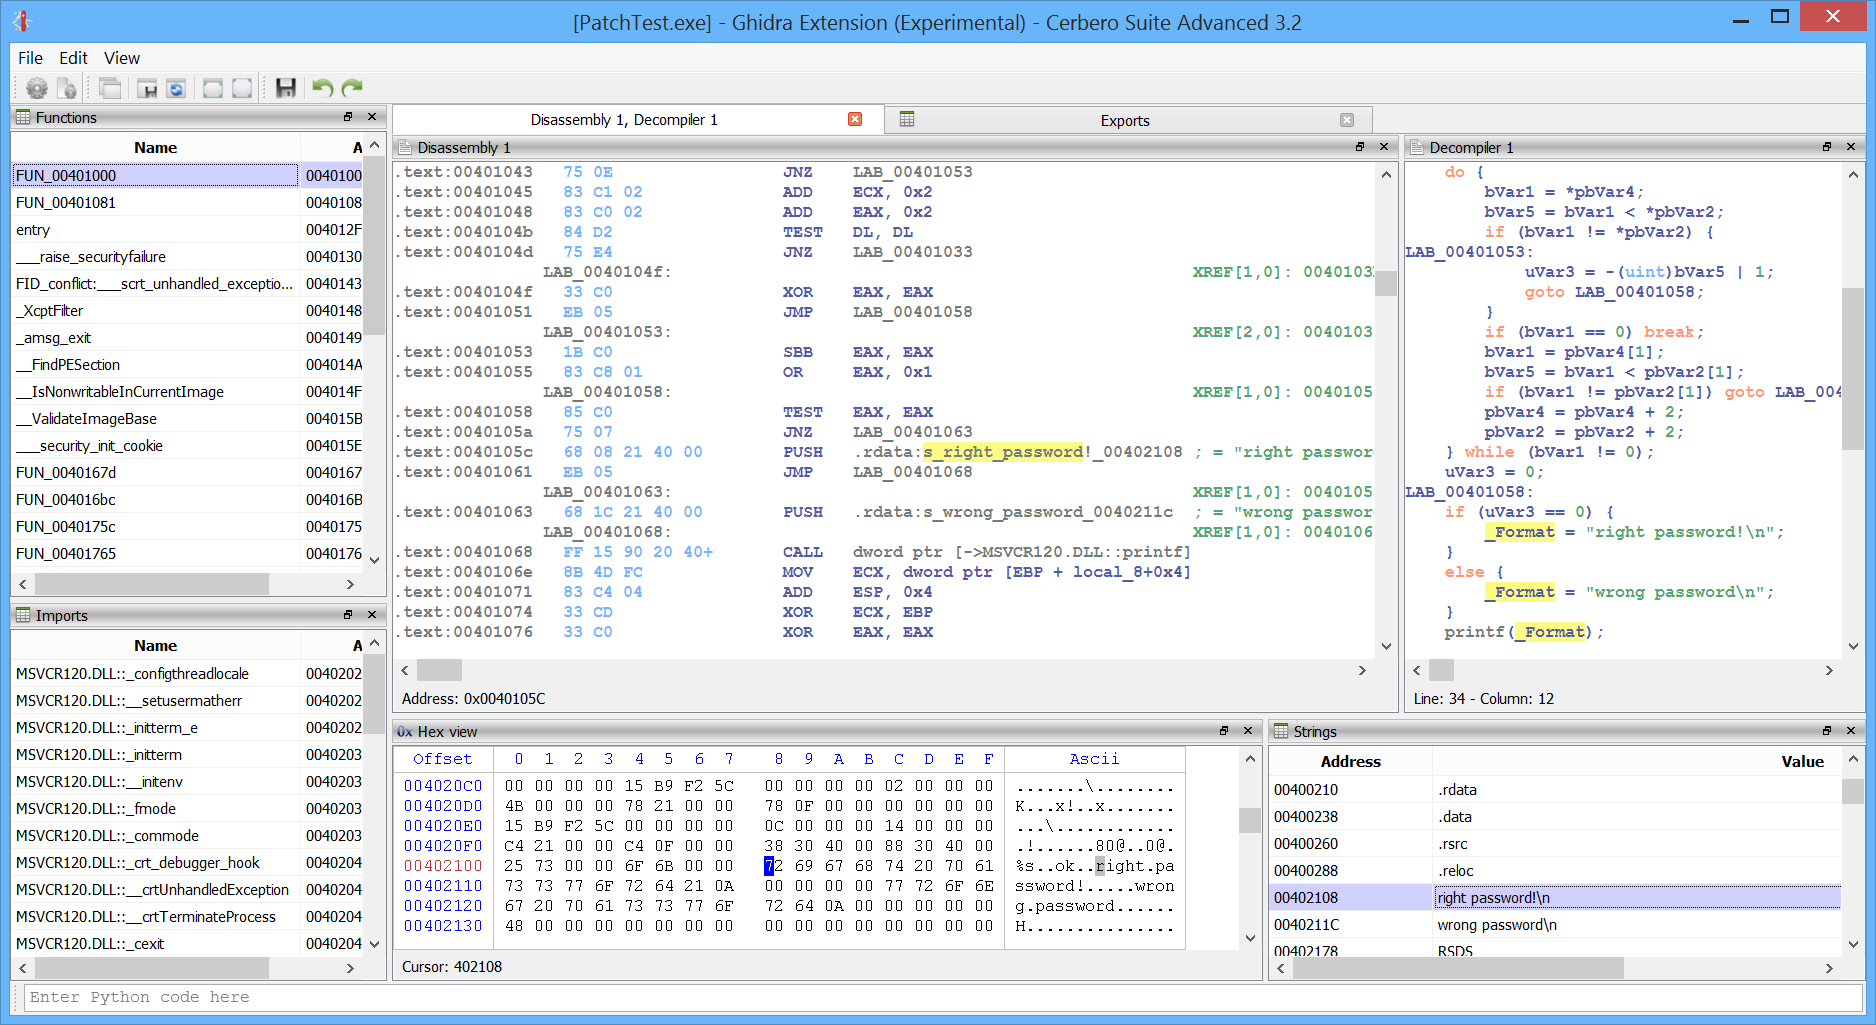
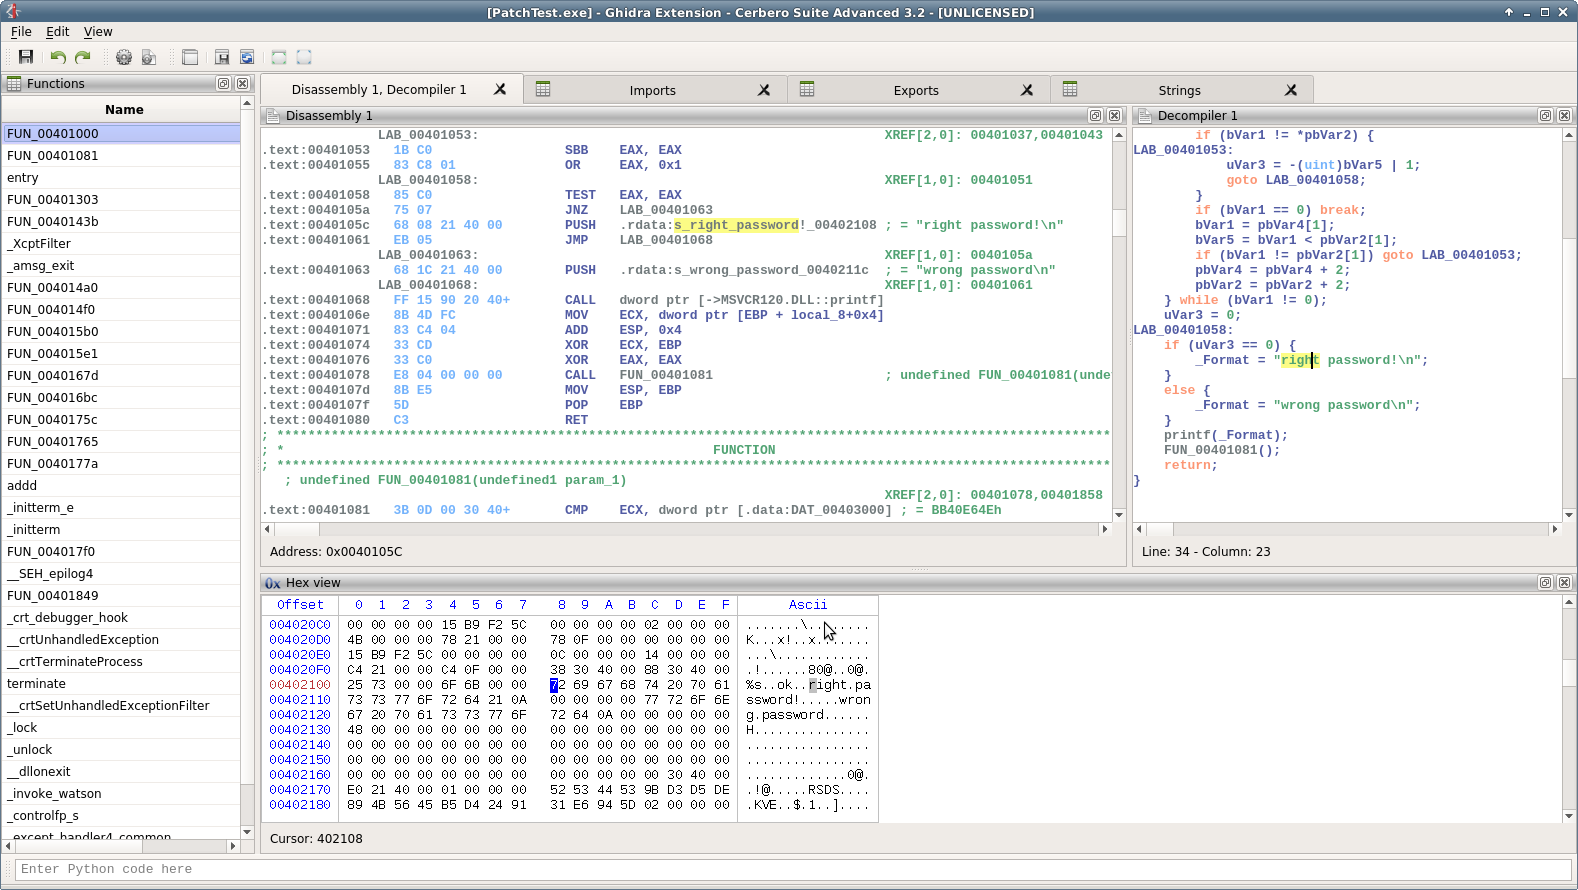
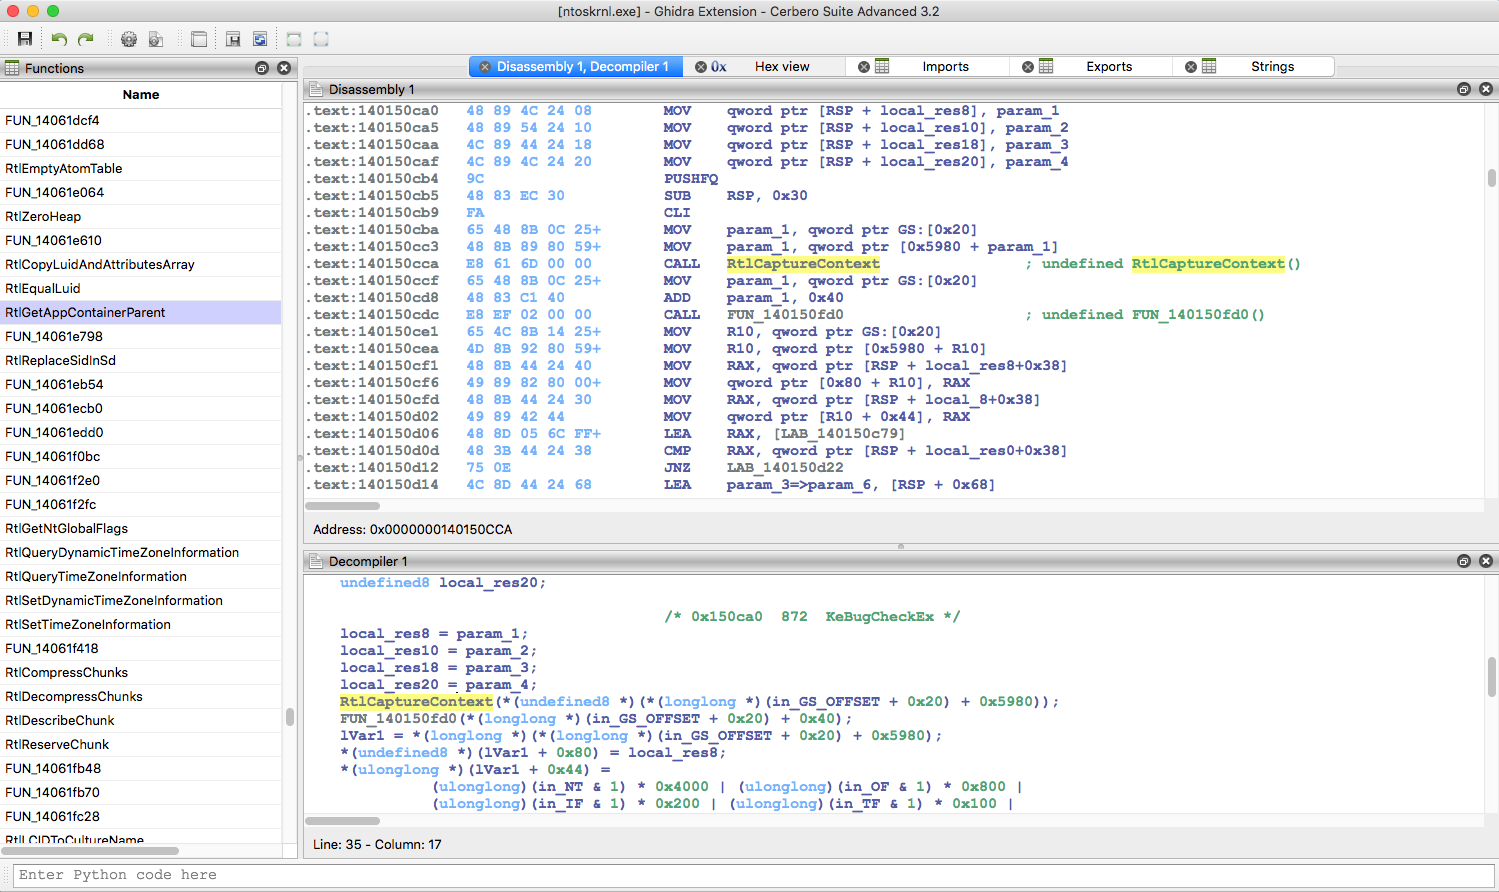
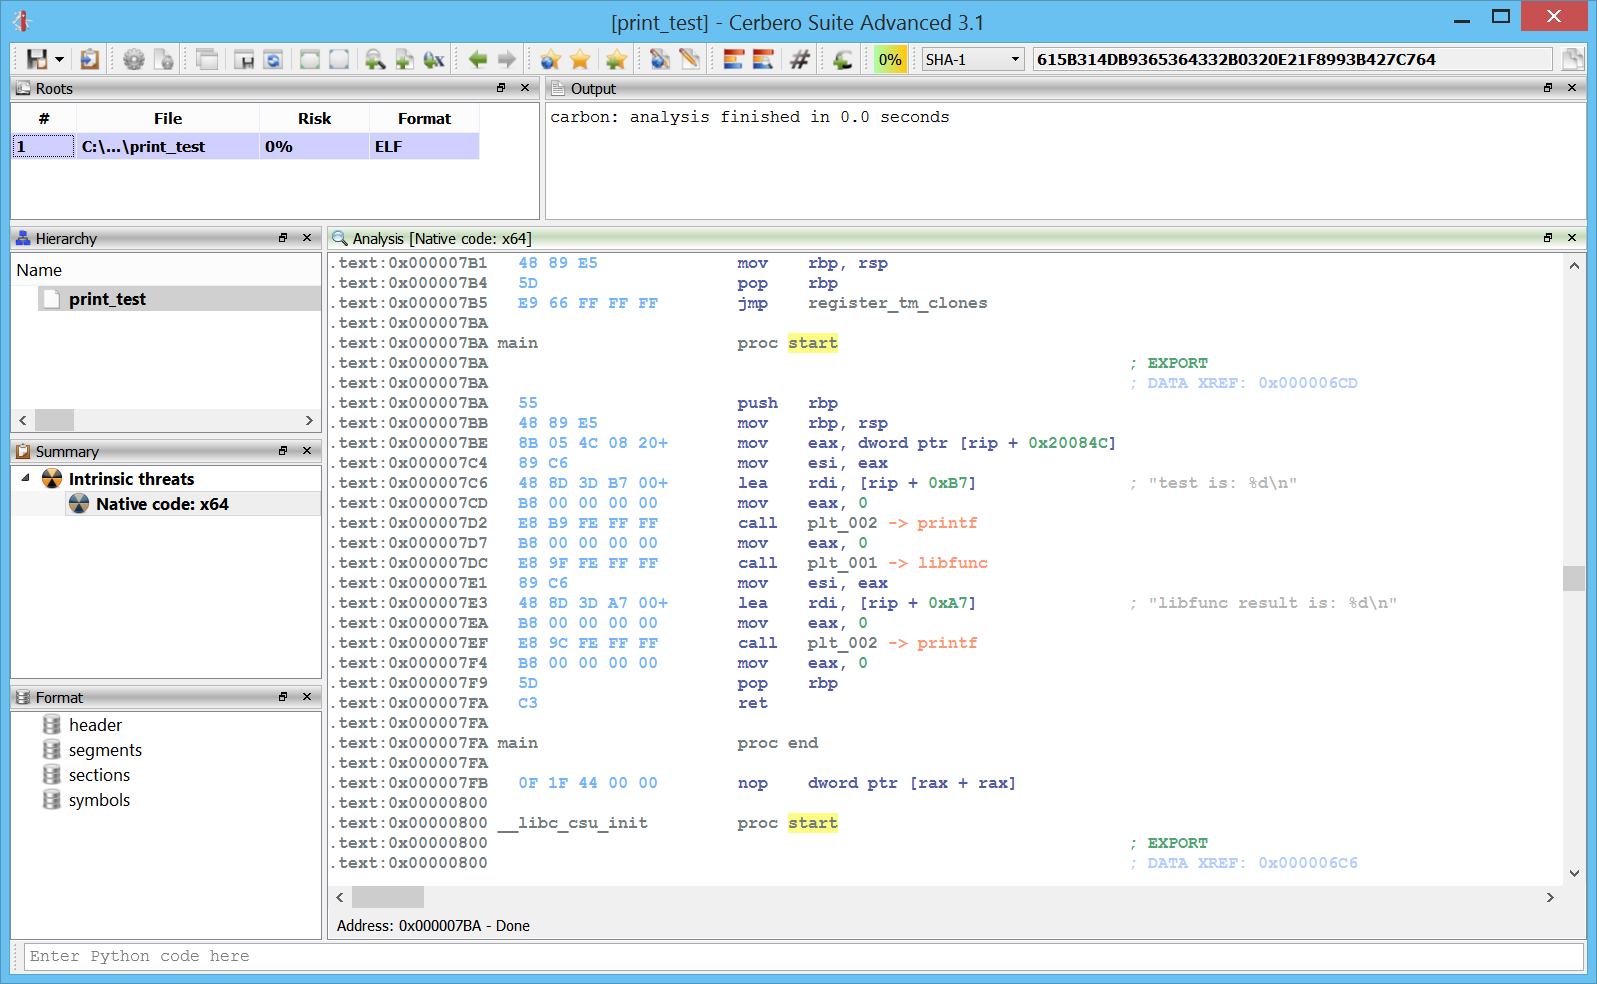
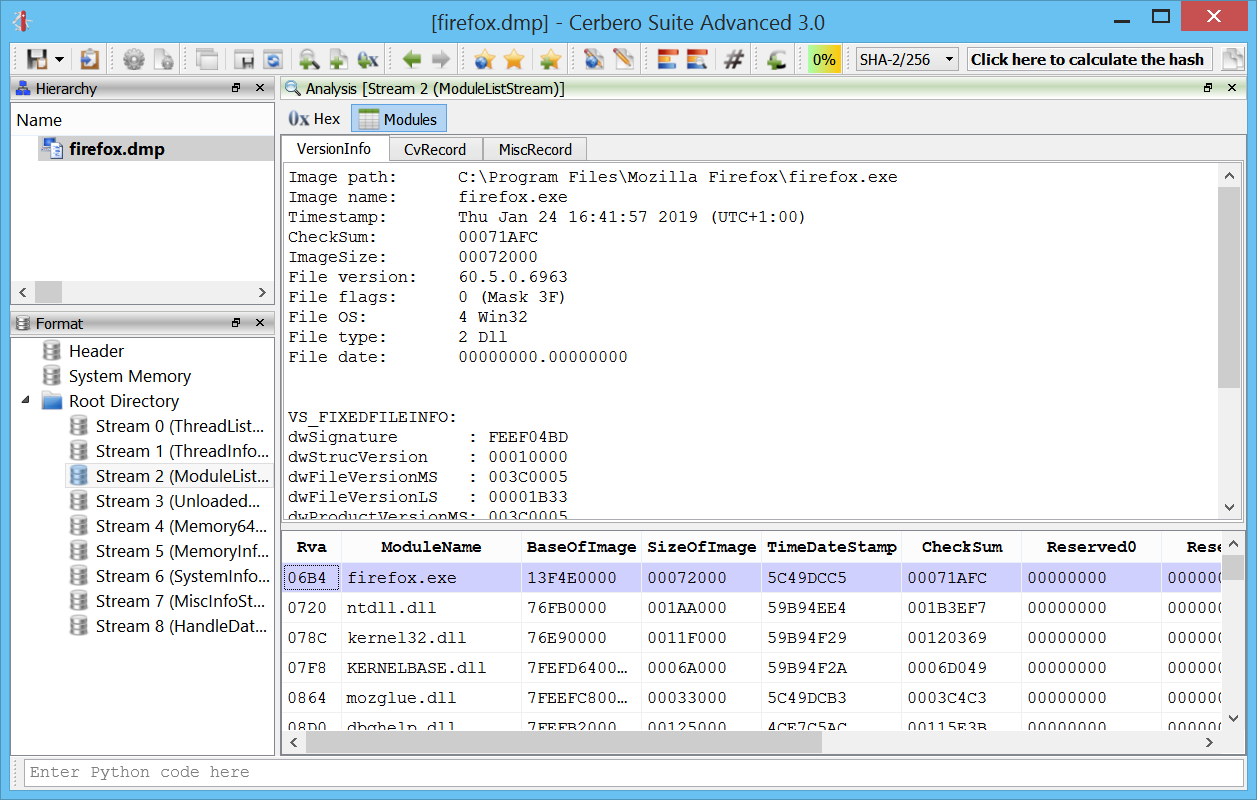
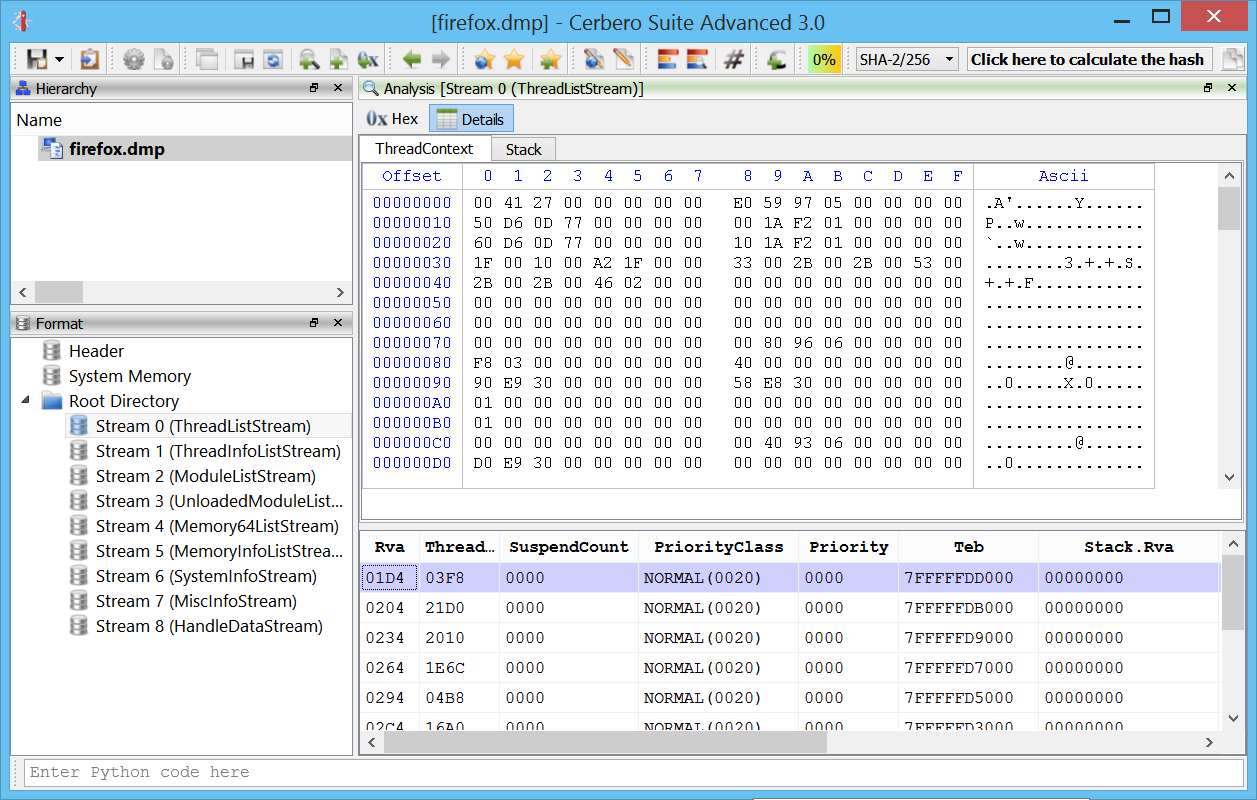
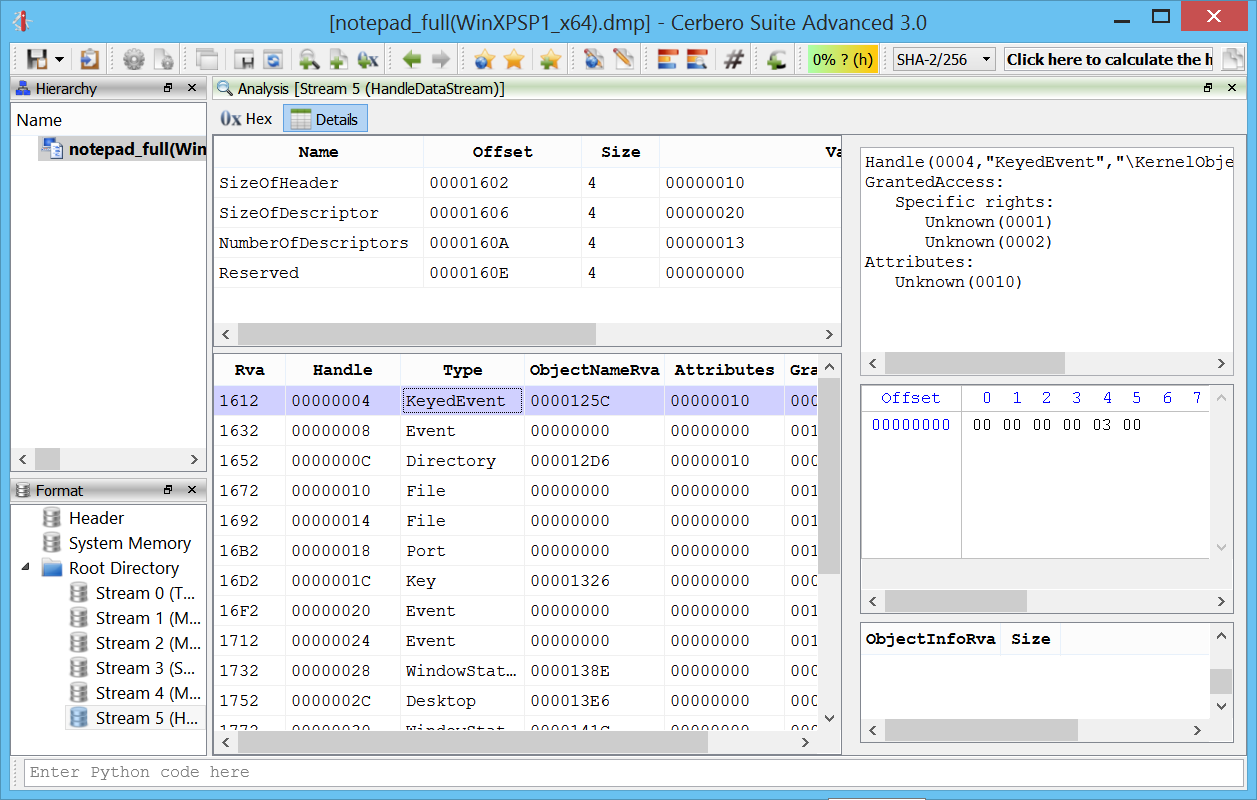
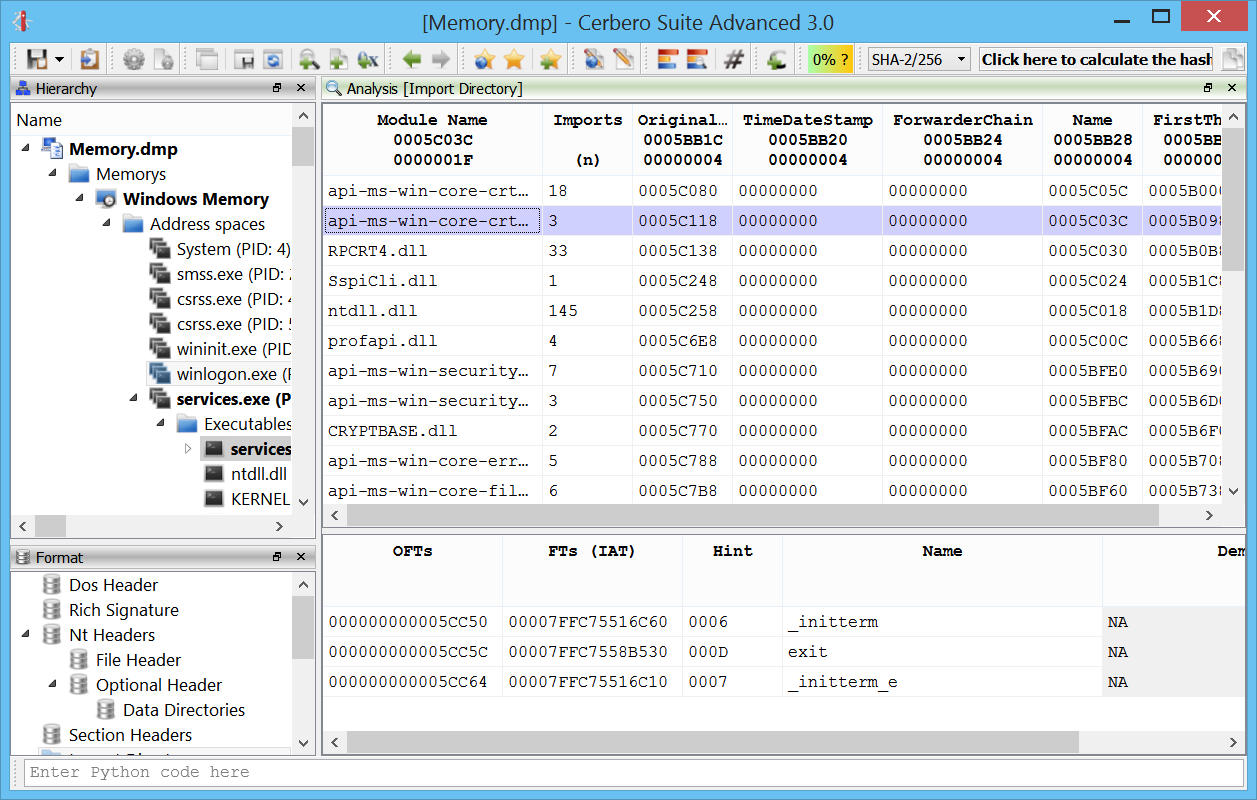
Profiler 2.9

Profiler 2.9.1 is out with the following news (entries with the plus sign apply only to the advanced edition):

+ added parsing of Windows heap
+ added file detection in memory regions and heap
+ added file detection in memory regions and heap via libmagic
added CCITTFax decoder for PDFs
added detection of DDE field codes
added support for 64-bit shellcode to executable
+ added display of page flags in hex views
added actions for text modification
added action to dump mapped PEs to disk
+ added signature for automatic recognition of EML files
+ improved identification speed of raw Windows memory images
+ improved loading speed of raw Windows memory images
+ improved scanning speed of memory images
+ improved global address space hex view
+ improved user address space view
improved fault tolerance of the XML parser
– improved CFBF support
– improved support of embedded OLE objects
– improved extraction of VBA code
– improved PDF decryption
– updated SQLite to 3.21.0
– updated libmagic to 5.32
– fixed XML to text action
– fixed Python multithreading issues
– fixed many small issues
– removed PasteBin action

We’ve waited for the official announcement of the new release, because we wanted to pack some more features inside 2.9.1!
After this edition, we will continue to release minor versions, while preparing a major 3.0 edition scheduled for the second half of this year.

Windows memory image identification speed

One of the main things we improved in 2.9 is the speed of opening memory images. The user has now the option whether or not to scan files in memory. Most of the times scanning files in memory is not needed and makes the opening of a memory image unnecessarily slow.

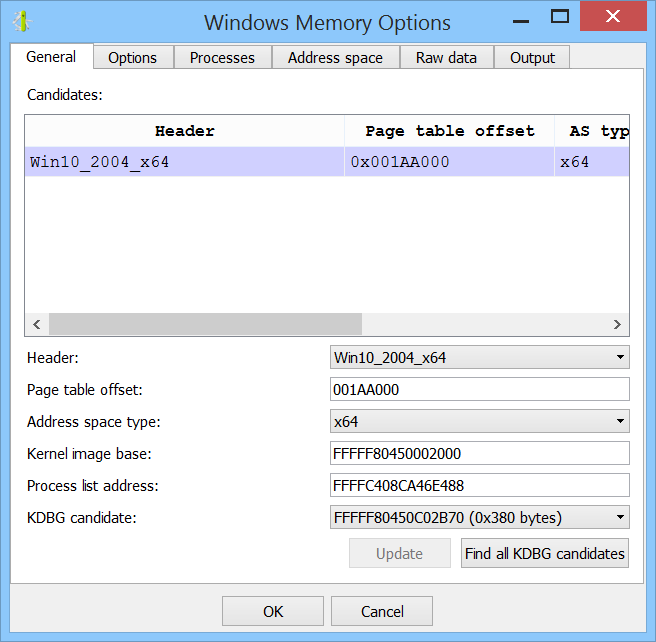
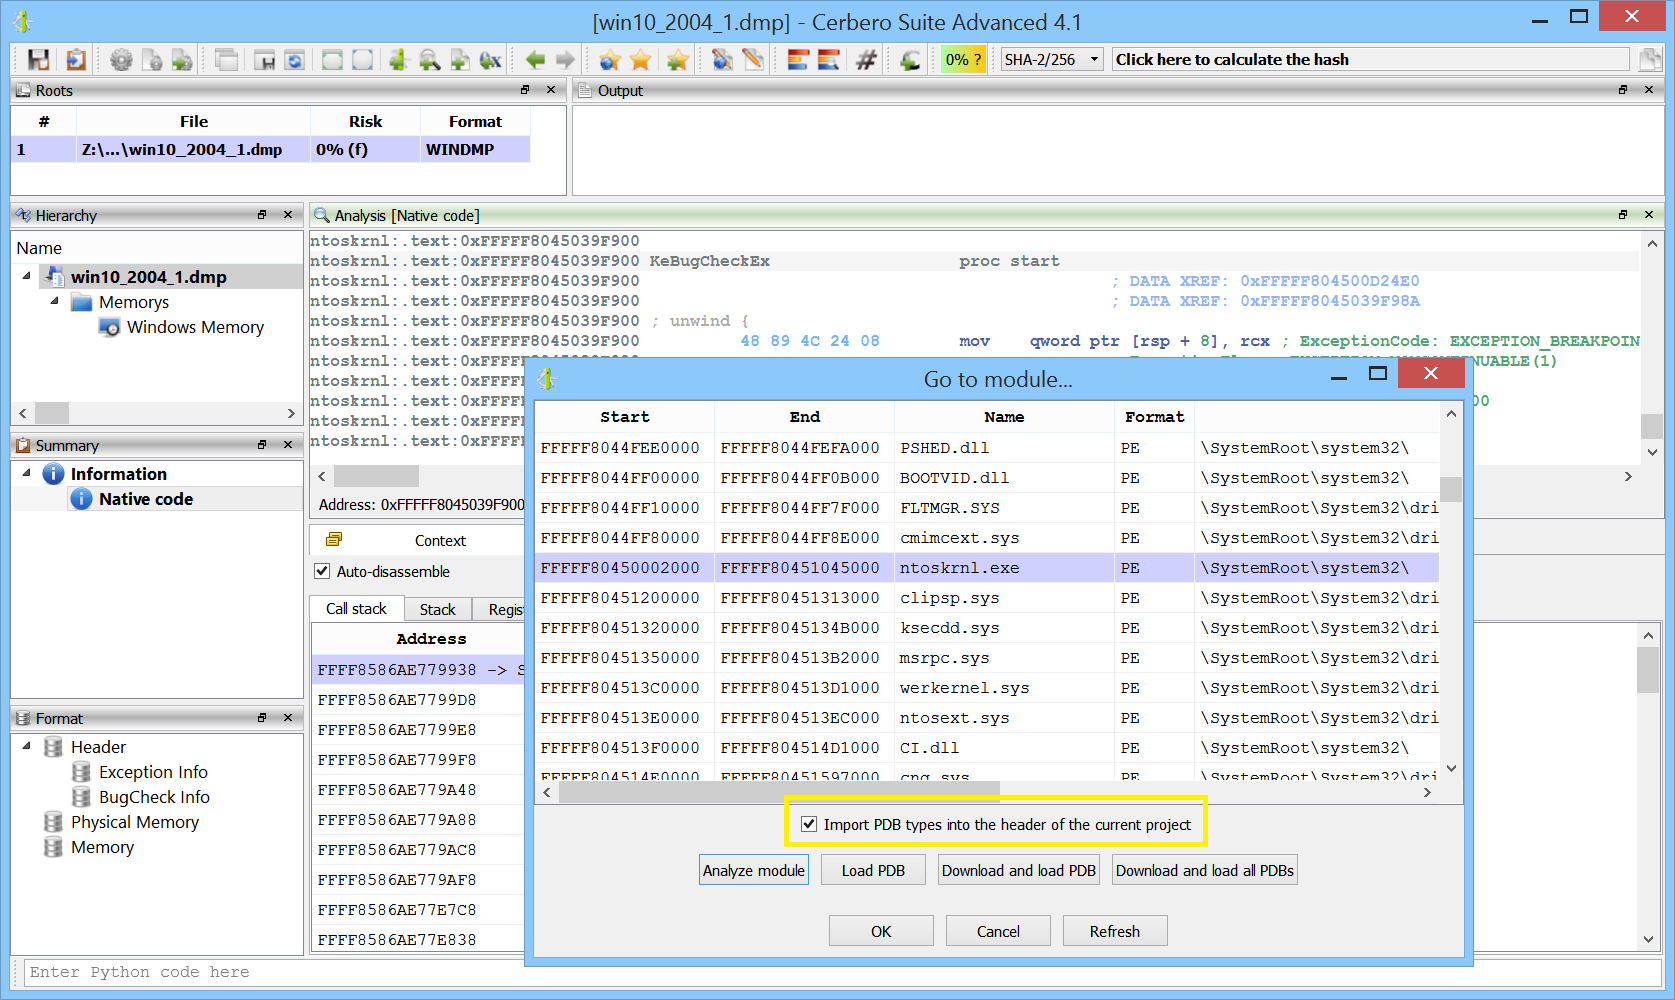
Version 2.9.1 comes with an additional very important speed improvement: the options dialog will pop up at the first occurrence of a valid KDBG structure. The user can still opt to look for additional KDBG structures as highlighted in the screenshot below.

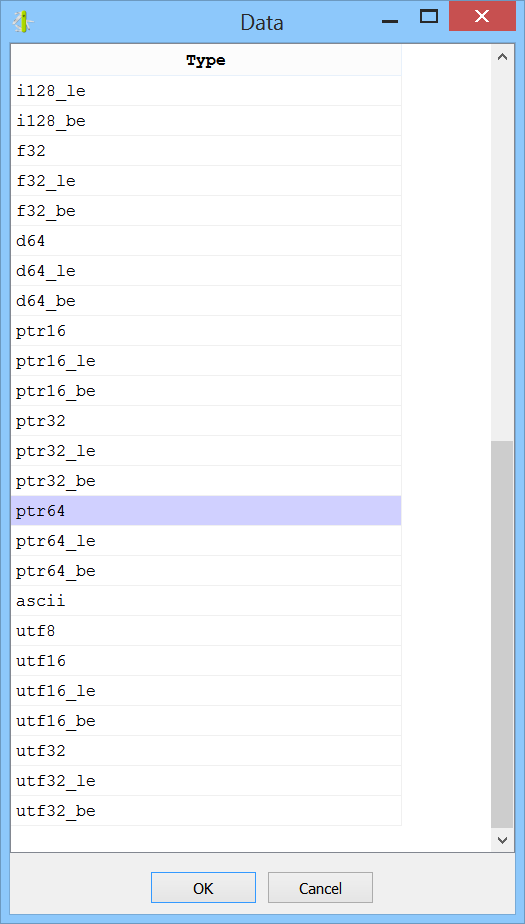
Memory file detection via libmagic

The main addition in version 2.9.1 versus 2.9.0 is the capability to increase the file detection rate of files in memory using libmagic.

We can dump all files detected to disk as well.

While libmagic increases the detection rate, it also adds many false positive. A nice effect of using libmagic is the detection of text files and scripts.

Memory page flags

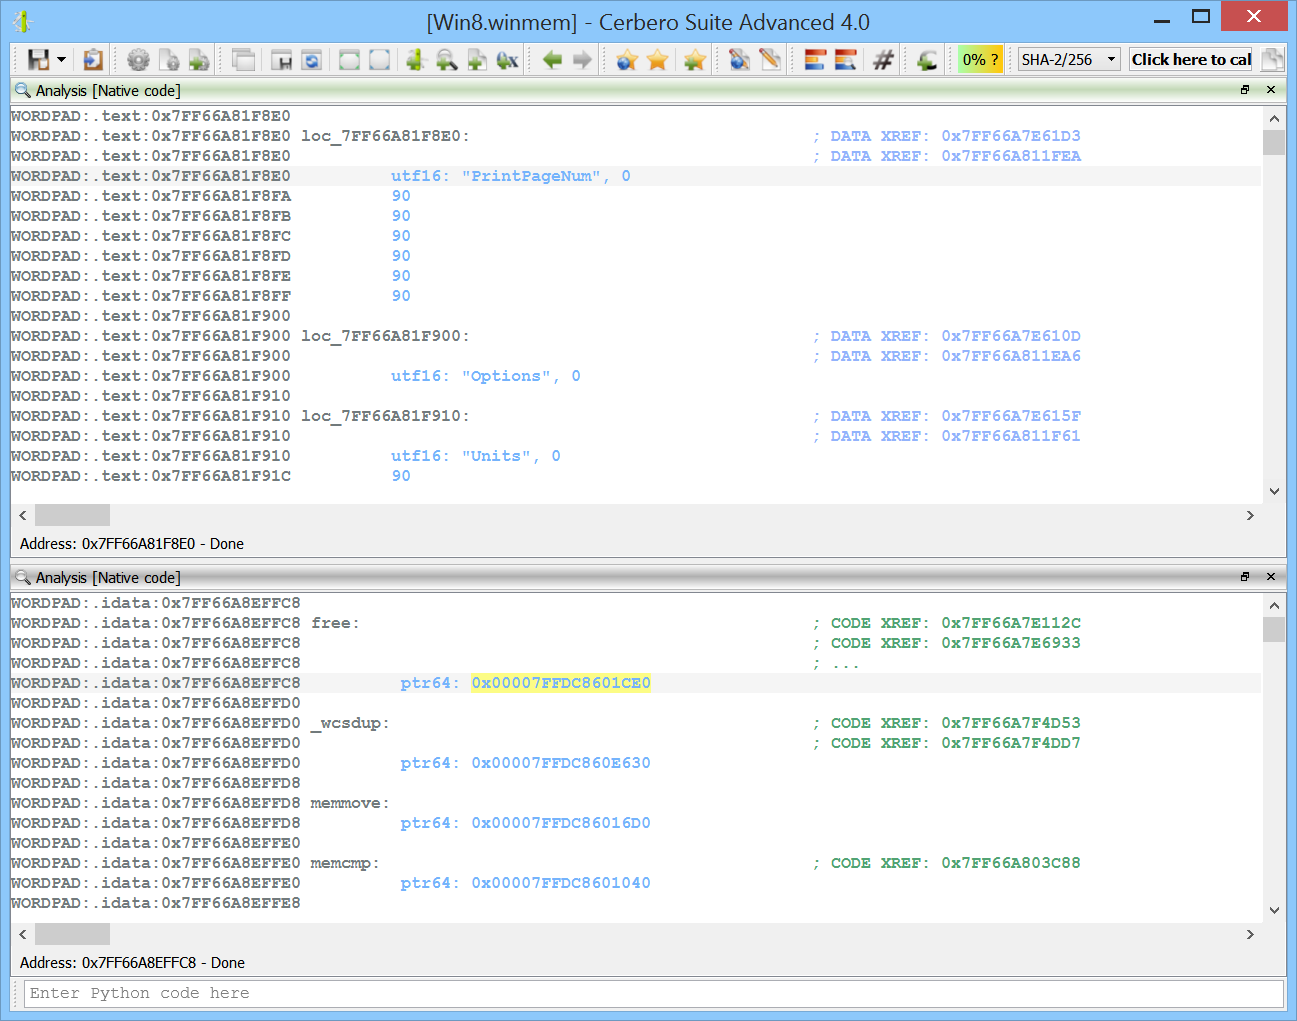
Page flags are now visible in the hex view for memory images. Not only when viewing the main address space of a process, but also when opening a mapped file.

Or the structures of a mapped file.

Or any children or resource of a mapped file.

Improved user space view

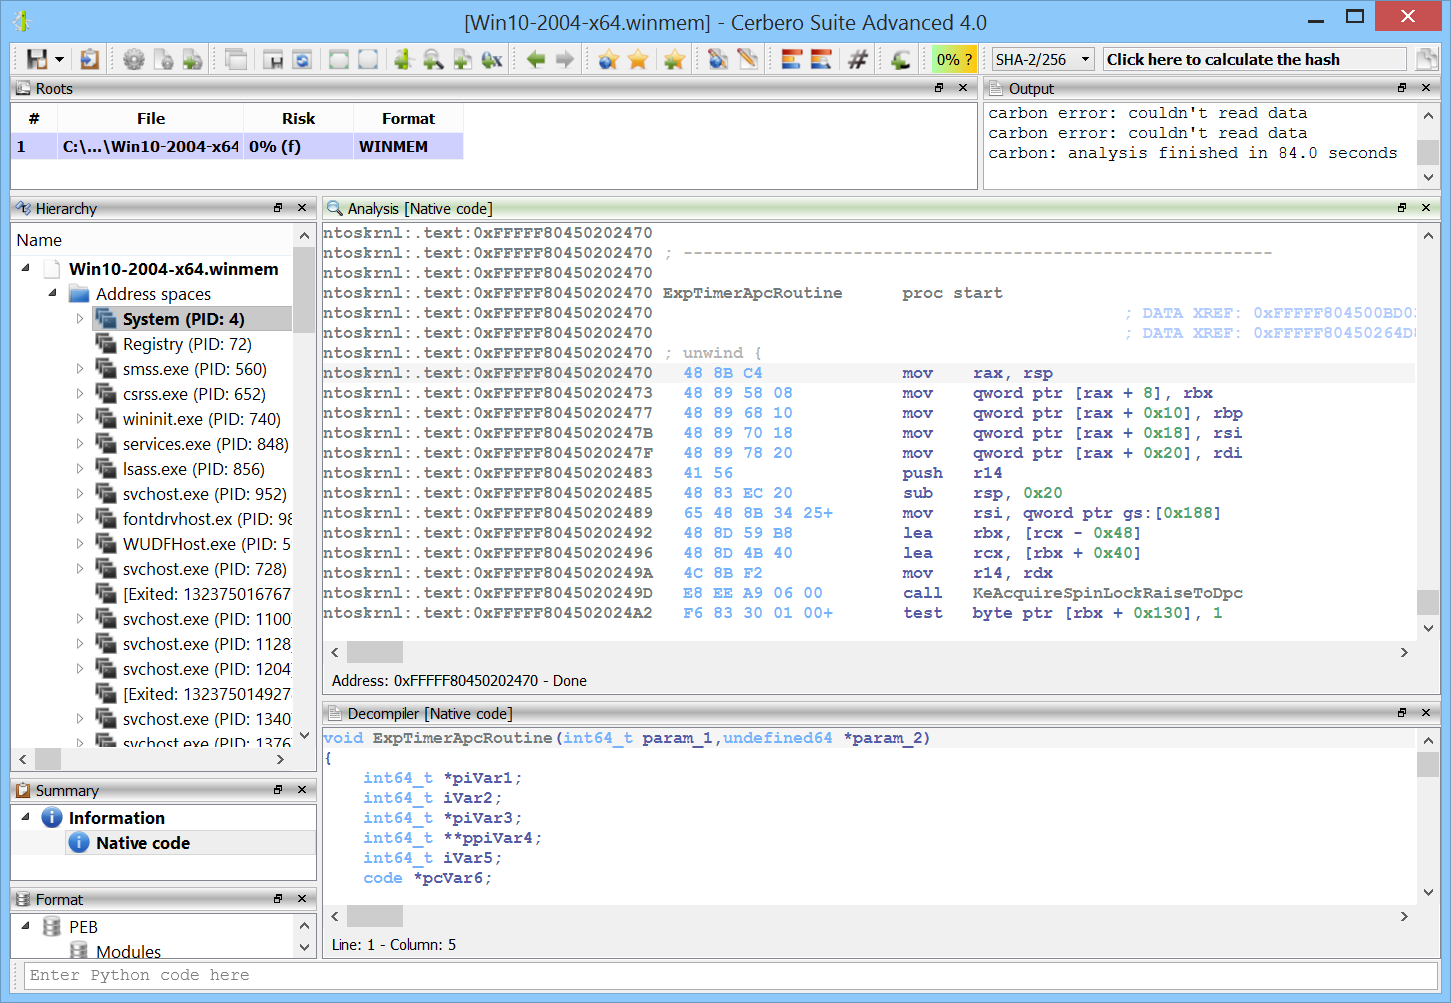
The user space view for every process now shows also the list of mapped modules.

Dump PE to disk

When inspecting a memory mapped executable, we can now dump the file to disk and Profiler will take care of adjusting the PE header in order to be able to inspect the file using external tools as well.

XML fault tolerance

The XML parser has been improved to handle incorrect XML files. This is especially important when handling PDF malware which contains malformed XDP data.

CCITTFax decoder

Yet another decoder has been added to our PDF support. Here we can see a malware sample using this codec to conceal some JavaScript code.

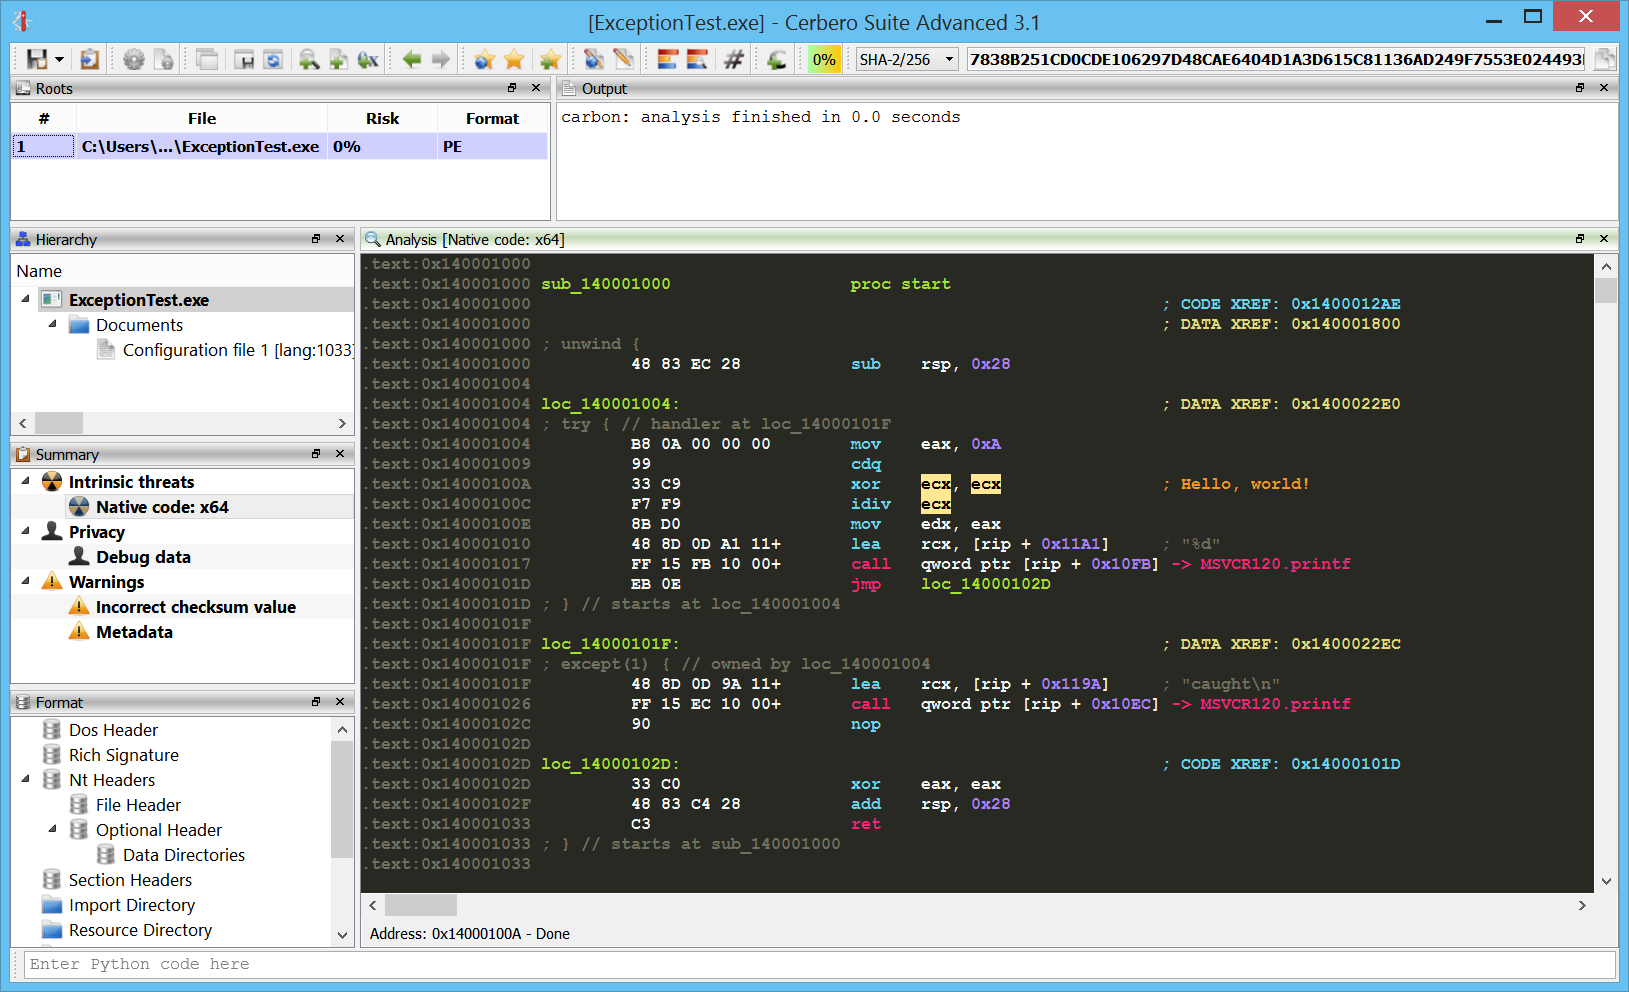
64-bit shellcode to executable

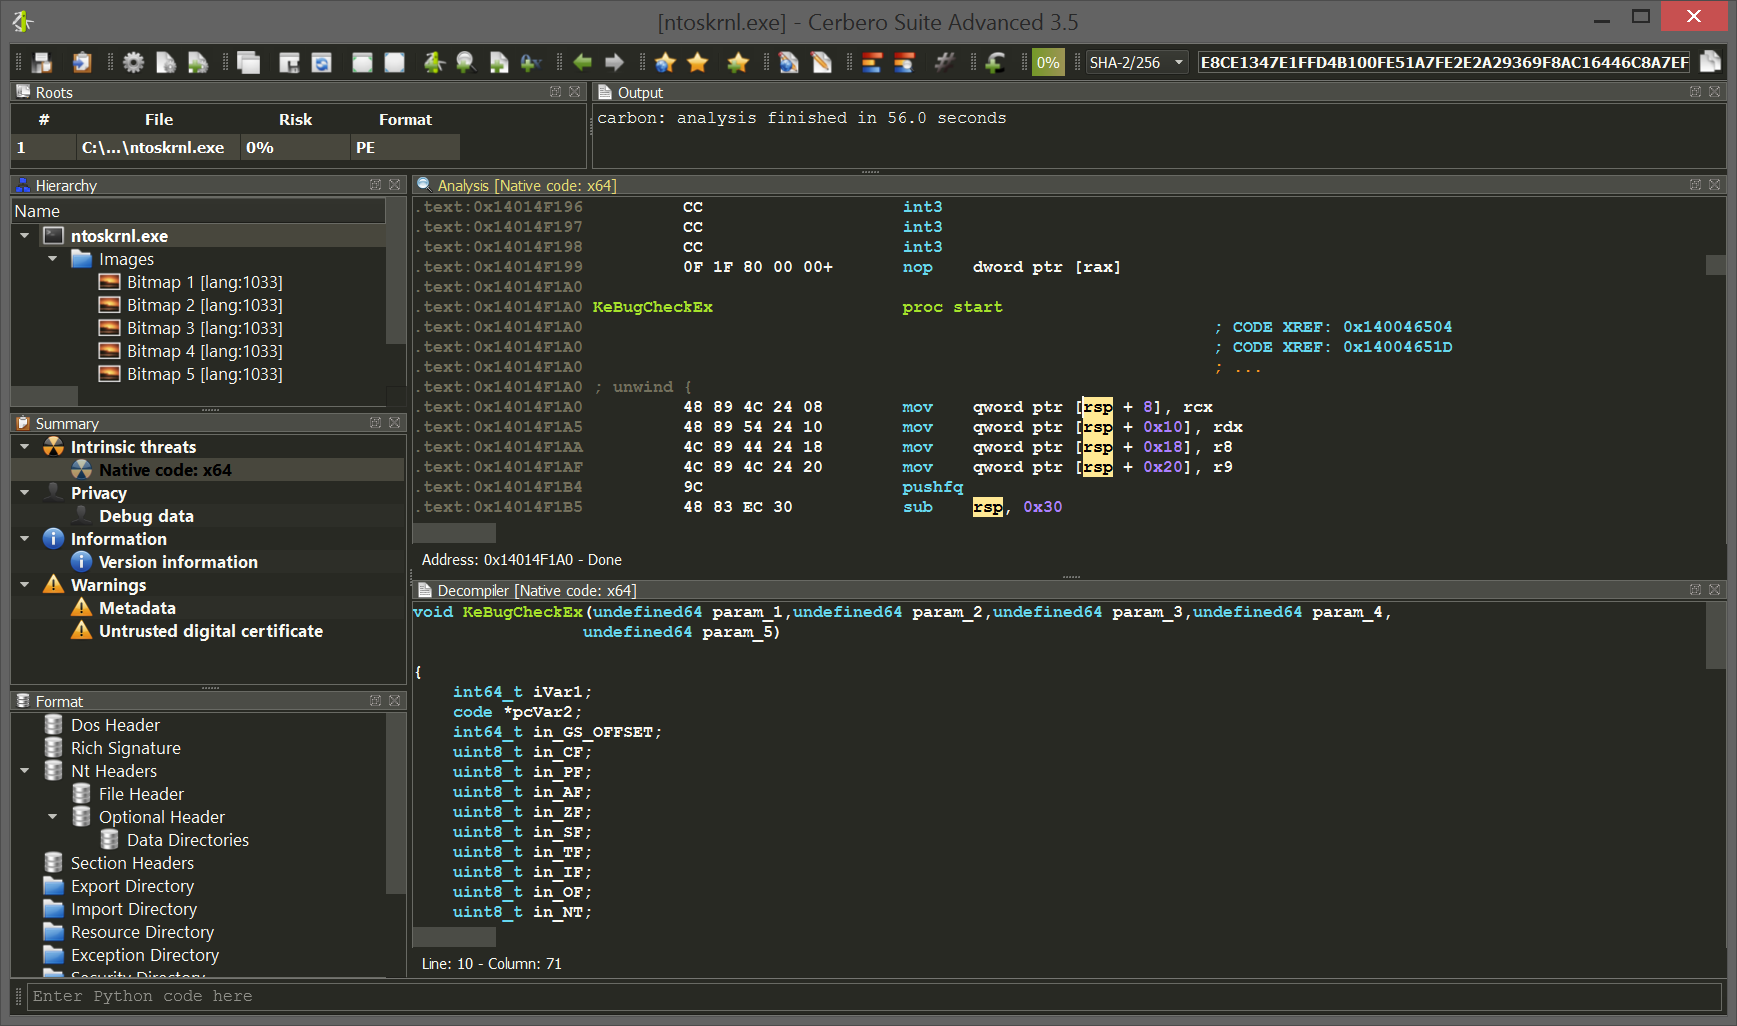
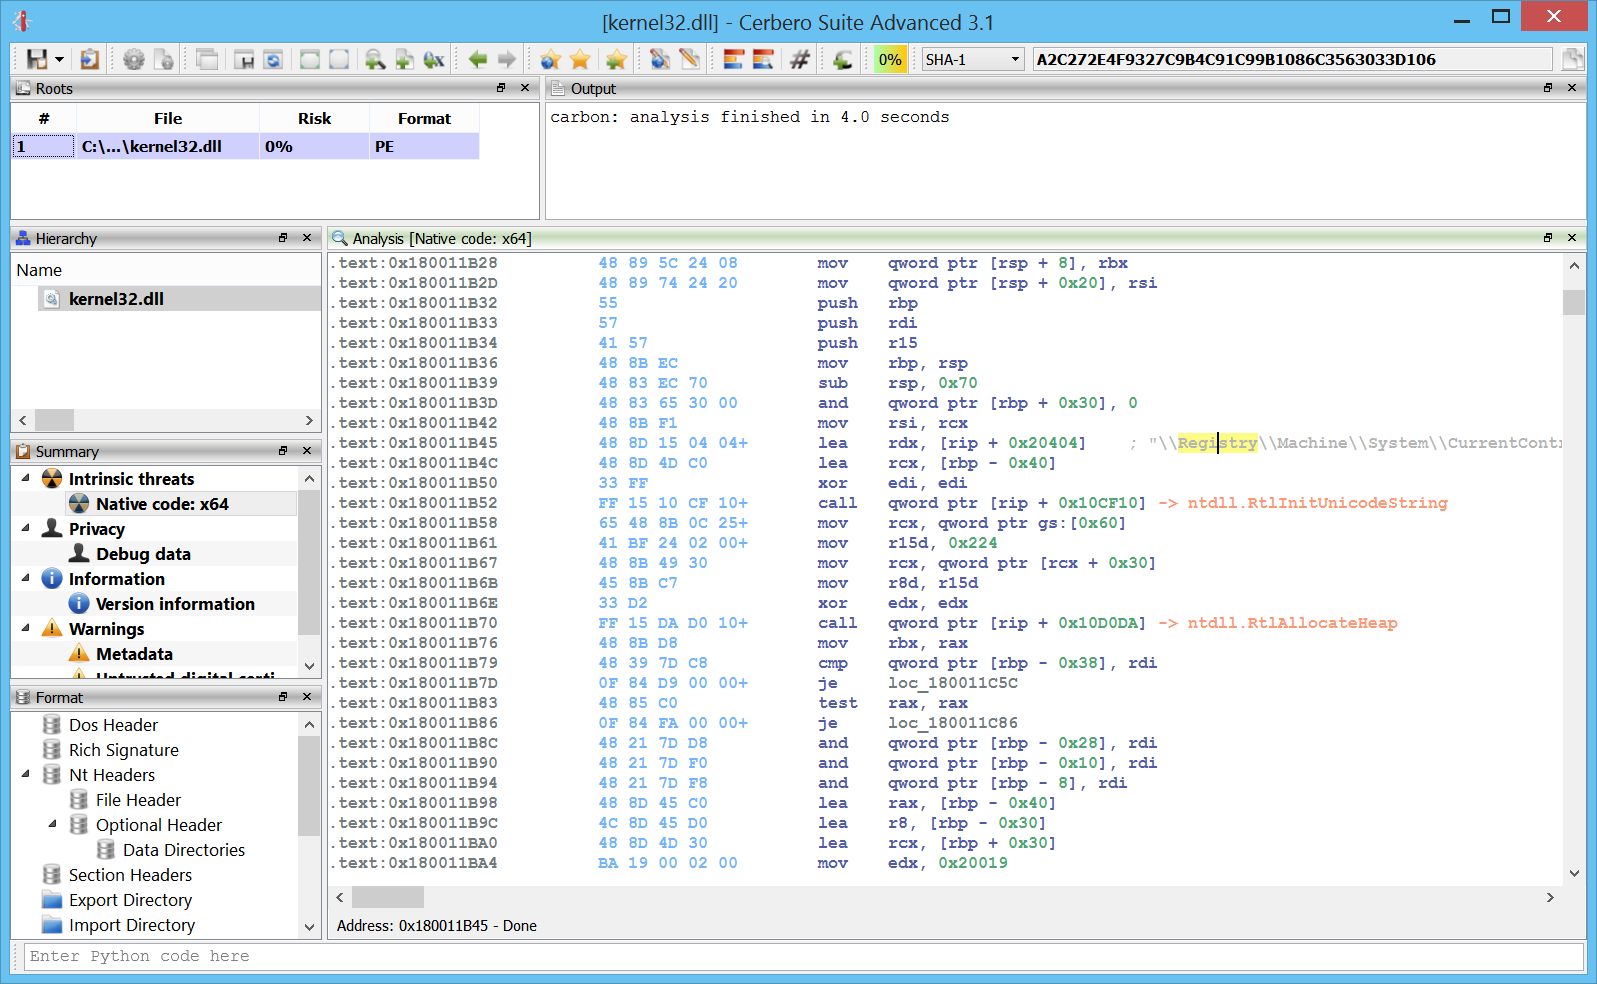
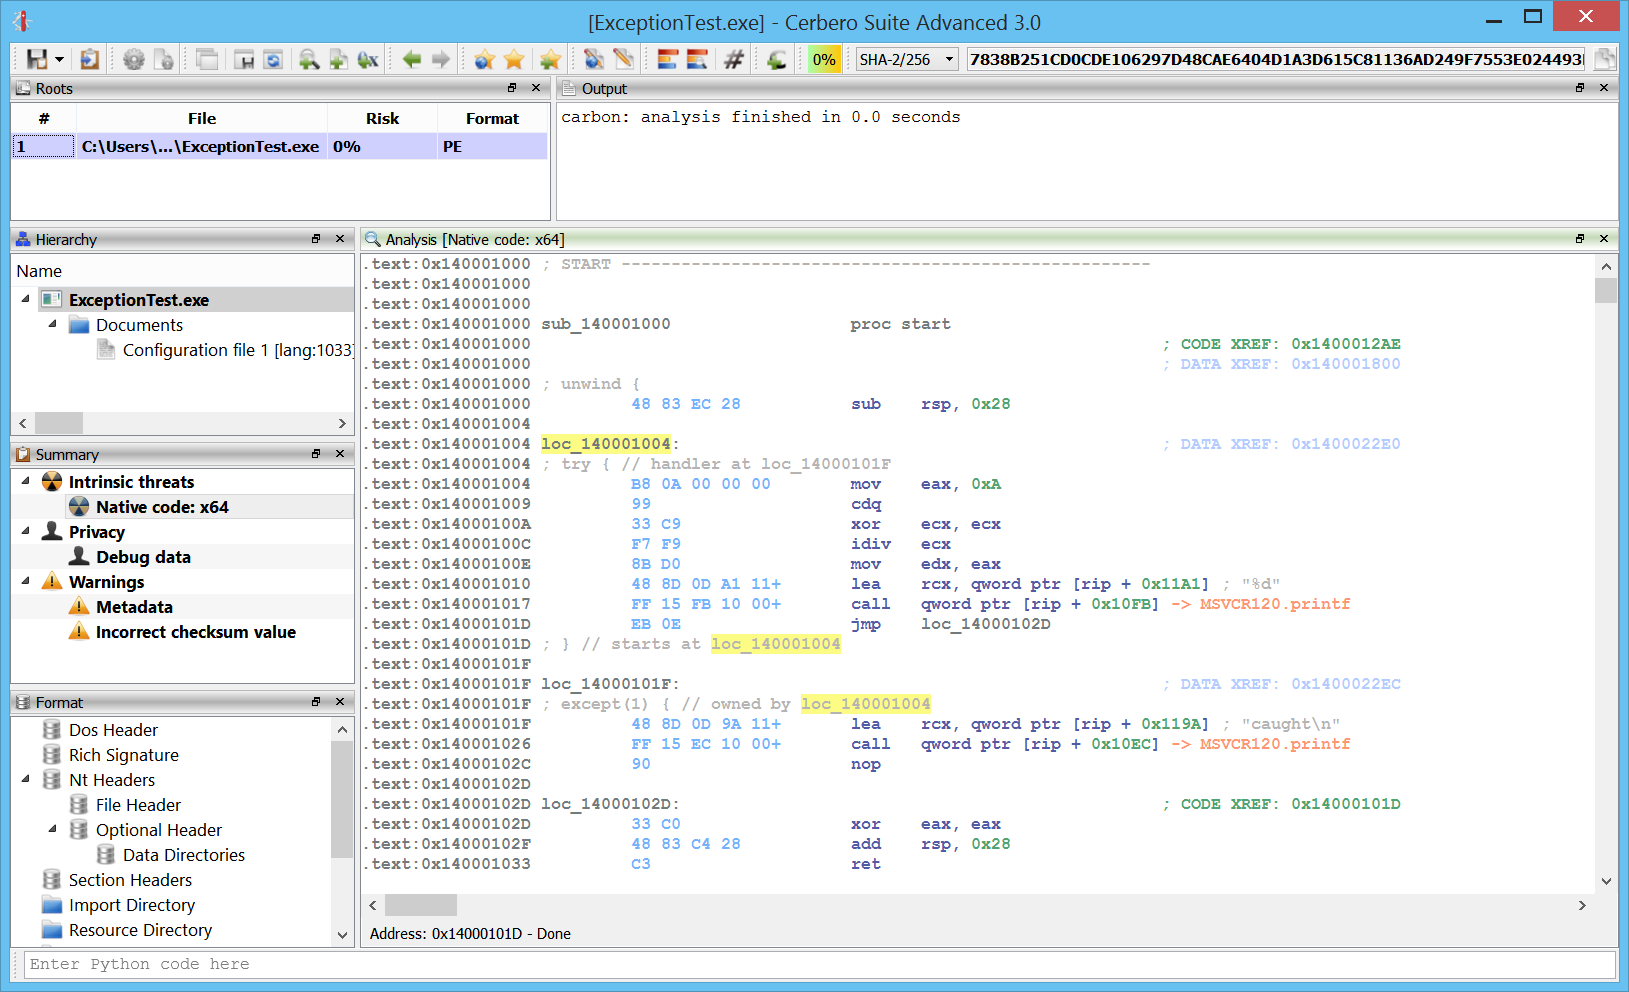
It is now possible to convert x64 shellcode to executable. In the past this feature was limited to x86 shellcode.

To handle x64 shellcode it is necessary to specify “AMD x64” as Machine.

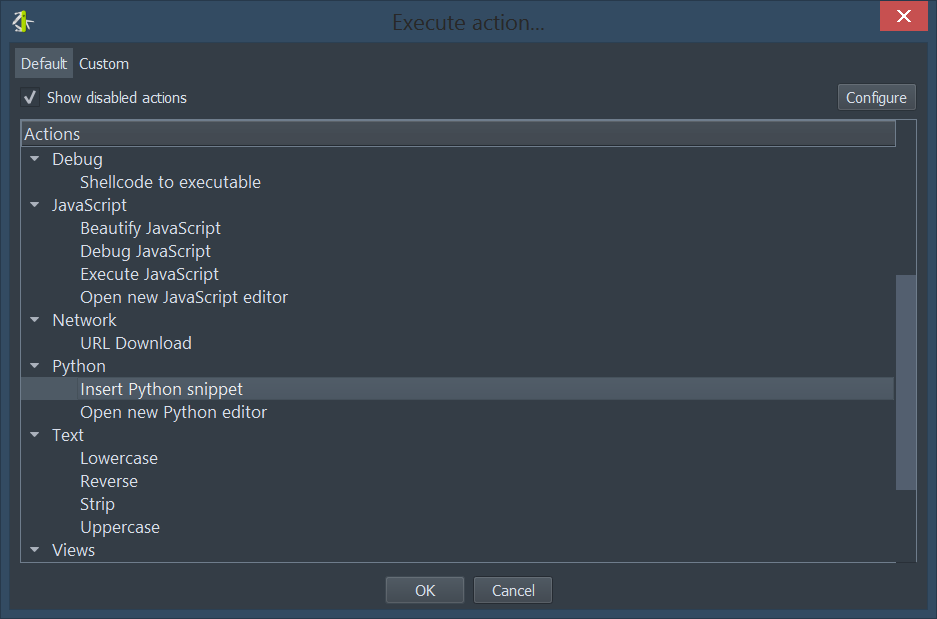
Text modification actions

When being in the context of a text editor, we can now use text actions to do some basic text operations like converting text to lowercase or uppercase or removing spaces.

Enjoy!

Profiler 2.8 – Windows Memory Forensics

Windows memory forensics on OSX.

Profiler 2.8 is out with the following news:

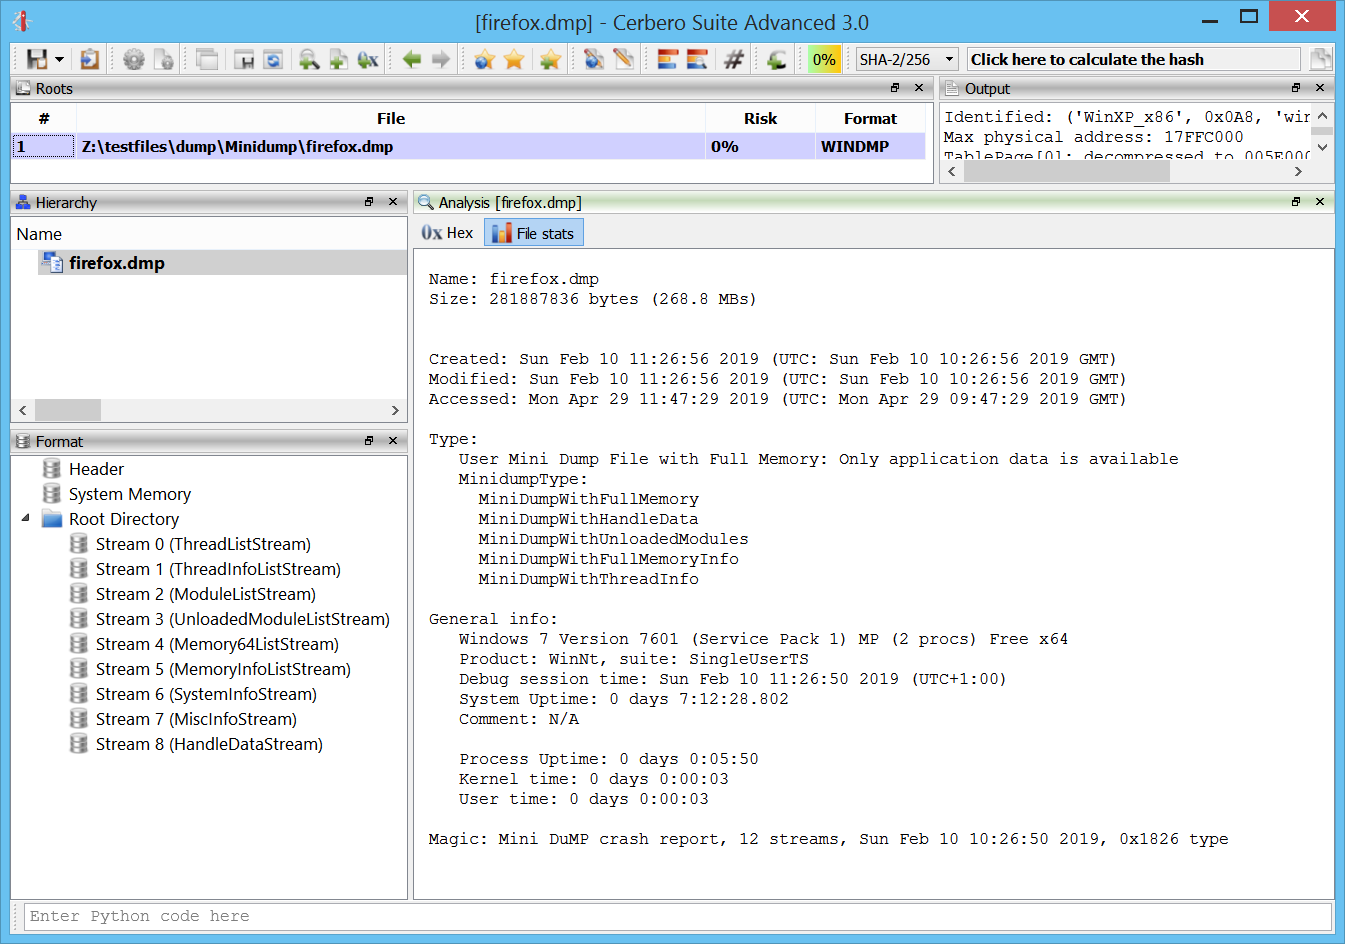
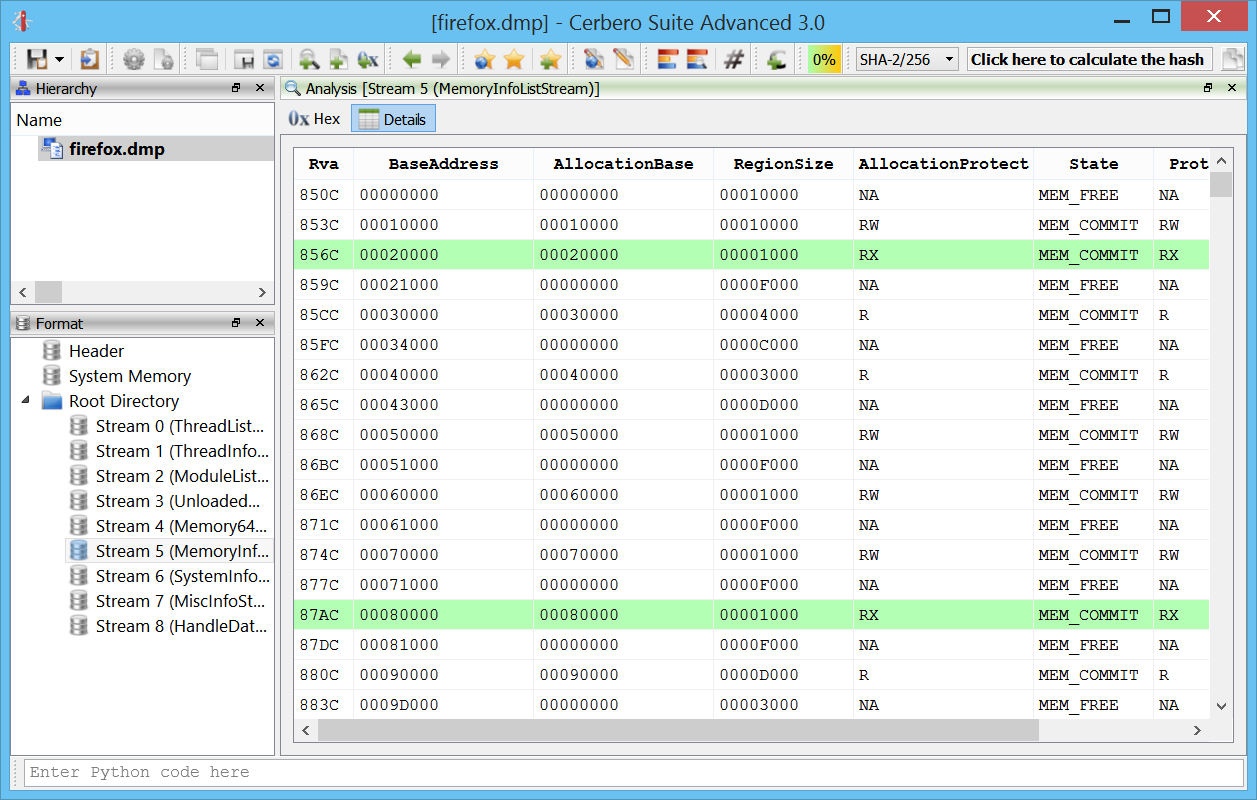
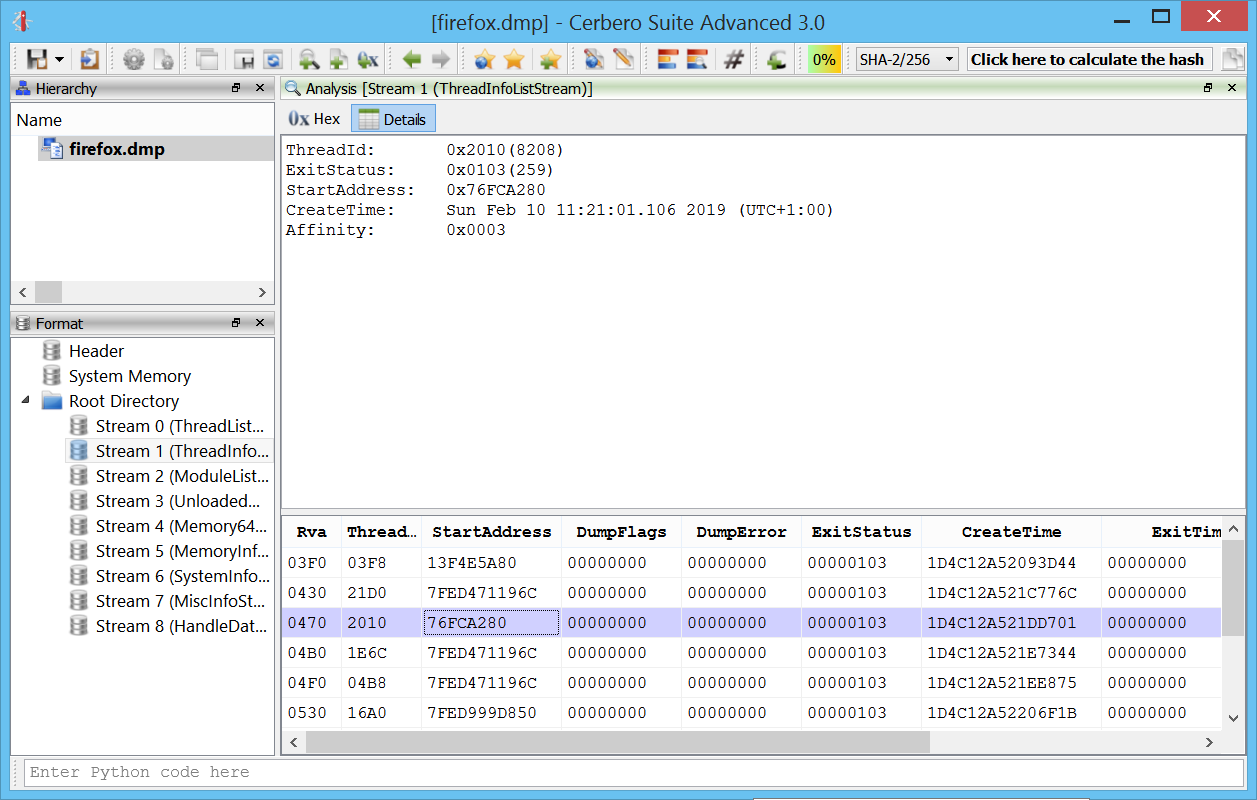
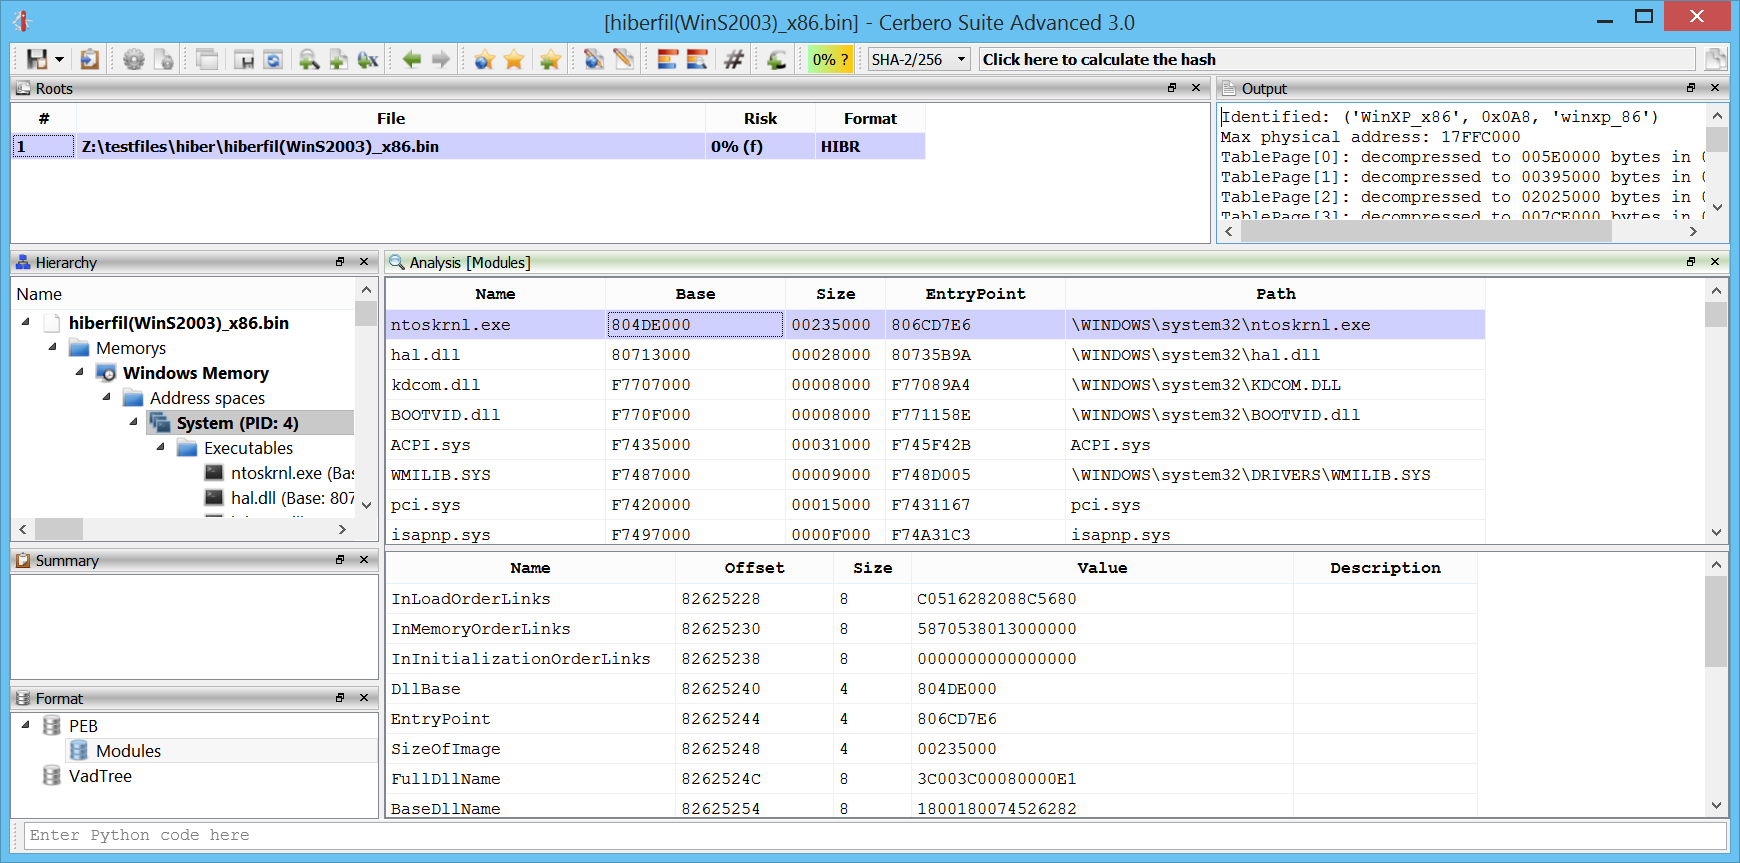
+ added support for Windows raw memory images
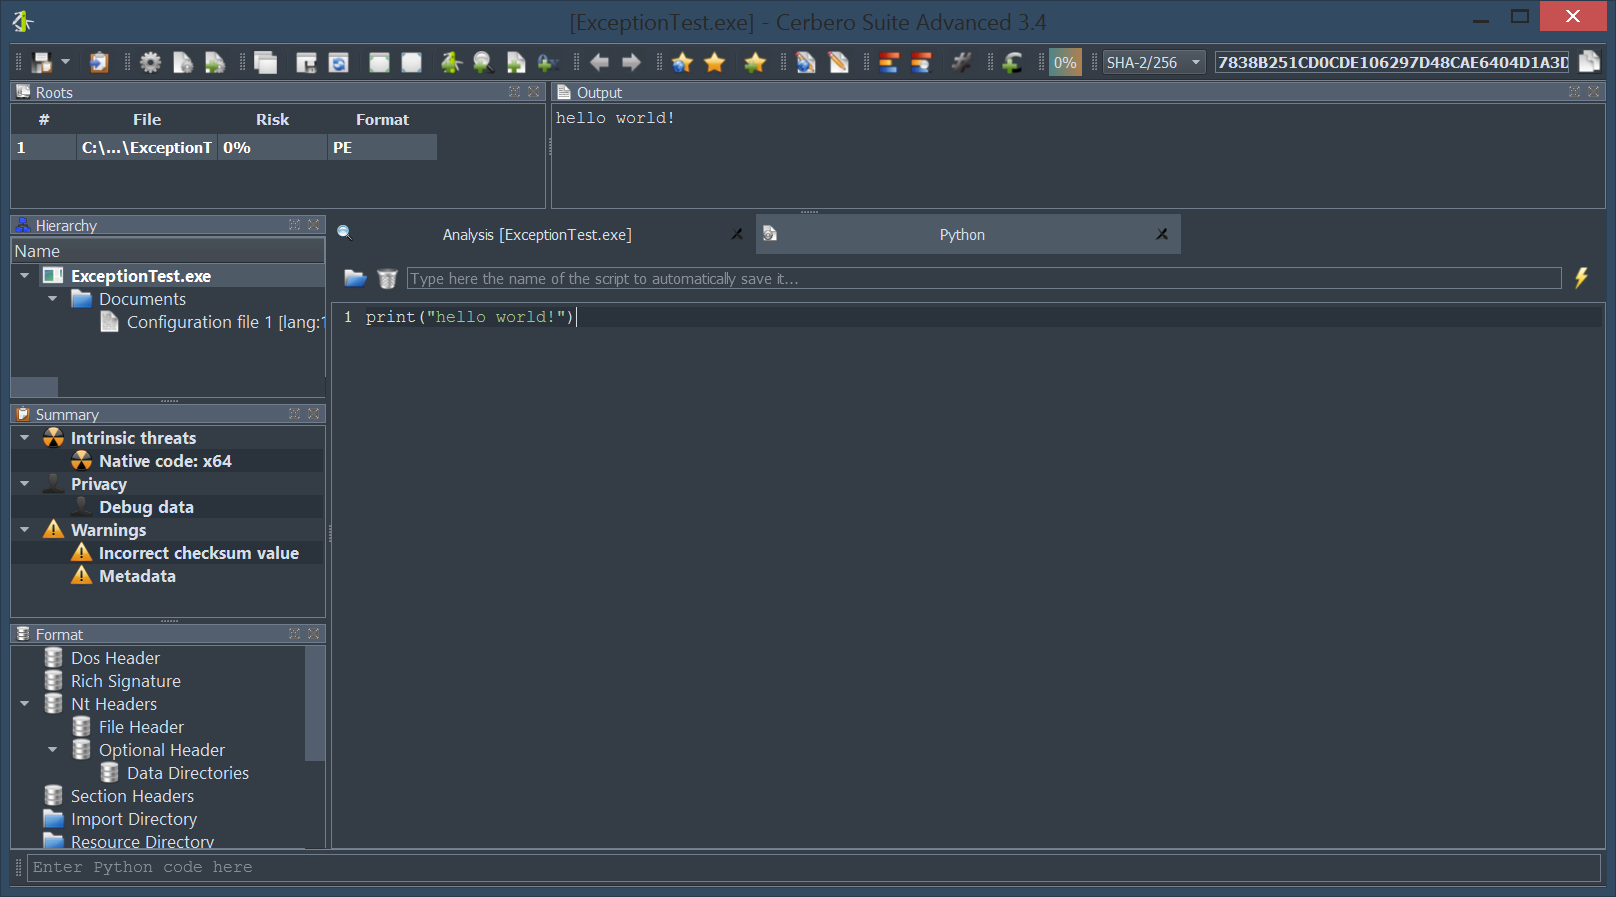
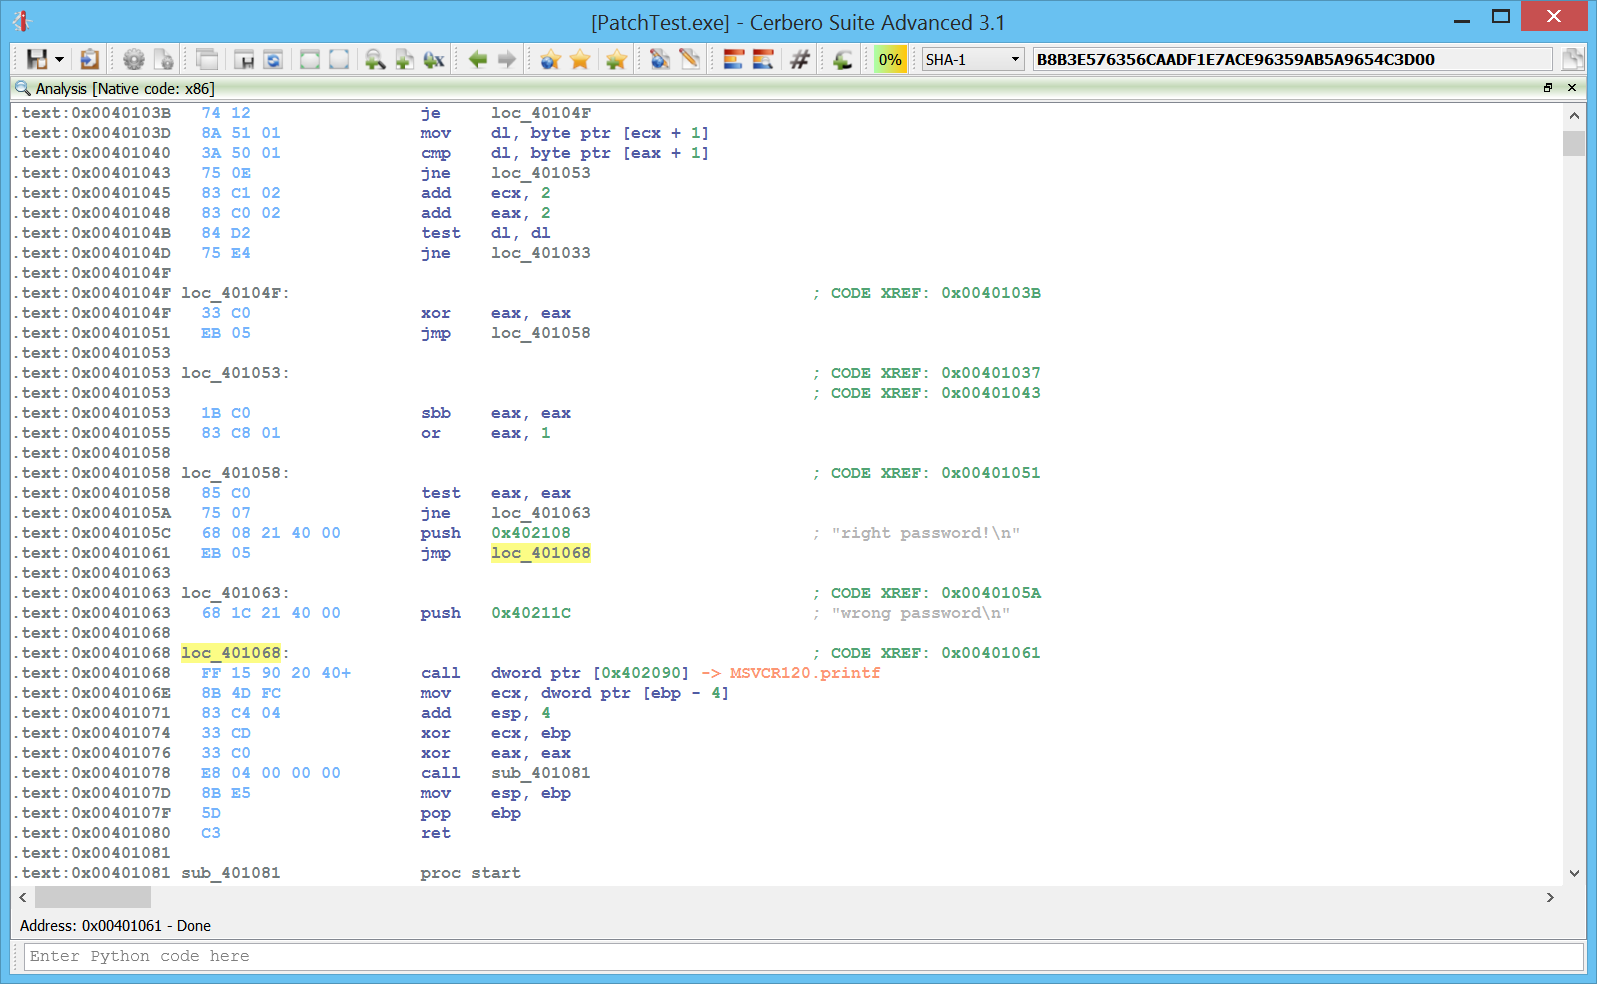
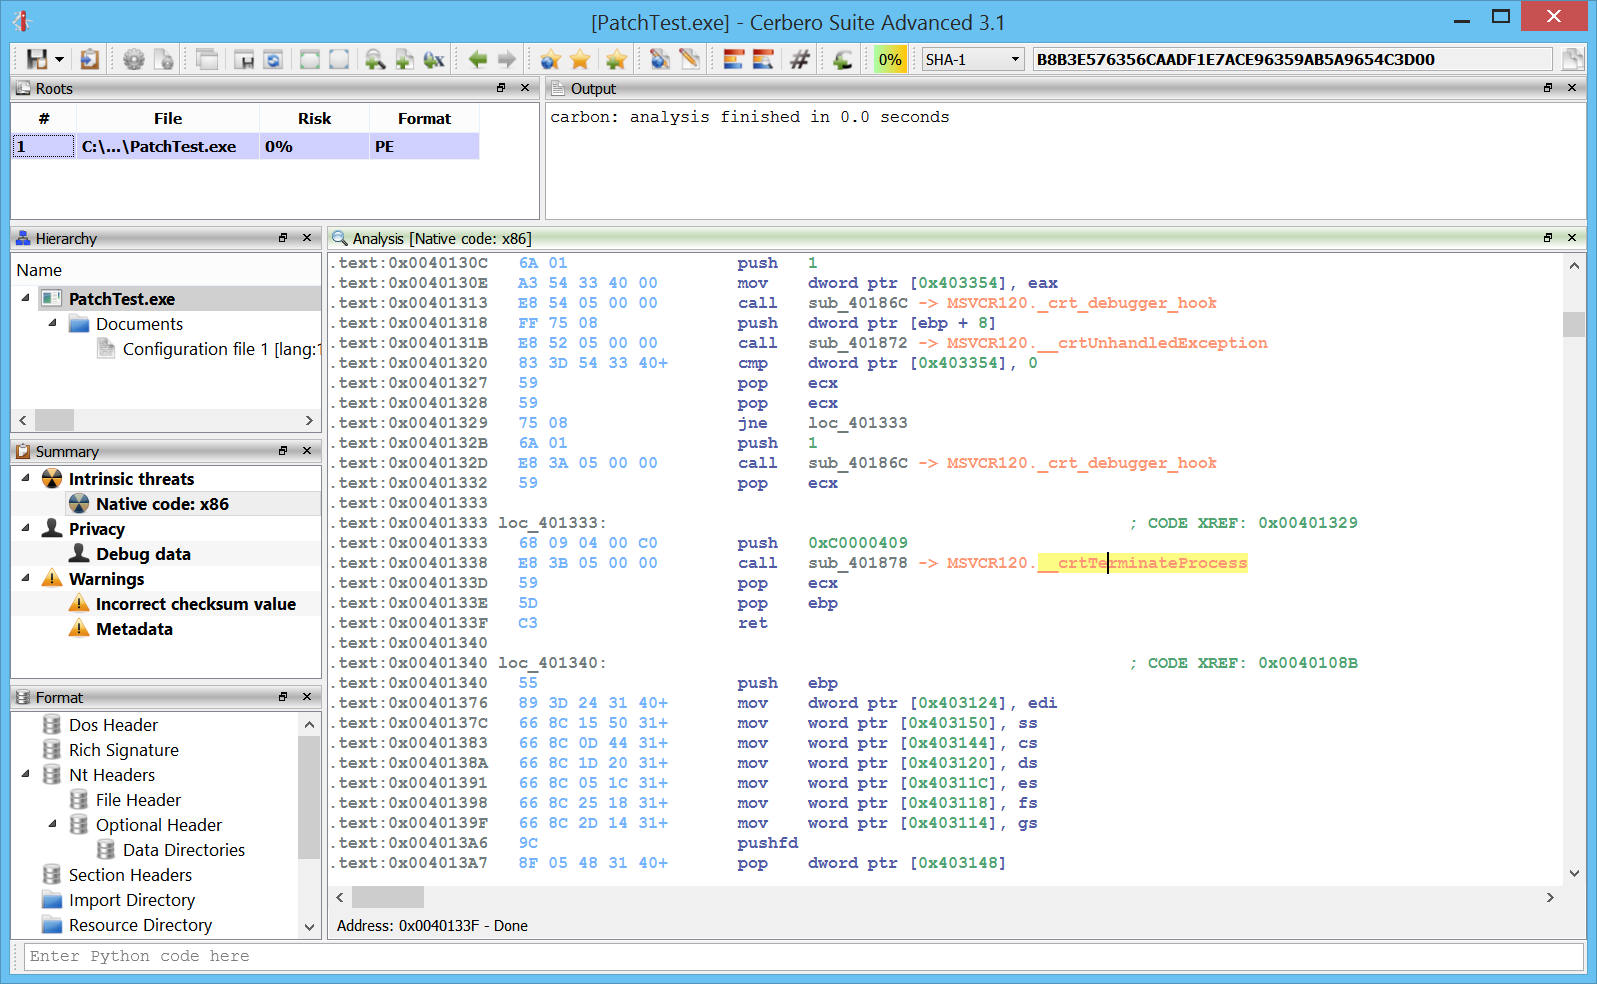
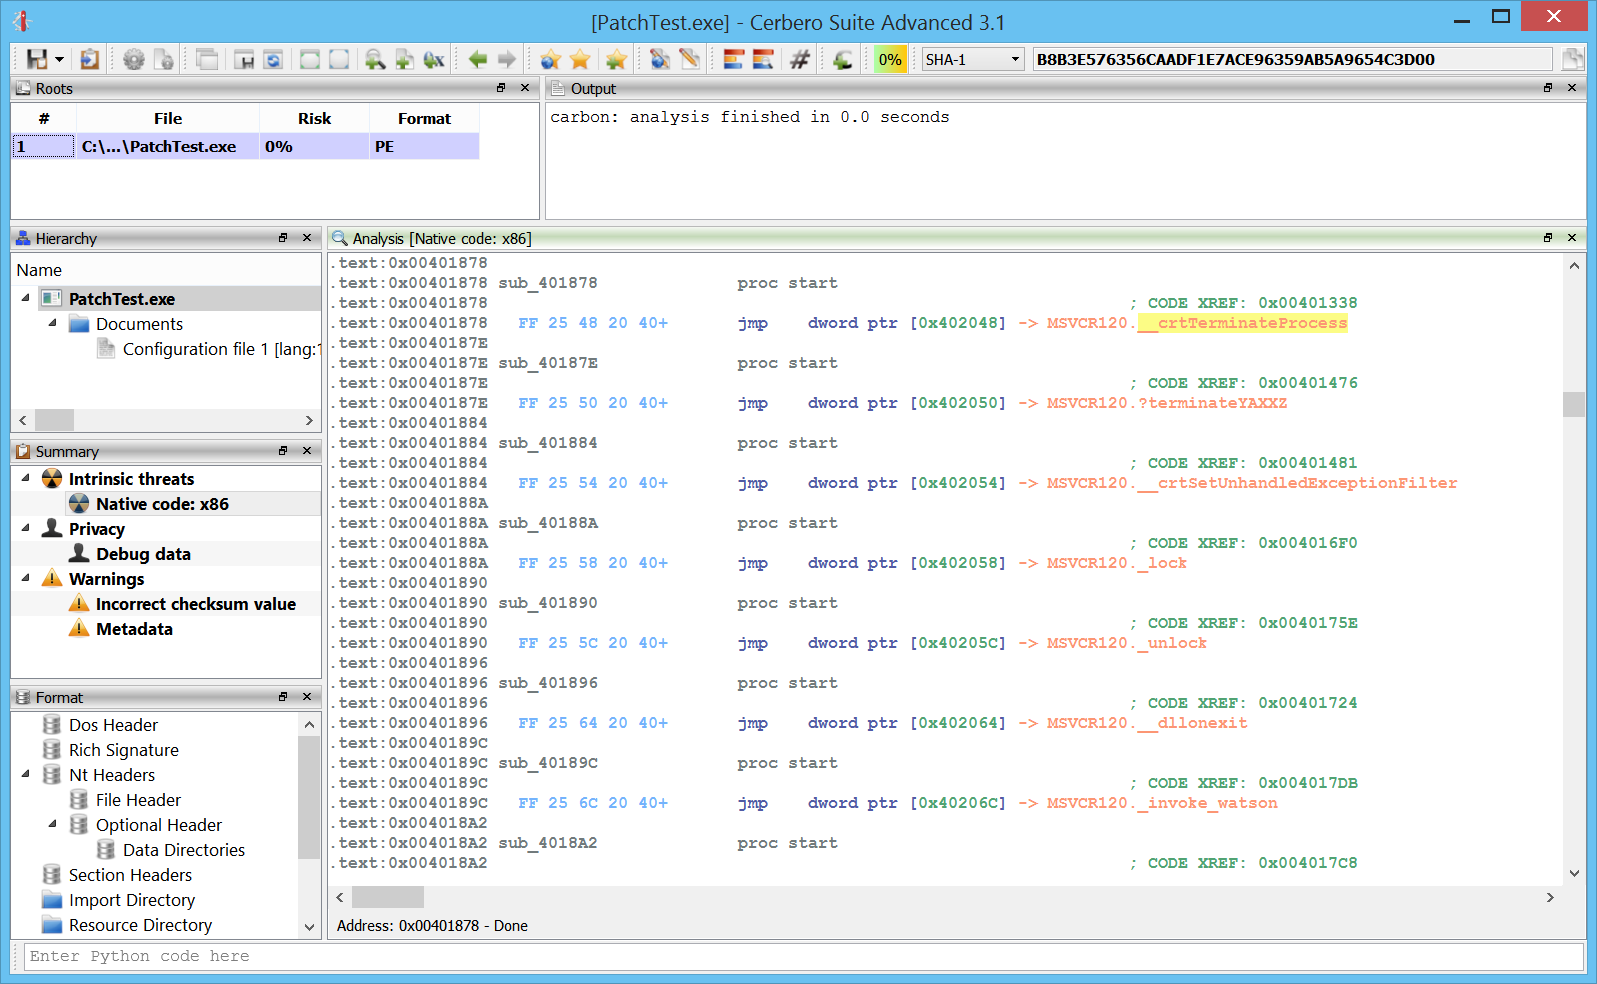
added unhandled exception debug tools on Windows
added unhandled exception notification for Python
– exposed tree control to the Python SDK
– improved CFBF support
– improved PDF parsing against new malware samples
– fixed PDB issue with zero-sized streams
– fixed issues in JBIG2 decoder
– fixed display of PE timestamps in UTC

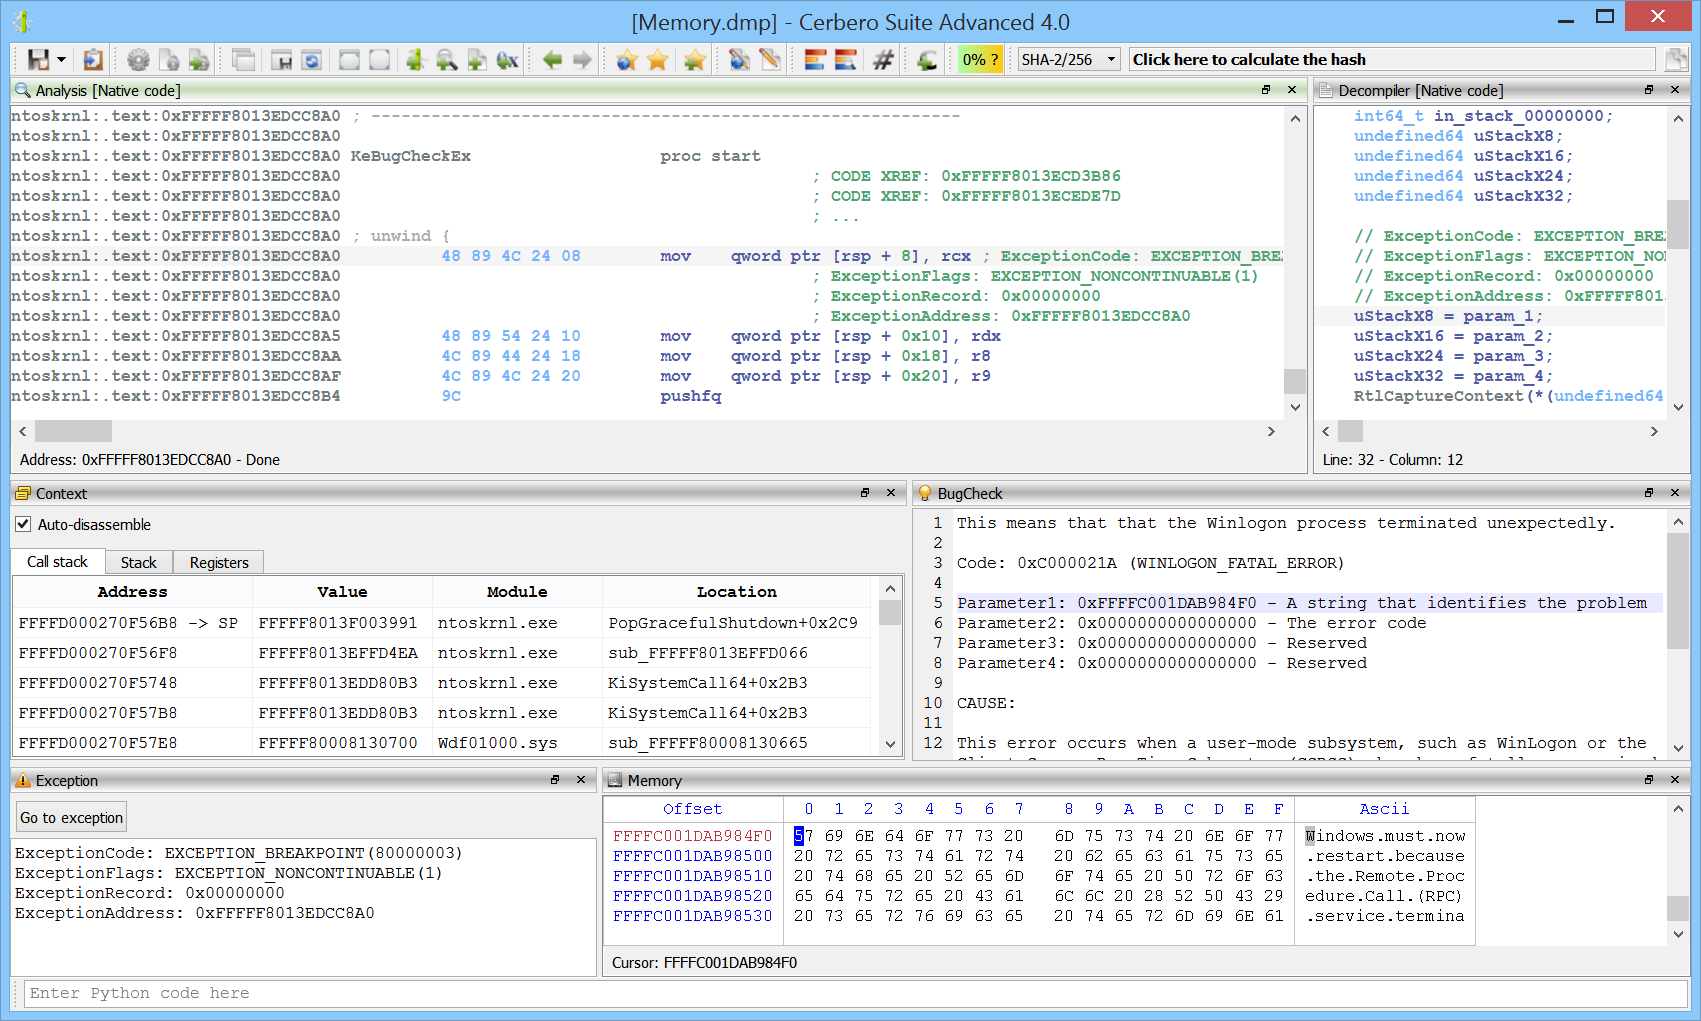
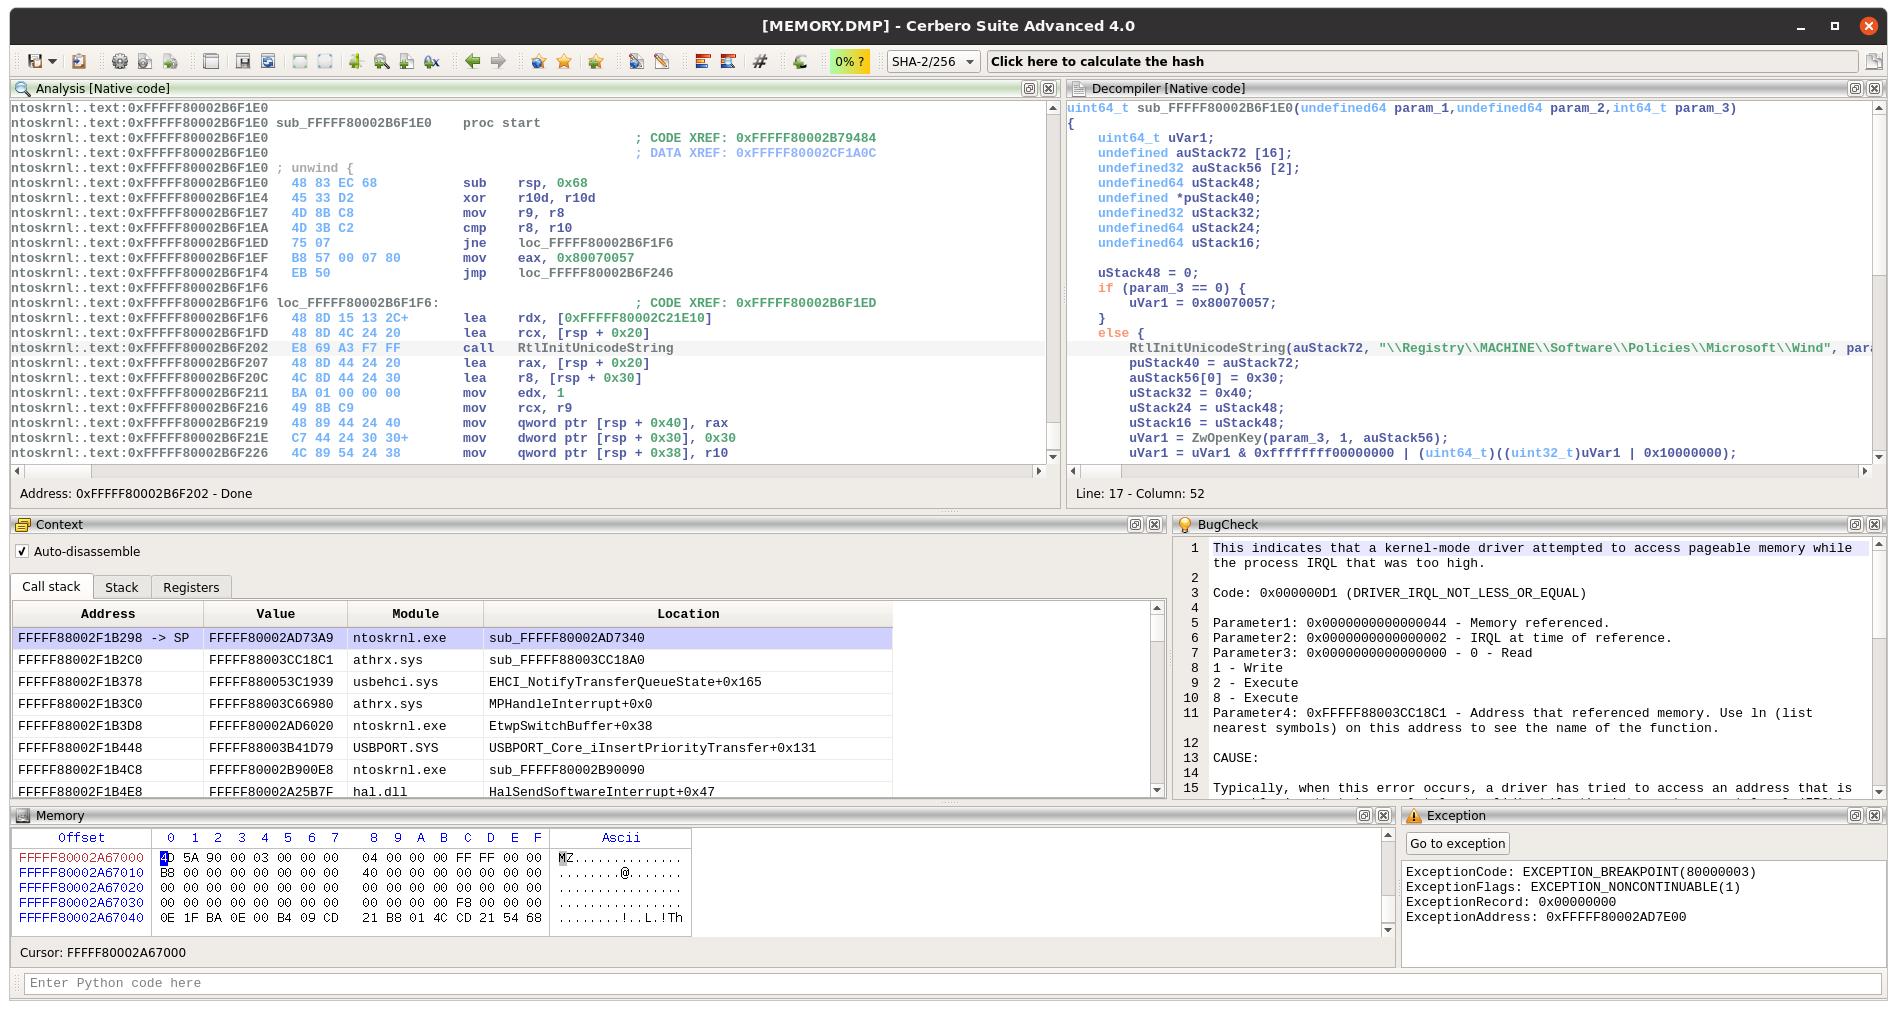
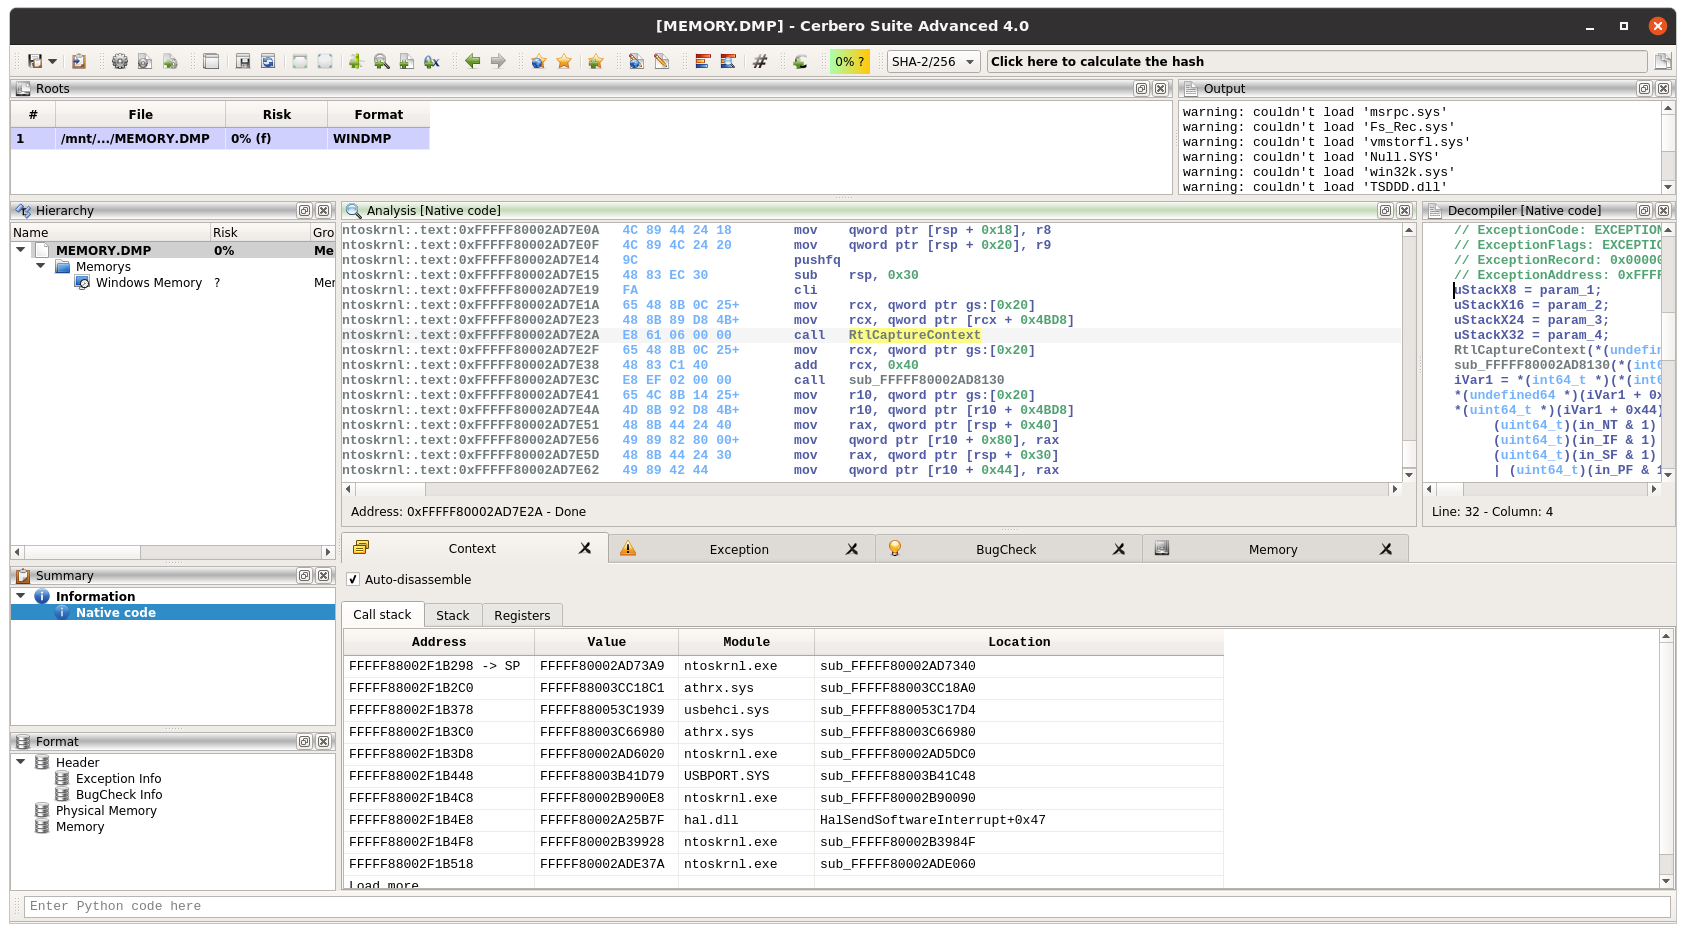
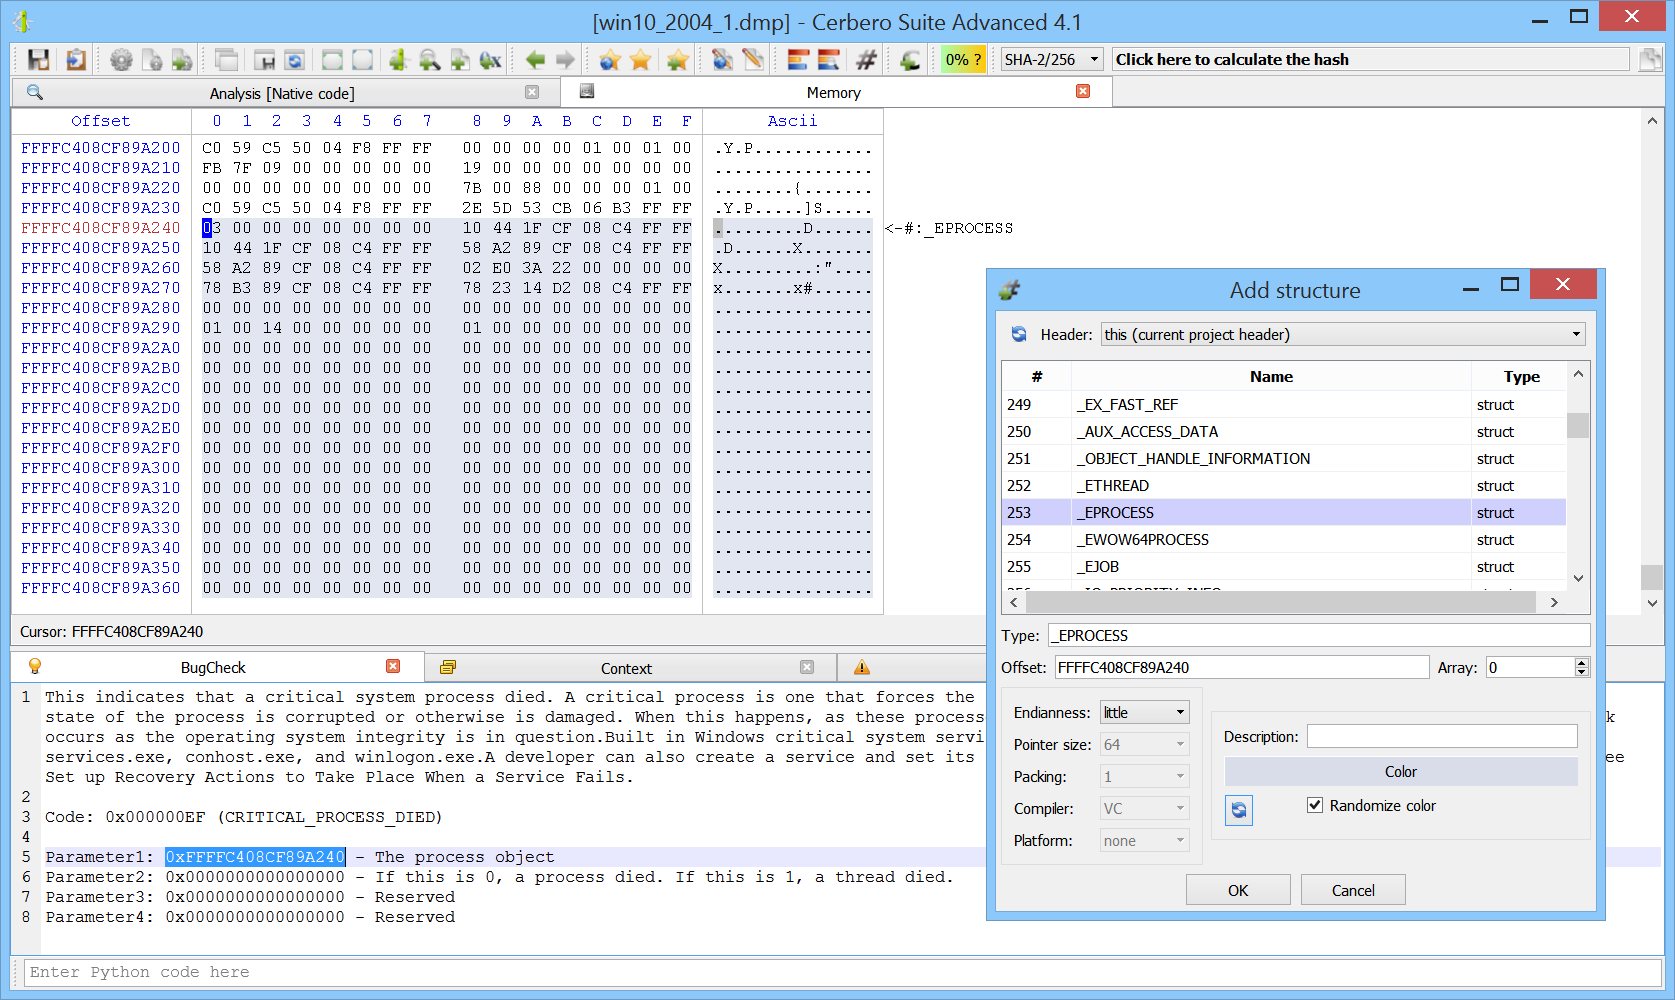
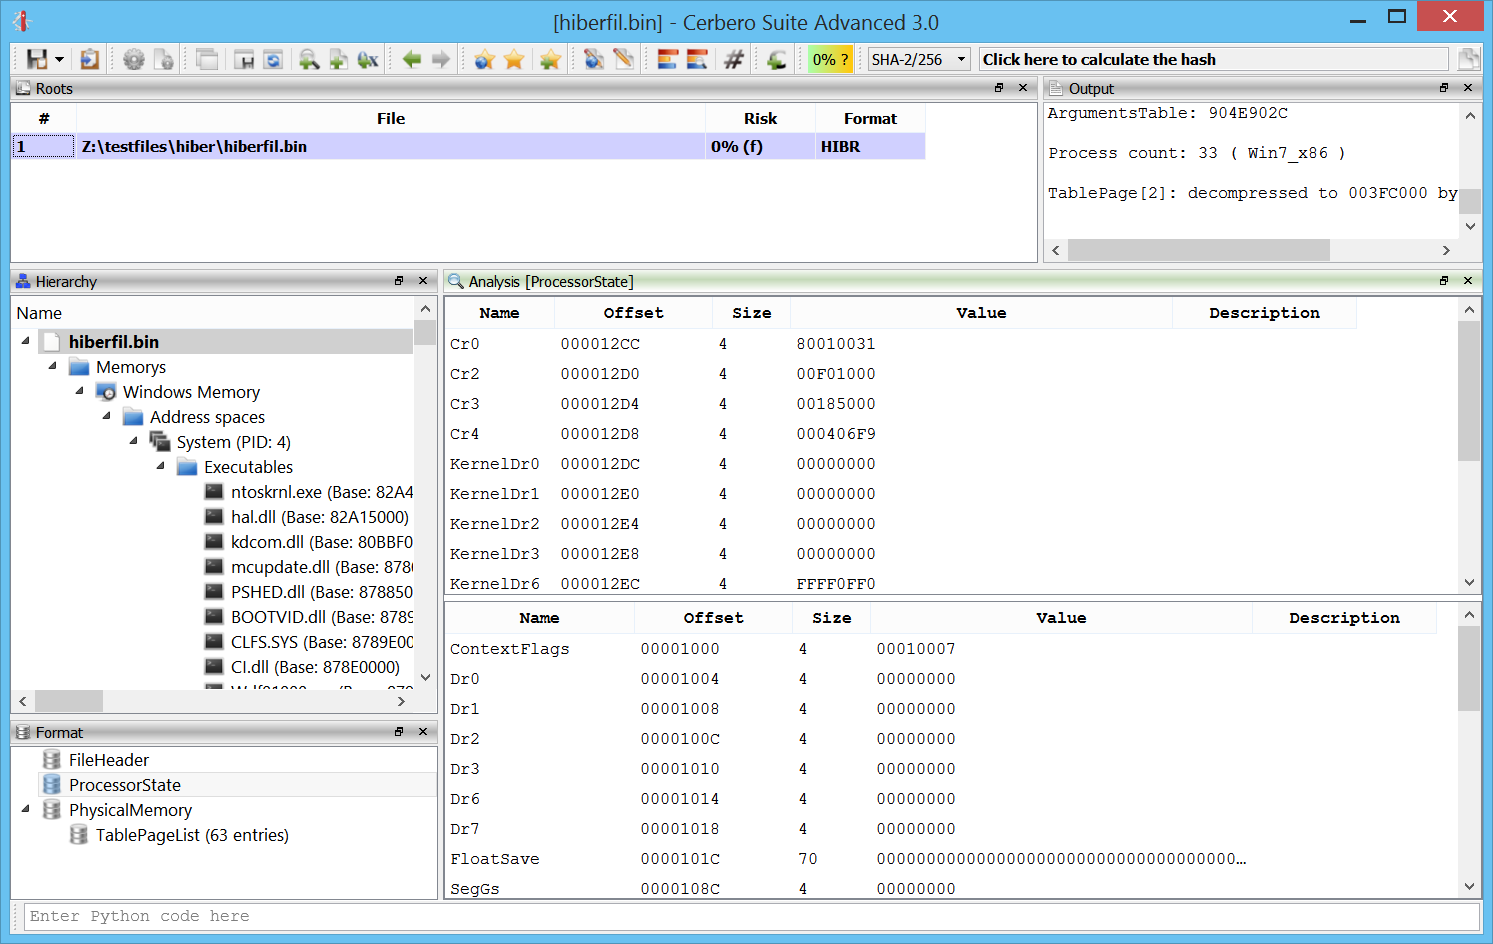
The biggest news is undoubtedly the introduction of Windows memory forensics support in the Advanced version of Profiler.

And here’s the same screenshot as above taken on Linux.

Improved Exception Handling

We have also drastically improved exception handling for both Python and native code, especially on Windows.

Whenever Python raises an unhandled exception a message box pops up on Windows and on other systems the exception is printed out to the terminal if it happens outside of the UI thread.

When the issue is more serious and results in a crash the user will be presented with the following message box on Windows.

If the crash happened from Python code, the user is given the possibility to retrieve a backtrace of the last executed Python methods.

If the crash happened in the native code, it’s now possible to create a dump file.

Enjoy!

Profiler 2.7

Profiler 2.7 is out with the following news:

+ added experimental support for Windows raw memory images
+ added support for EML files
+ added TOR-based URL download action
added JBIG2 decoder for PDFs
– improved PDF parsing against new malware samples
– improved search in hex view
– updated OpenSSL to 1.0.2
– updated Python to 3.6
– reduced dependencies on Linux
– fixed possible division by zero in PEObject::RvaToOffset
– fixed filter preview crash
– fixed Python multi-threading issue
– fixed PasteBin plugin
– fixed recognition of newer DEX files
– default to SHA-2/256 instead of SHA-1
– various bug fixes and improvements

With this version we also start to release the Advanced edition of Profiler. News entries marked by the ‘+’ sign are exclusive to the Advanced edition.

Experimental support for Windows raw memory images

Quite some time has passed since we published a post demonstrating some basic memory forensics capabilities in Profiler.

In this release of the Advanced edition we decided to publish that code, although barely functional. We didn’t want to additionally delay this long due release by working more on the memory forensic part. We will try to clean it up and make it more useful for the next release. 🙂

Enjoy!

Profiler Advanced

With the upcoming 2.7 version of Profiler, we will start releasing an Advanced edition alongside the Standard one. All our users who have bought a license until this point in time will automatically have their license work with the Advanced edition for free. This is our way to thank you for your trust!

Apart from support for Torrent files, all features which had been in the Standard edition until now will be kept there. The Advanced edition comes with new features and is especially designed for experts in the forensic and security field.

Each new version of Profiler will come with new features both in the Standard and Advanced edition. We will launch the Advanced edition with an early-adoption price.

Profiler 2.6

Profiler 2.6 is out with the following news:

– added initial support for XML files
– added support for XDP files (extraction of embedded PDFs)
– exposed the ABC format
– improved the parsing of malformed PDF streams
– fixed the code signing on OS X to meet El Capitan requirements
– fixed the JS debugger on Linux
– various bug fixes and improvements

Enjoy!

Profiler 2.5

Profiler 2.5 is out with the following news:

introduced scan provider extensions
added support for Torrent files
added the capability to display views as dialogs
exposed official Python bindings for capstone
– added new controls to custom views
– updated capstone to 3.0.3
fixed failed allocation security issue
– various bug fixes and improvements

Dialogs from views

In this new edition it’s possible to create dialogs out of views. Just like this:

ctx = proContext()
view = ctx.createView(ProView.Type_Custom, "Dialog title")
view.setup(view_layout, viewCallback, user_data)
dlg = ctx.createDialog(view)
dlg.show()

Of course, it doesn’t have to be a custom view, it can even be a simple text view or a hex view, although usually custom views make more sense for a dialog, as you’ll probably want to show some standard buttons like “Ok” and “Cancel” at the bottom.

Capstone bindings

While Capstone has been part of Profiler for quite some time now, now it’s possible to directly call its official Python bindings. The module can be found under ‘Pro.capstone’ and can be imported easily to be made working with existing code:

import Pro.capstone as capstone

Failed allocation security issue

In the Qt framework memory allocations fail silently, at least in the release version. We didn’t notice it, because in the debug version they would at least throw an exception preventing further execution. Since in release the execution wouldn’t be stopped, it was in some cases possible to trigger a failed allocation and then make the program use memory it didn’t own (so basically a buffer overflow). This problem has now been fixed.

Credit goes to the Insid3Code Team for having found and reported the issue.

Enjoy!

Profiler 2.4

Profiler 2.4 is out with the following news:

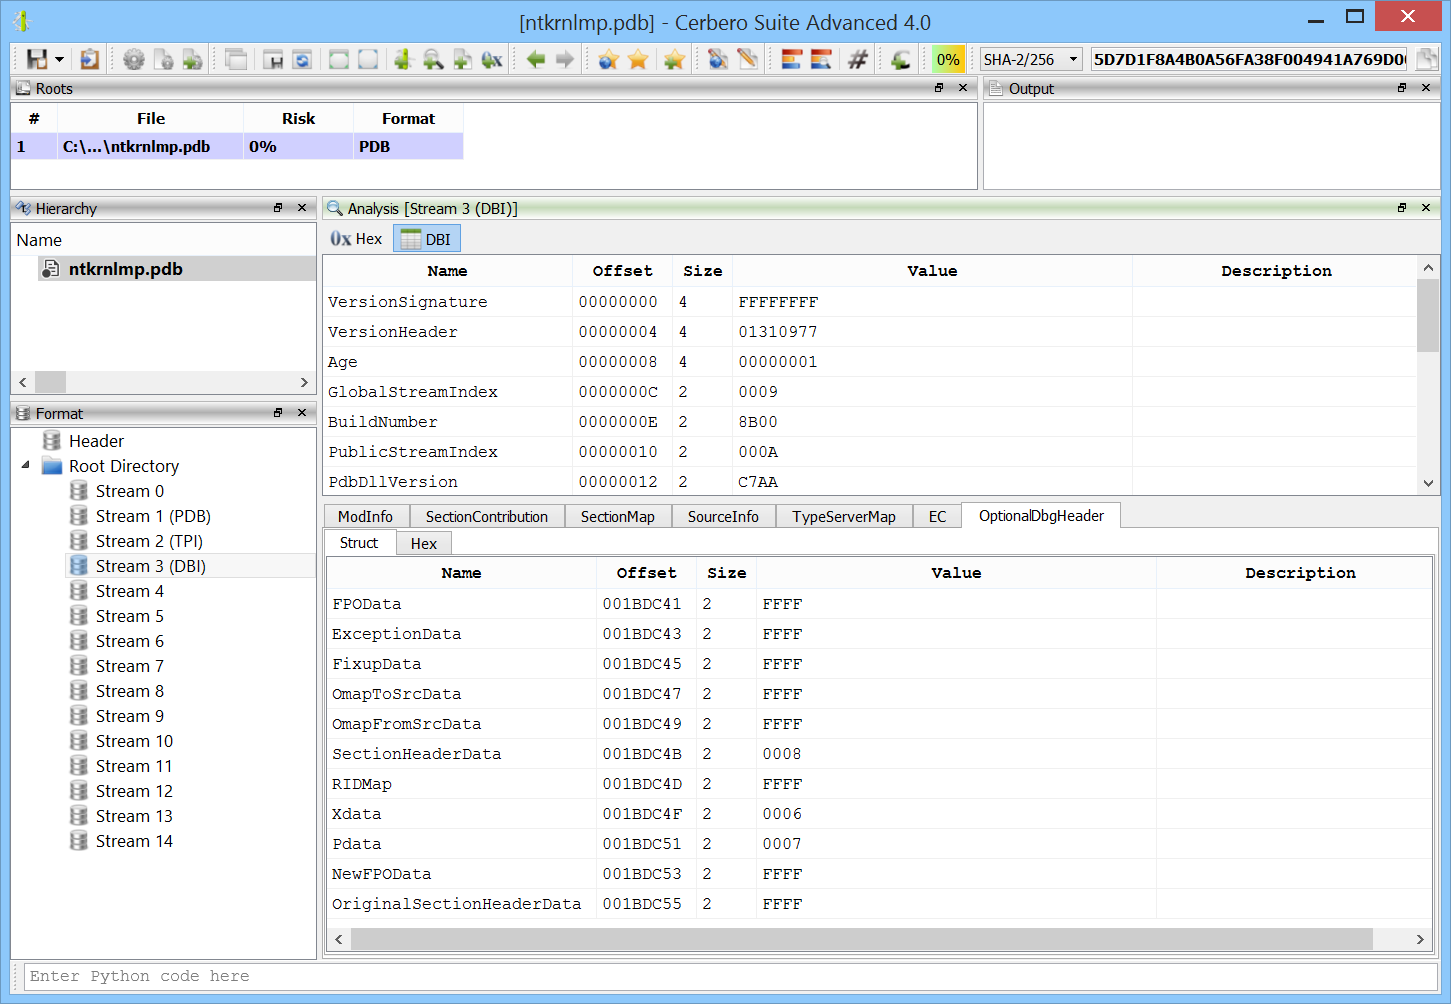
added initial support for PDB files (including export of types)
added support for Windows Encoded Scripts (VBE, JSE)
– introduced fixed xml structures
added automatic string decoding in struct tables
added Python string command line execution
– remember the last selected logic group
– fixed missing support for wchar_t in C types
– updated Qt to 5.4.1
– various bug fixes

While the most important newly introduced feature is the support for PDB files, here are some interesting new features:

Support for Windows Encoded Scripts (VBE, JSE)

Windows encoded scripts like VBE and JSE files (the encoded variants of VBS and JS script files) are now supported and automatically decoded.

In the screen-shot you can see the decoded output of an encoded file (showed at the bottom).

Automatic string decoding in struct tables

A very basic feature: byte-arrays in structures are automatically checked for strings and in case decoded.

(notice the section name automatically displayed as ascii string)

Python string command line execution

Apart from executing script files passed as command line arguments, now it is also possible to execute Python statements directly passed as argument.

For instance:

cerpro -c -e "from Pro.Core import *;proCoreContext().msgBox(0, \"Hello world!\")"

The optional argument ‘-c’ specifies to not display the UI.

Enjoy!

Profiler 2.3

Profiler 2.3 is out with the following news:

introduced YARA 3.2 support
added groups for logic providers
added Python action to encode/decode text
added Python action to strip XML down to text
added the possibility to choose the fixed font
added color randomization for structs and intervals
added close report and quit APIs
exposed more methods of the Report class (including save)
– improved indentation handling in the script editor
synchronized main and workspace output views
– improved output view
– updated libmagic to 5.21
– updated Capstone to 3.0
– many small improvements
– fixed libmagic on Linux
– removed the tray icon
– minor bug fixes

Logic provider groups

Logic providers can now be grouped in order to avoid clutter in the main window. Adding the following line to an existing logic provider will result in a new group being created:

group = Extra

Encode/decode text action

A handy Python action to convert from hex to text and vice-versa using all of Python’s supported encodings. Place yourself in a hex or text view and run the encoding/decoding action ‘Bytes to text’ or ‘Text to bytes’.

The operation will open a new text or hex view depending if it was an encoding or a decoding.

XML to text action

Strips tags from an XML and displays only the text. The action can be performed both on a hex and text view.

And it will open a new text view. This is useful to view the text of a DOCX or ODT document. In the future the preview for these documents will be made available automatically, but in the meantime this action is helpful.

Fixed font preferences

The fixed font used in most views can now be chosen from the ‘General’ settings.

Struct/intervals color randomization

When adding a structure or interval to the hex view the chosen color is now being randomized every time the dialog shows up. This behaviour can be disabled from the dialog itself and it’s also possible to randomize again the color by clicking on the specific refresh button.

Manually picking a different color for every interval is time consuming and so this feature should speed up raw data analysis.

Report APIs

Most of the report APIs have been exposed (check out the SDK documentation). This combined with the newly introduced ‘quit’ SDK method can be used to perform custom scans programmatically and save the resulting report.

Here’s a small example which can be launched from the command line:

from Pro.Core import *
import sys
 
ctx = proCoreContext()
 
def init():
    ctx.getSystem().addFile(sys.argv[1])
    return True
 
def rload():
    ctx.unregisterLogicProvider("test_logic")
    ctx.getReport().saveAs("auto.cpro")
    ctx.quit()
 
ctx.registerLogicProvider("test_logic", init, None, None, None, rload)
ctx.startScan("test_logic")

The command line syntax to run this script would be:

cerpro -r scan.py [file to scan]

The UI will show up and close automatically once the ‘quit’ method is called. Running this script in console mode using the ‘-c’ parameter is not yet possible, because of the differences in message handling on different platforms, but it will be in the future.

Synchronized output views

The output view of the main window and of the workspace are now synchronized, thus avoiding missing important log messages being printed in one or the other context.

Enjoy!

Profiler 2.1 (Mac OS X support)

The new version of Profiler is out and it includes support for Mac OS X!

Here’s the change-list for the current version:

– ported Cerbero Profiler to MacOSX
– added command-line scripting support
– updated Header Manager to Clang 3.5
– improved parsing of PE Delay Import Descriptors
– fixed some small issues

Enjoy!