Profiler 2.9.1 is out with the following news (entries with the plus sign apply only to the advanced edition):
+ added parsing of Windows heap
+ added file detection in memory regions and heap
+ added file detection in memory regions and heap via libmagic
– added CCITTFax decoder for PDFs
– added detection of DDE field codes
– added support for 64-bit shellcode to executable
+ added display of page flags in hex views
– added actions for text modification
– added action to dump mapped PEs to disk
+ added signature for automatic recognition of EML files
+ improved identification speed of raw Windows memory images
+ improved loading speed of raw Windows memory images
+ improved scanning speed of memory images
+ improved global address space hex view
+ improved user address space view
– improved fault tolerance of the XML parser
– improved CFBF support
– improved support of embedded OLE objects
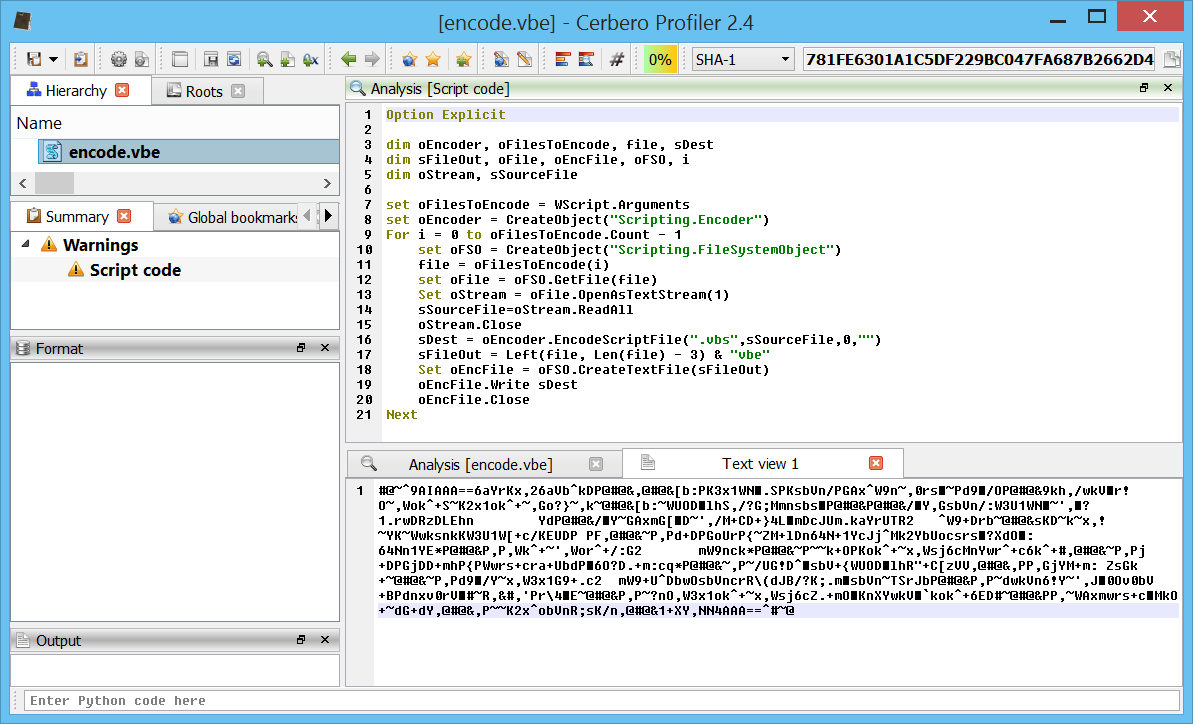
– improved extraction of VBA code
– improved PDF decryption
– updated SQLite to 3.21.0
– updated libmagic to 5.32
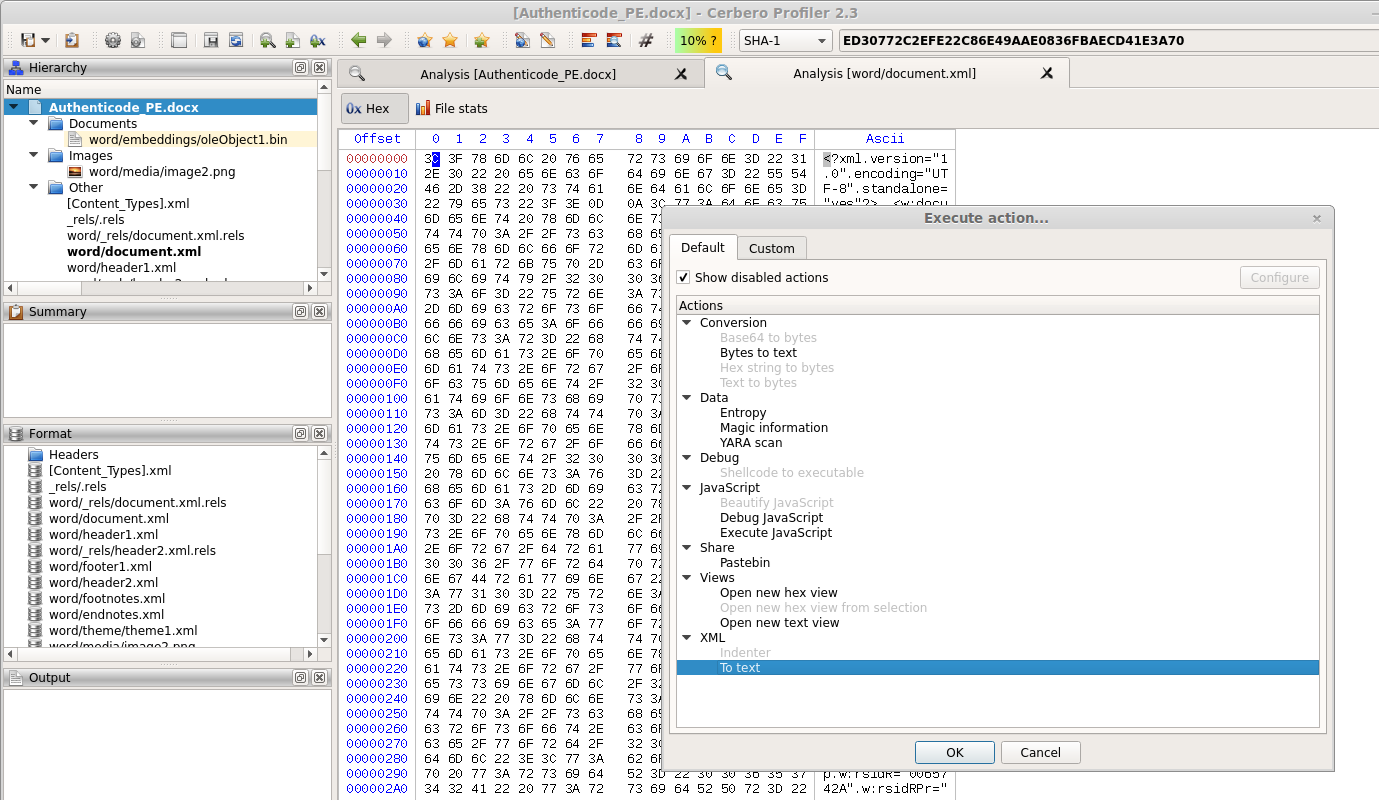
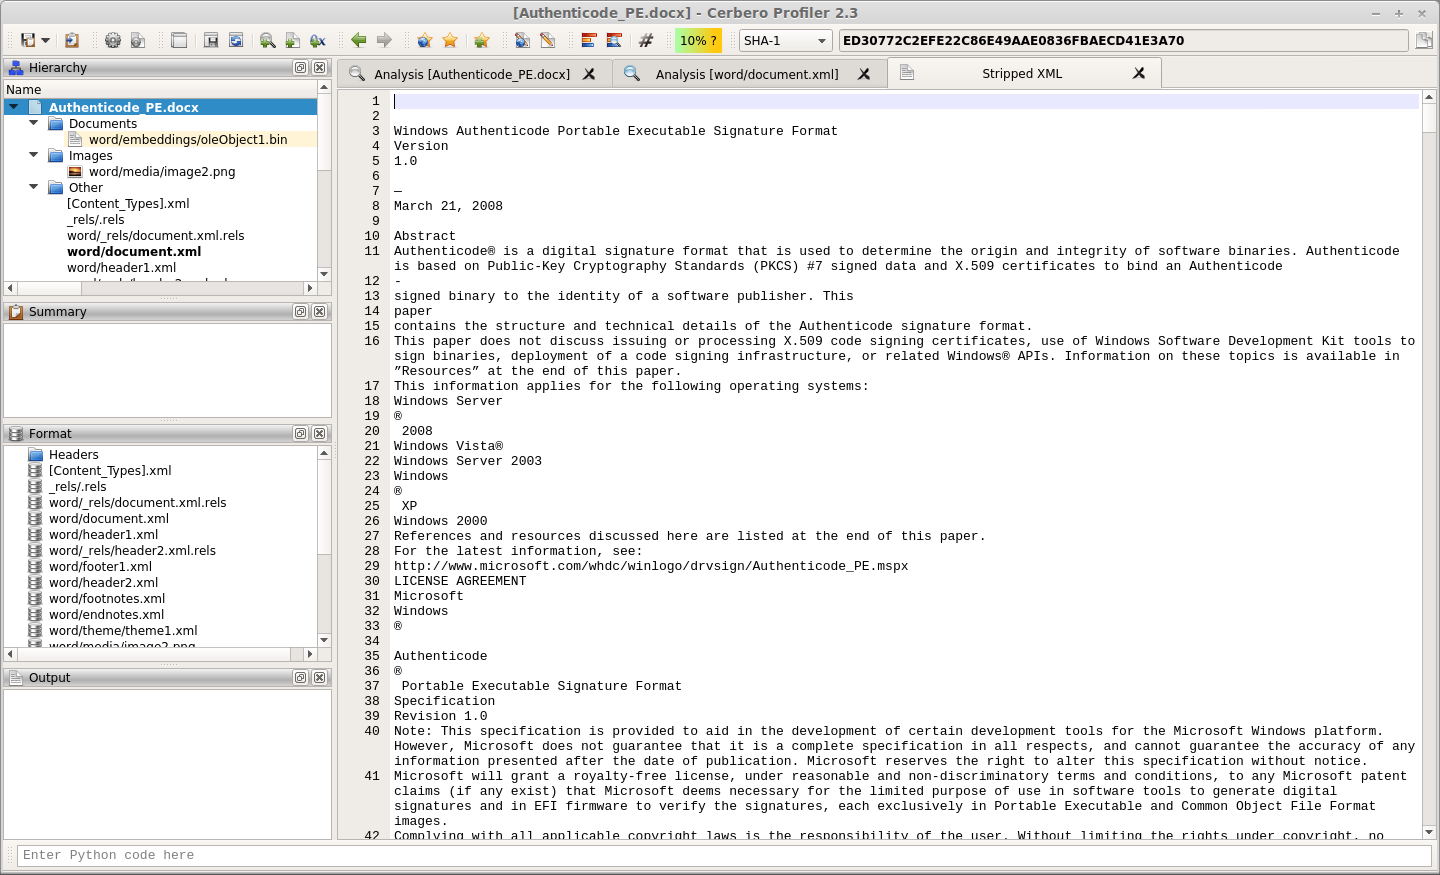
– fixed XML to text action
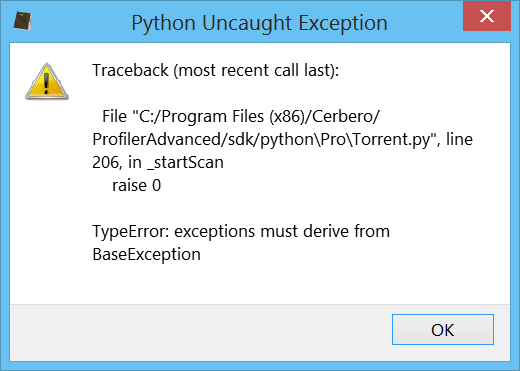
– fixed Python multithreading issues
– fixed many small issues
– removed PasteBin action
We’ve waited for the official announcement of the new release, because we wanted to pack some more features inside 2.9.1!
After this edition, we will continue to release minor versions, while preparing a major 3.0 edition scheduled for the second half of this year.
Windows memory image identification speed
One of the main things we improved in 2.9 is the speed of opening memory images. The user has now the option whether or not to scan files in memory. Most of the times scanning files in memory is not needed and makes the opening of a memory image unnecessarily slow.
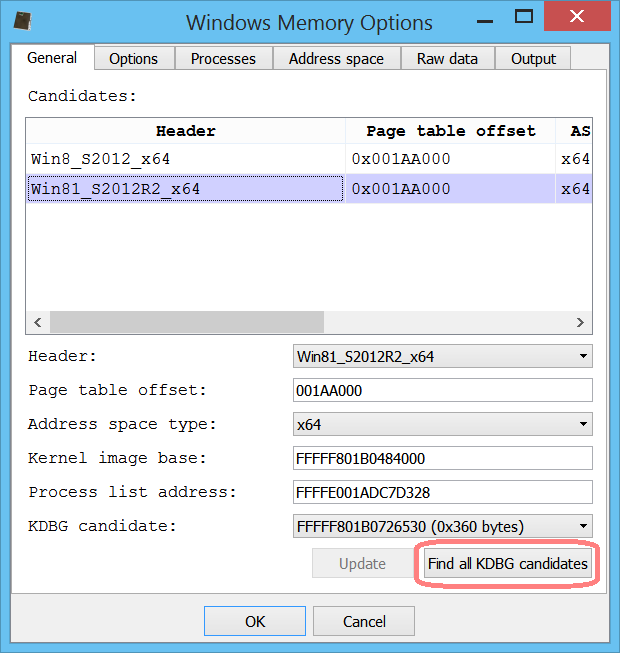
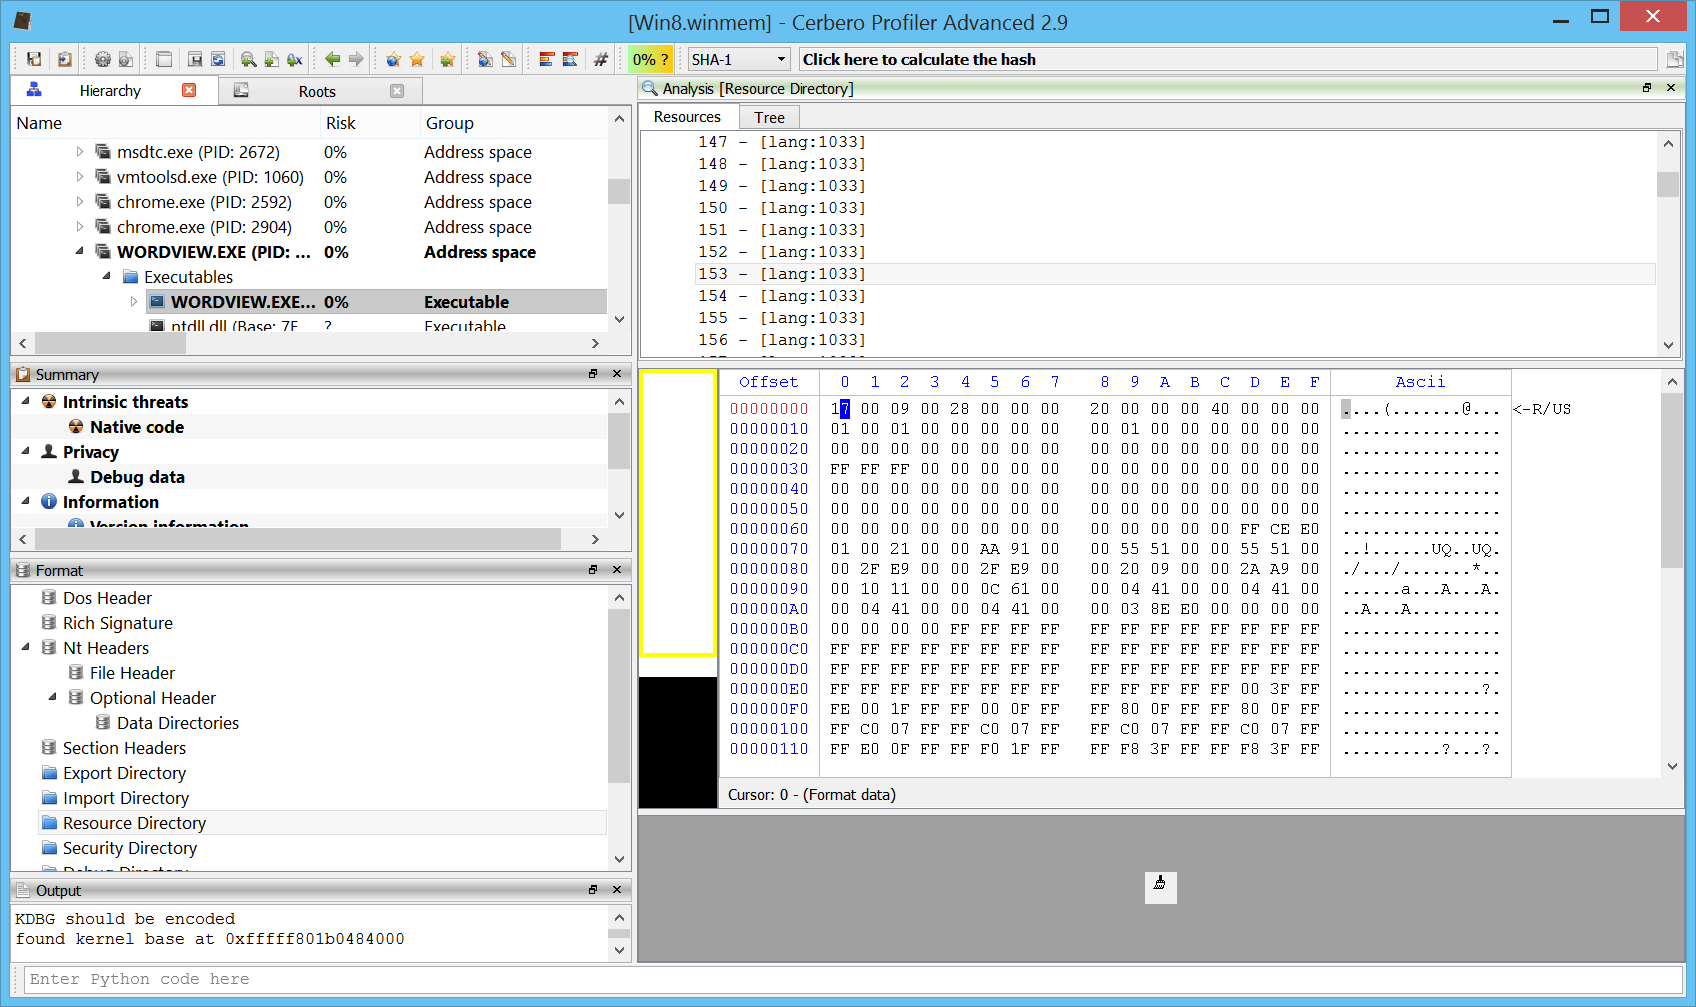
Version 2.9.1 comes with an additional very important speed improvement: the options dialog will pop up at the first occurrence of a valid KDBG structure. The user can still opt to look for additional KDBG structures as highlighted in the screenshot below.
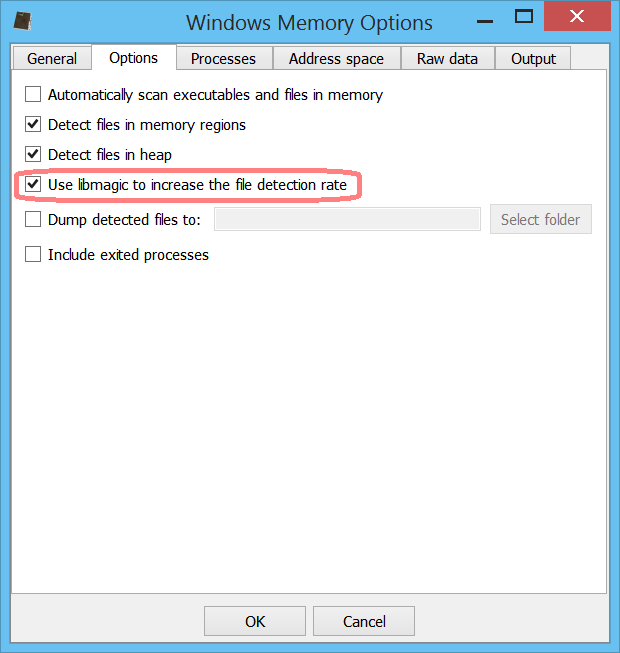
Memory file detection via libmagic
The main addition in version 2.9.1 versus 2.9.0 is the capability to increase the file detection rate of files in memory using libmagic.
We can dump all files detected to disk as well.
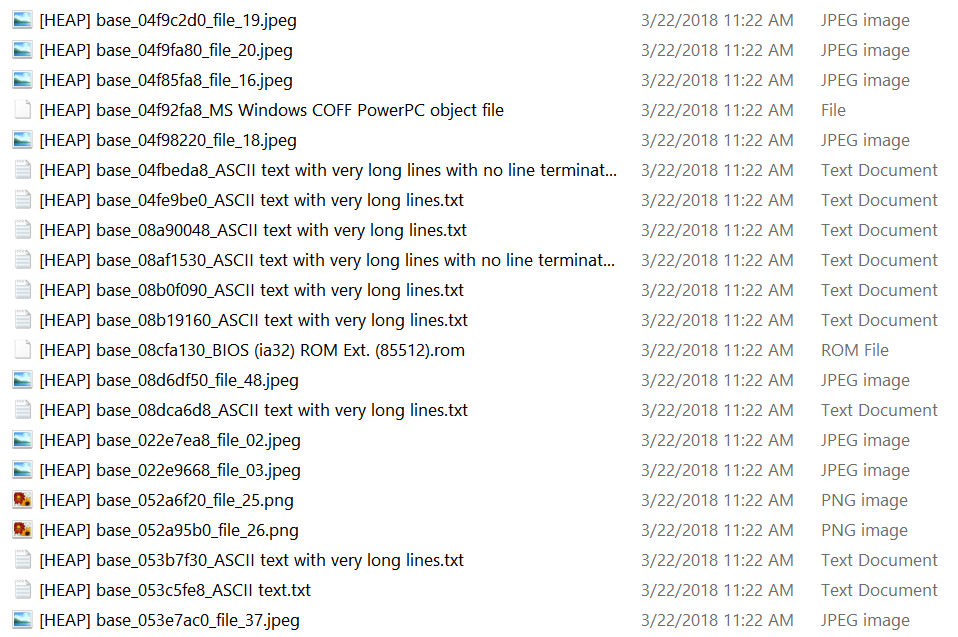
While libmagic increases the detection rate, it also adds many false positive. A nice effect of using libmagic is the detection of text files and scripts.
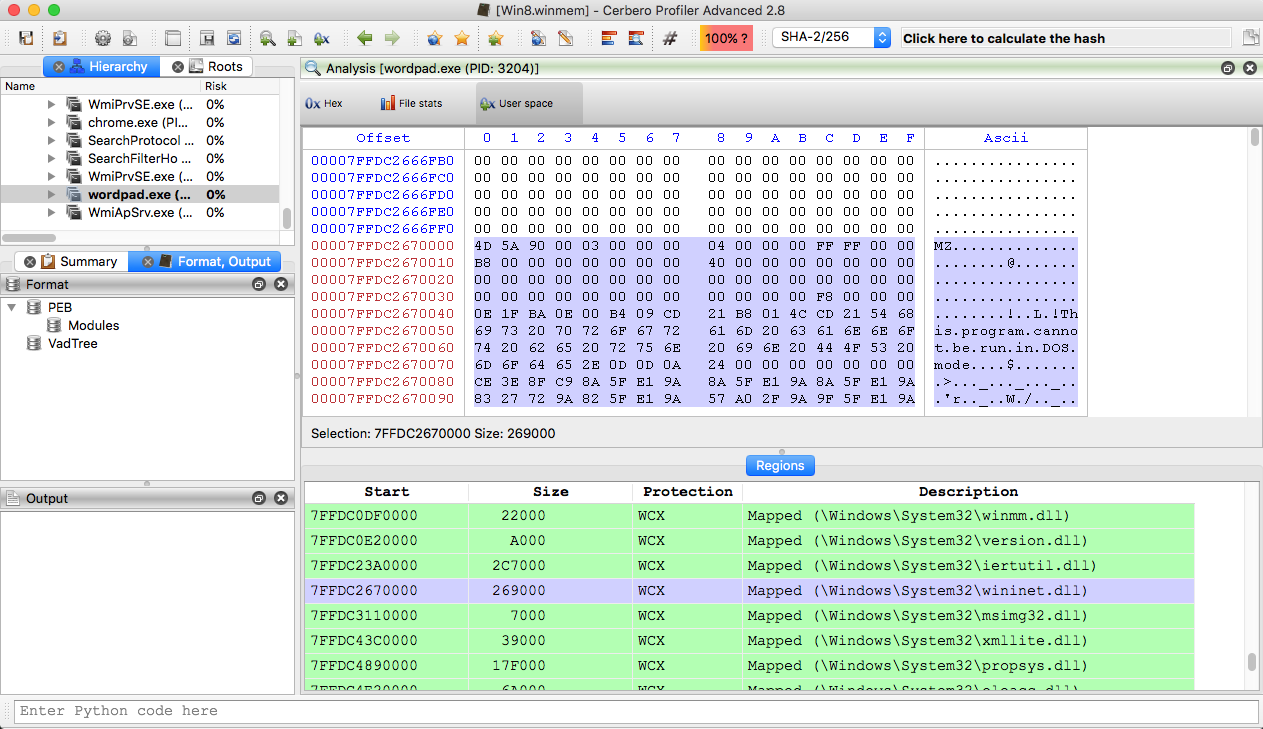
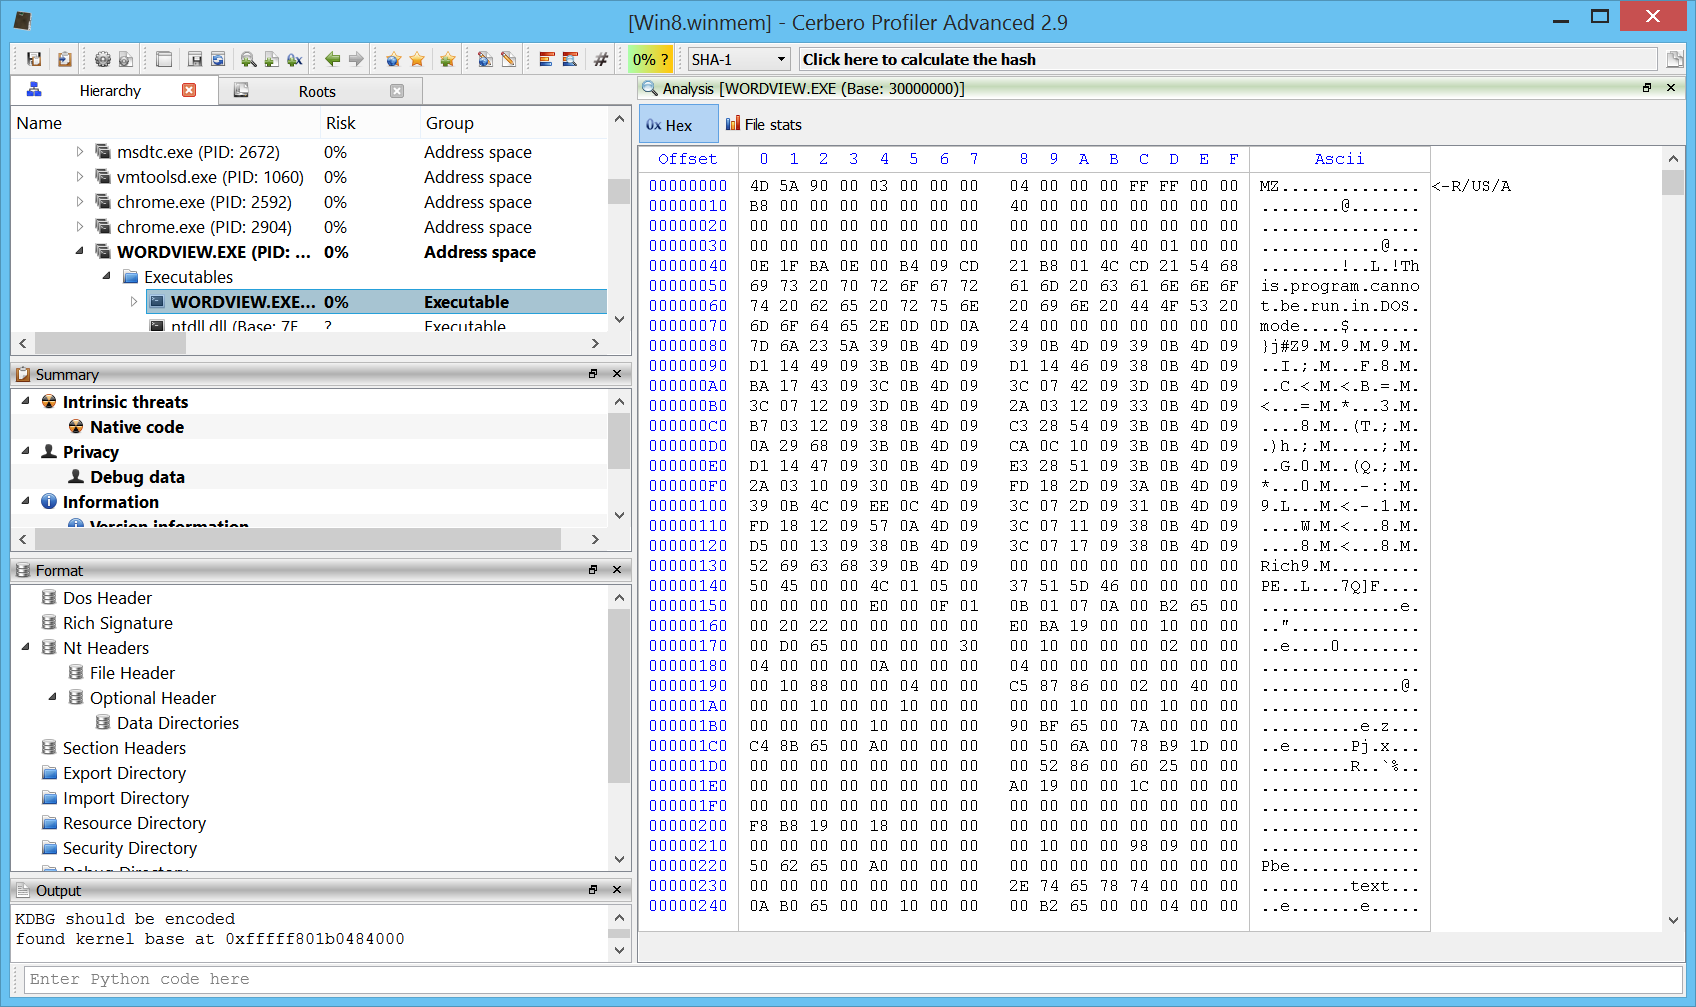
Memory page flags
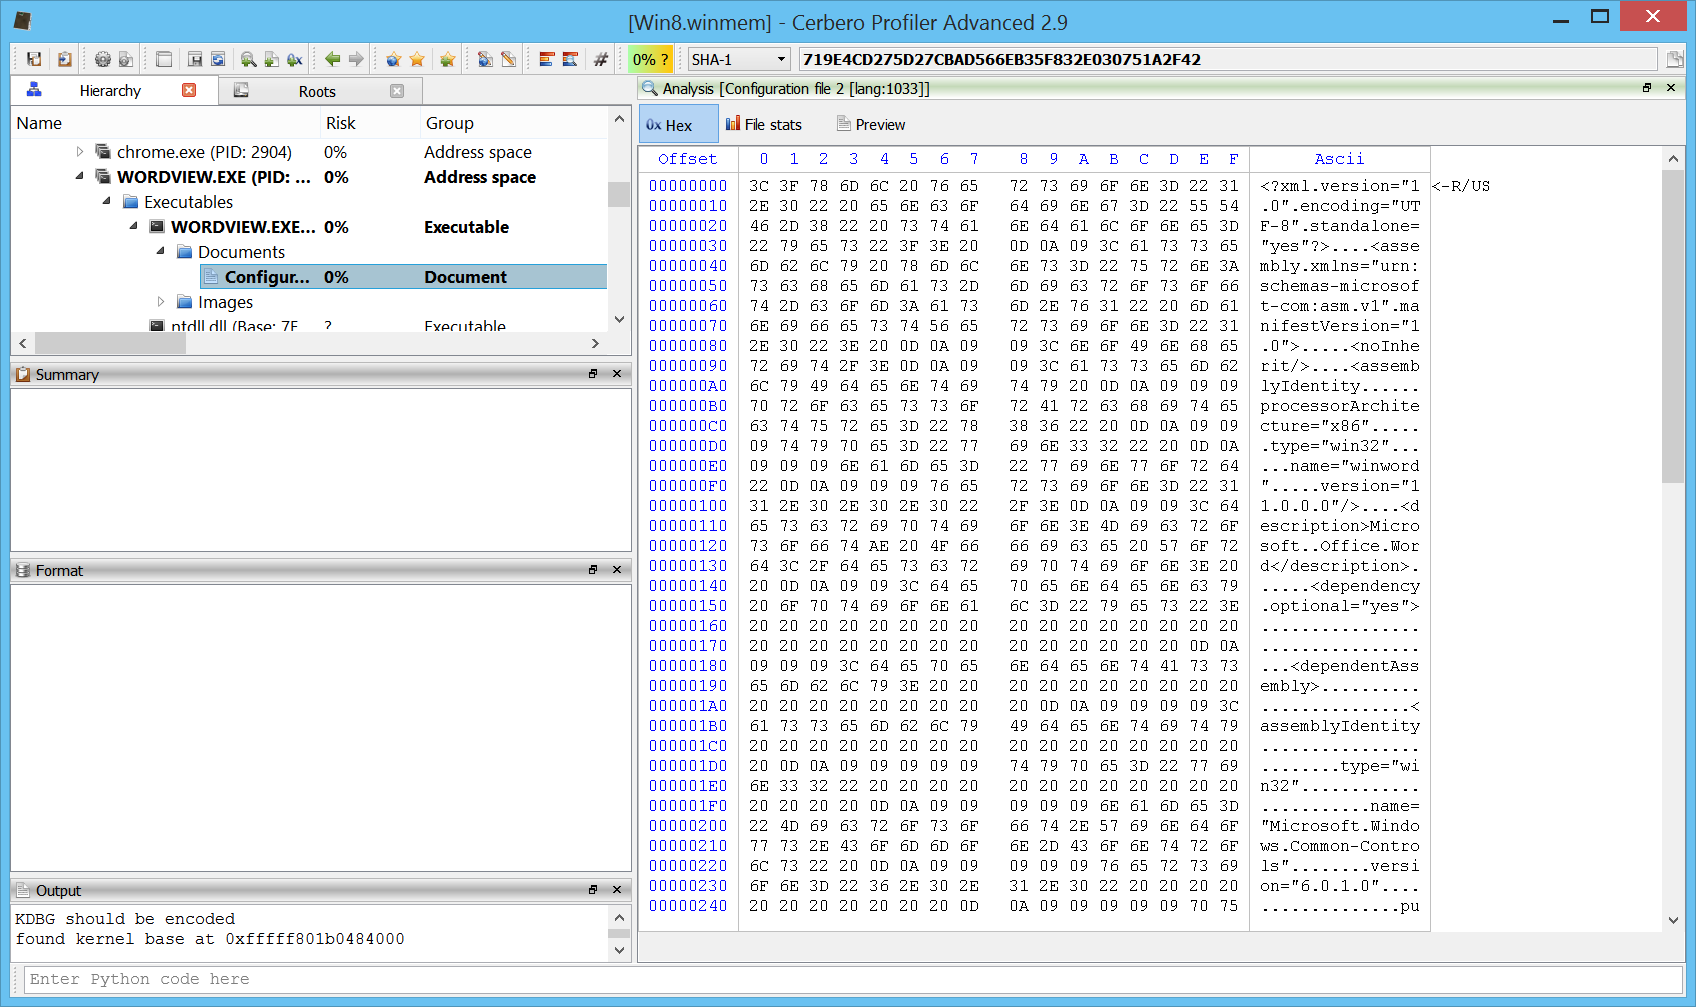
Page flags are now visible in the hex view for memory images. Not only when viewing the main address space of a process, but also when opening a mapped file.
Or the structures of a mapped file.
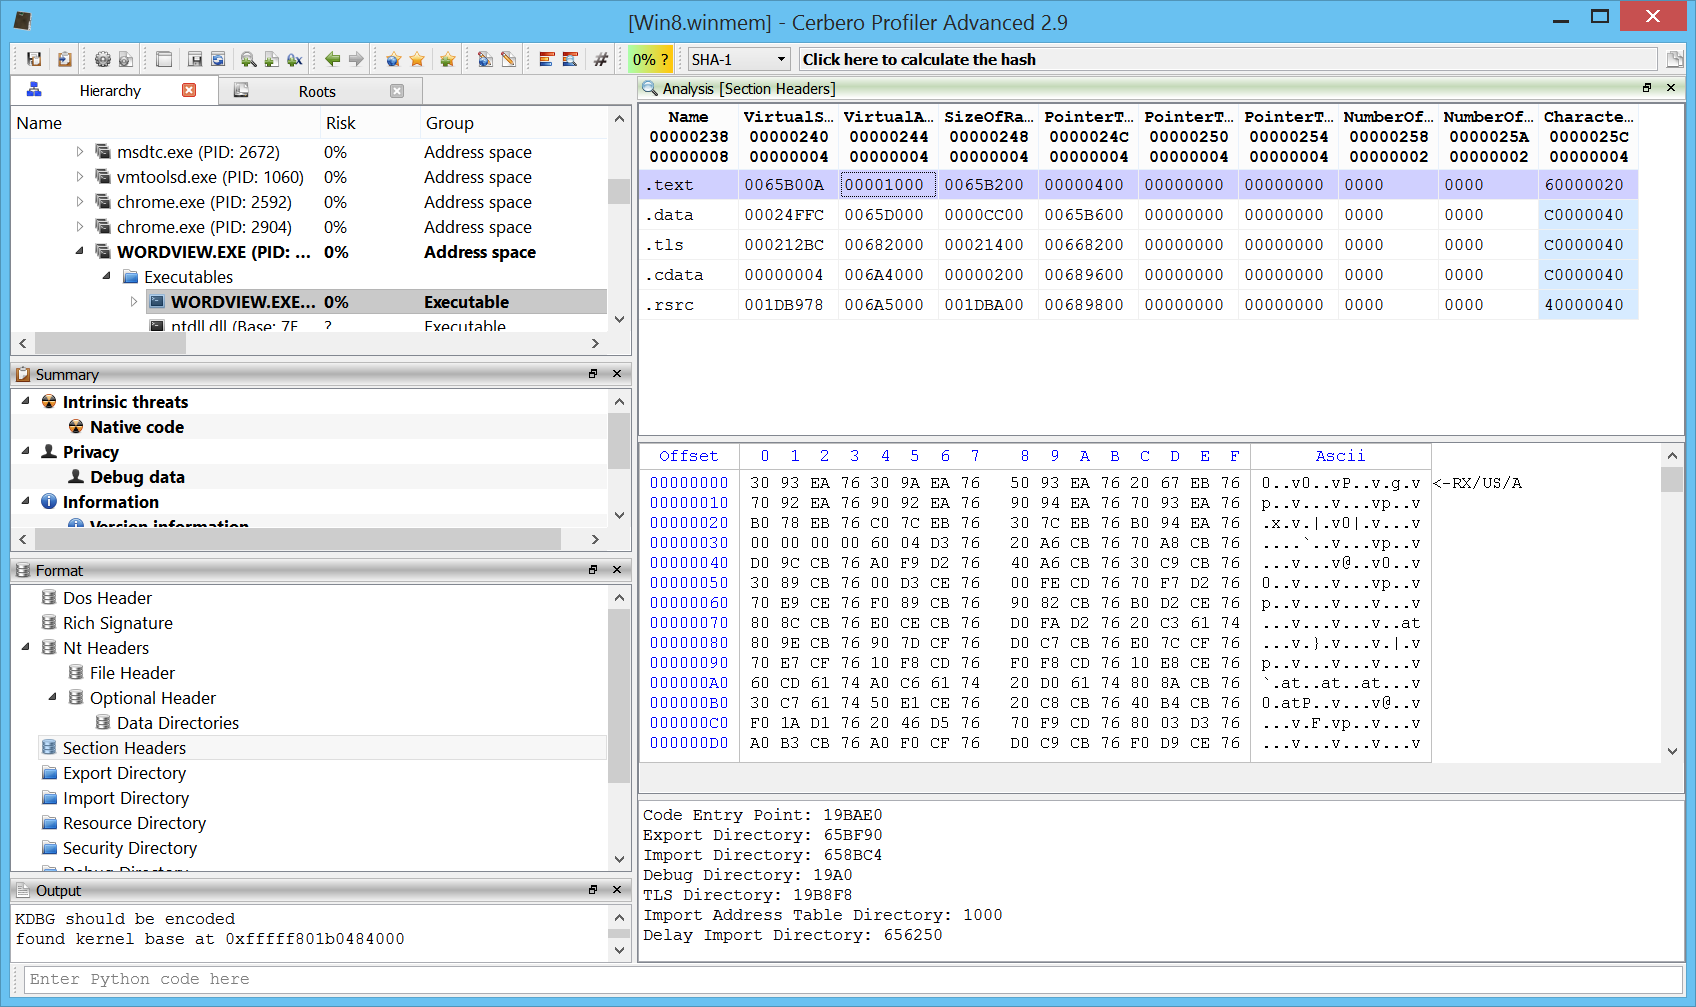
Or any children or resource of a mapped file.
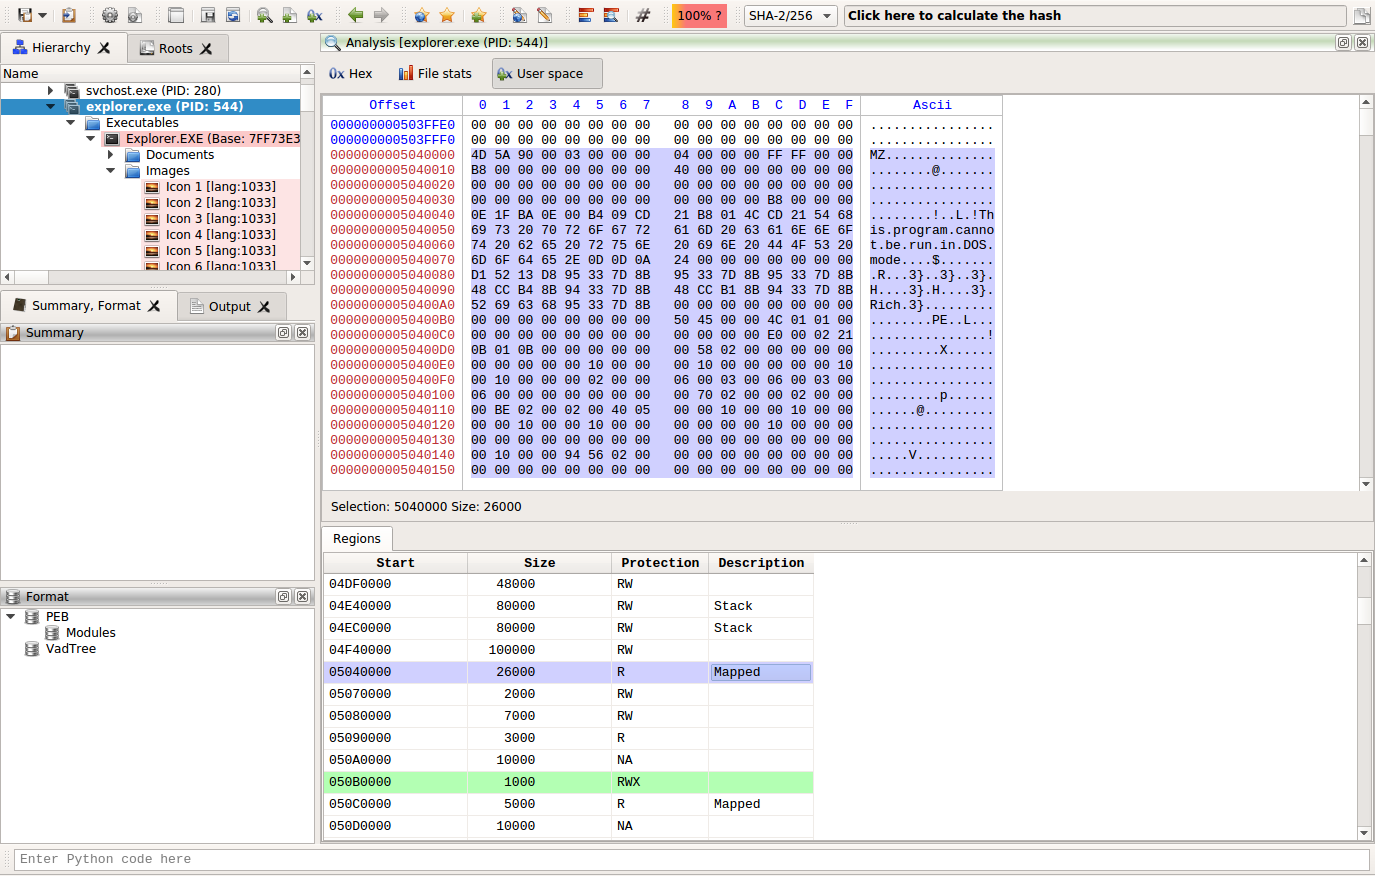
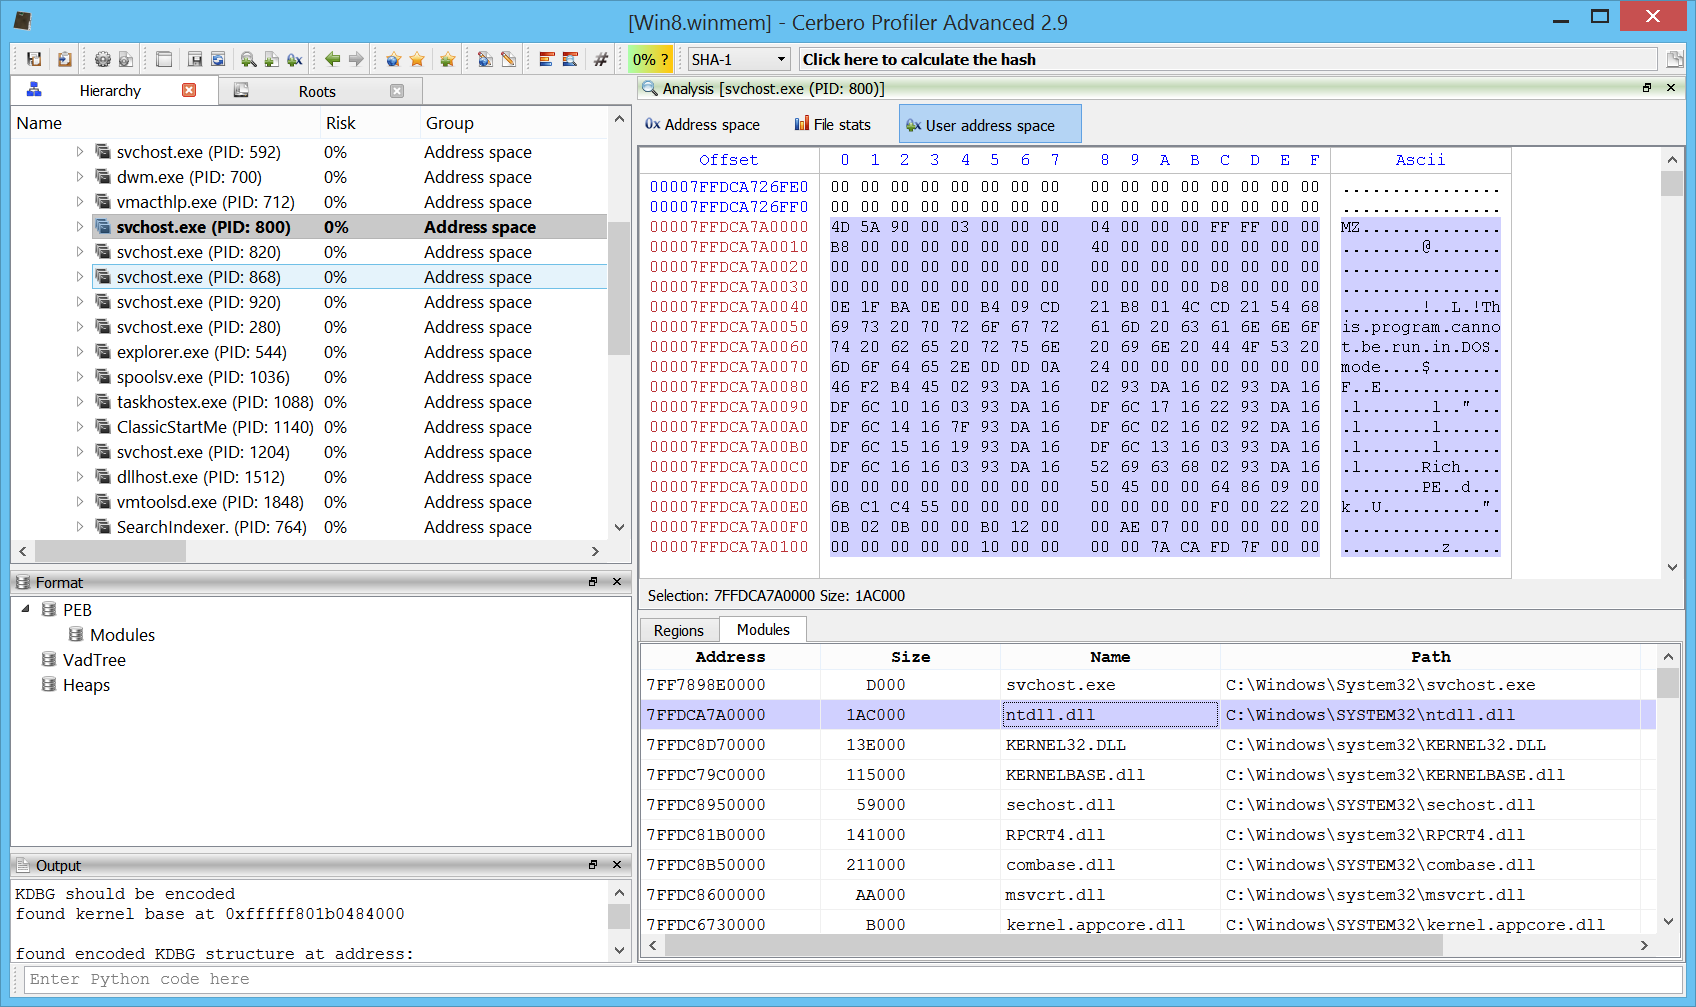
Improved user space view
The user space view for every process now shows also the list of mapped modules.
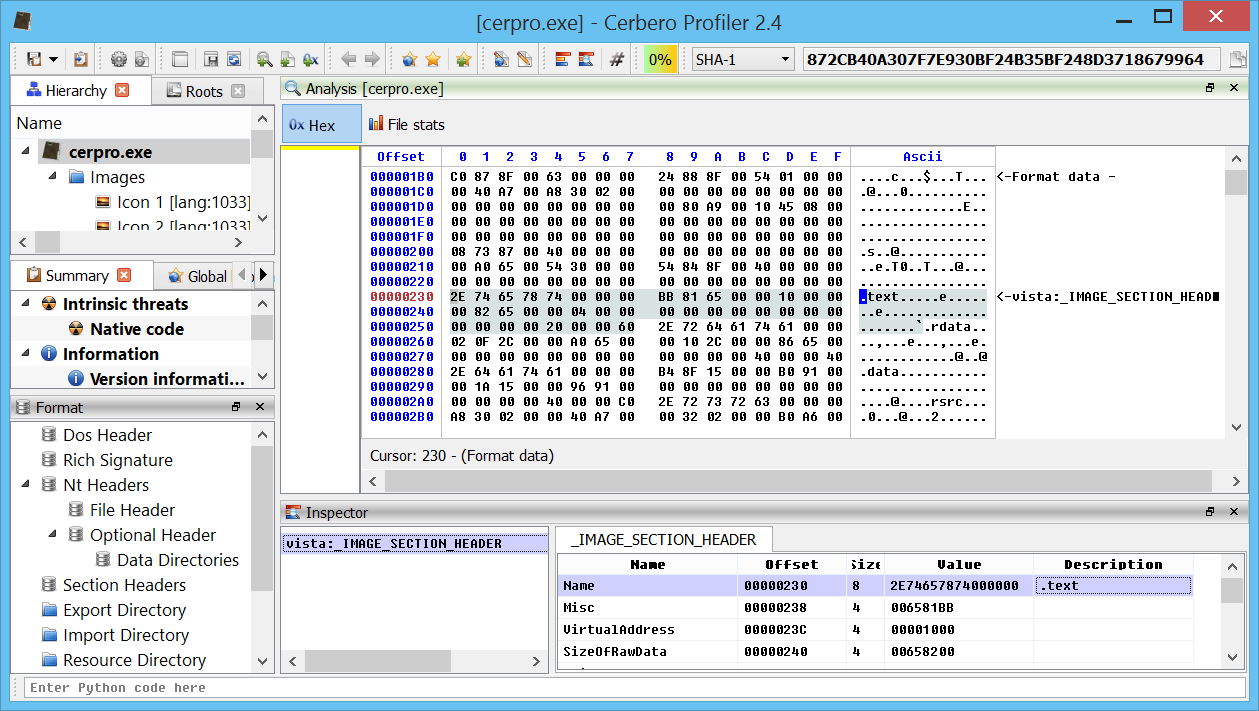
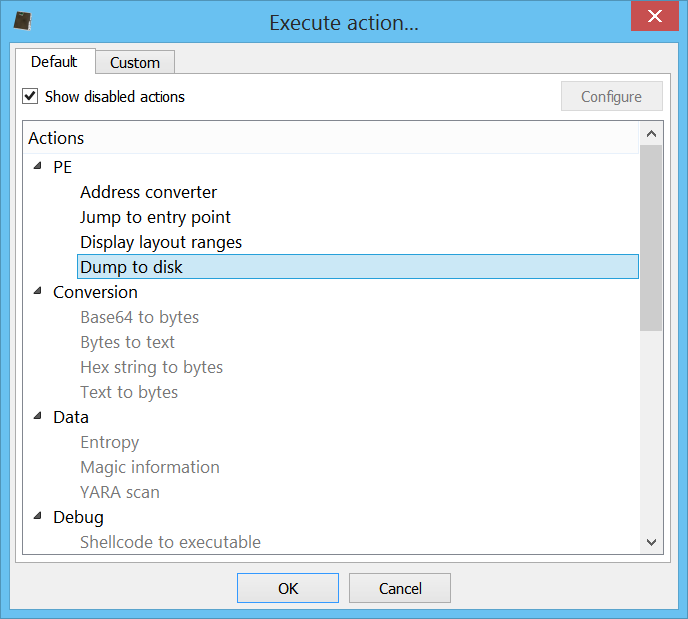
Dump PE to disk
When inspecting a memory mapped executable, we can now dump the file to disk and Profiler will take care of adjusting the PE header in order to be able to inspect the file using external tools as well.
XML fault tolerance
The XML parser has been improved to handle incorrect XML files. This is especially important when handling PDF malware which contains malformed XDP data.
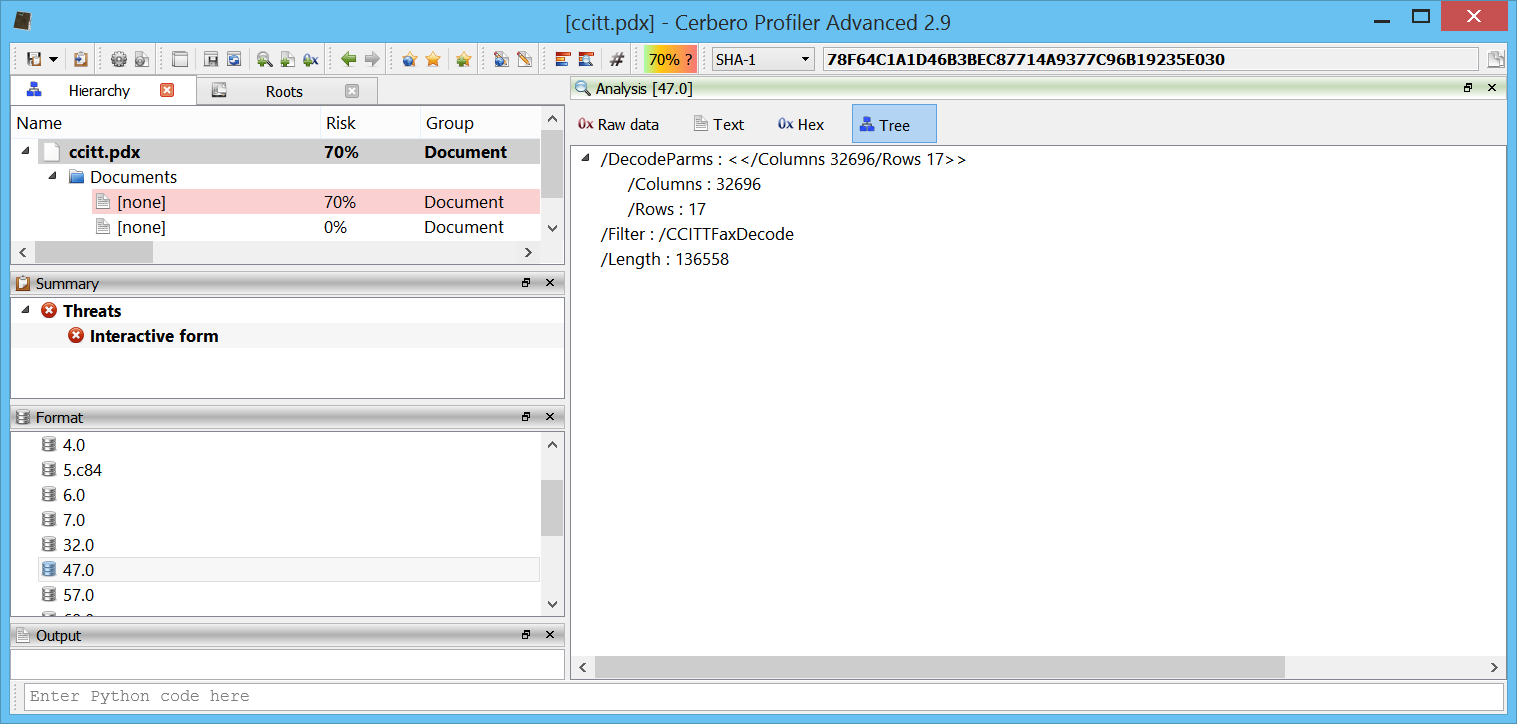
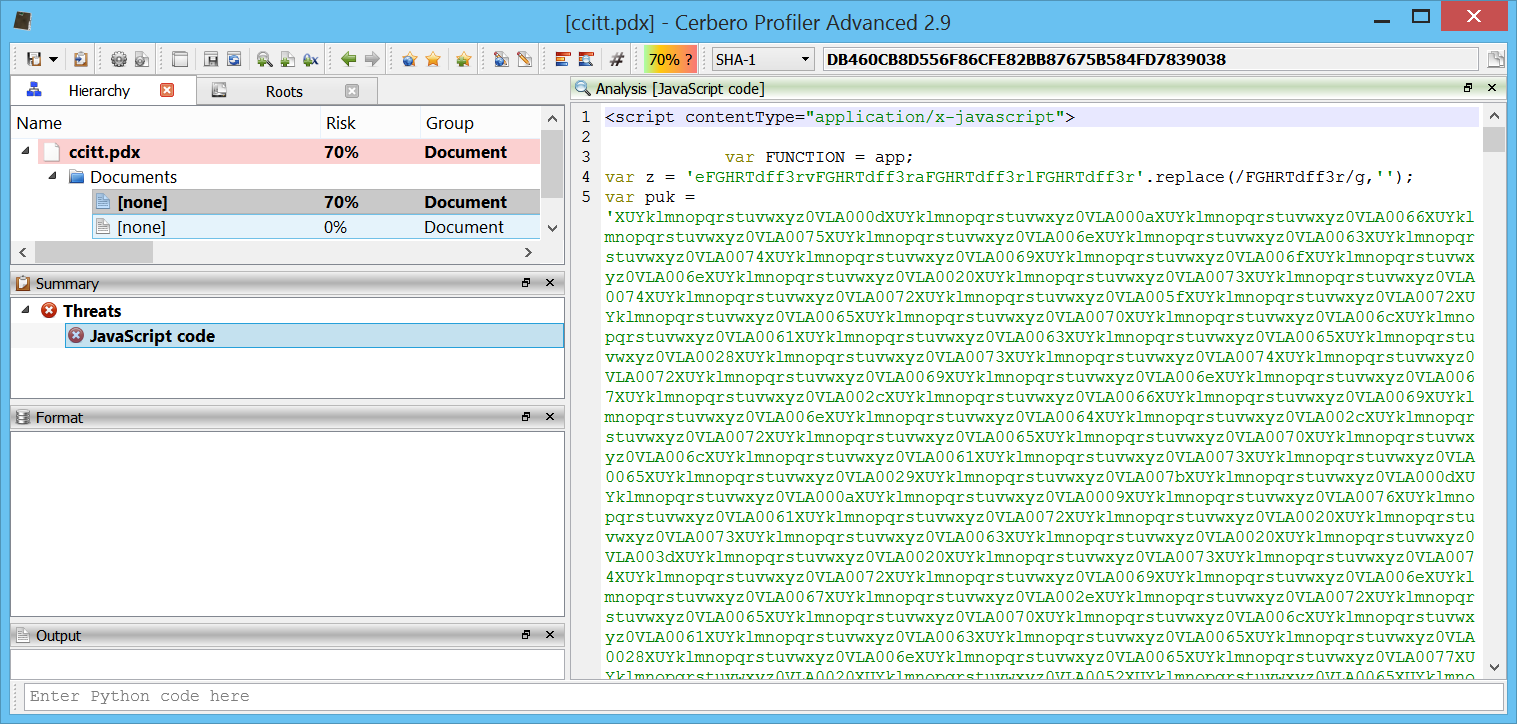
CCITTFax decoder
Yet another decoder has been added to our PDF support. Here we can see a malware sample using this codec to conceal some JavaScript code.
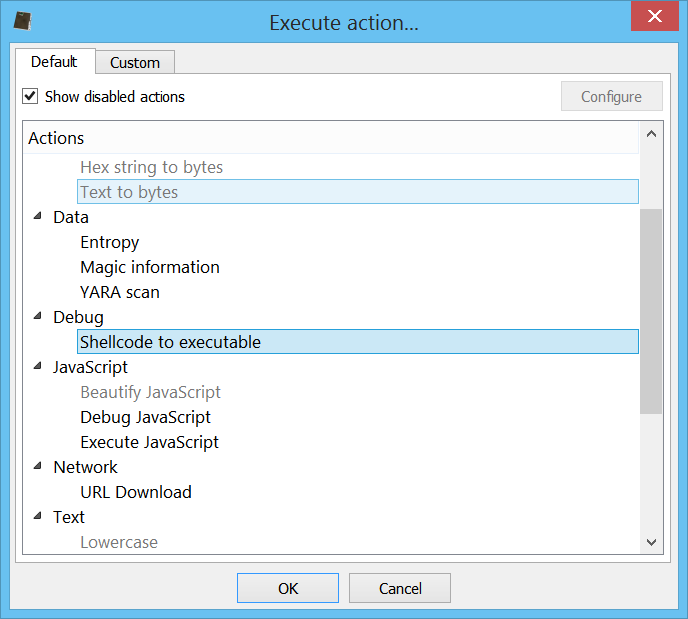
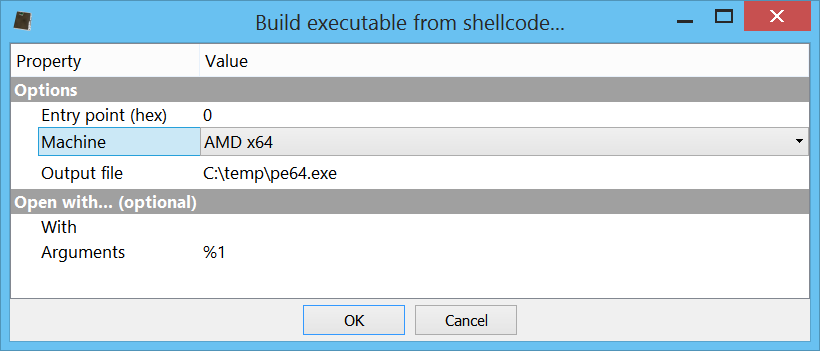
64-bit shellcode to executable
It is now possible to convert x64 shellcode to executable. In the past this feature was limited to x86 shellcode.
To handle x64 shellcode it is necessary to specify “AMD x64” as Machine.
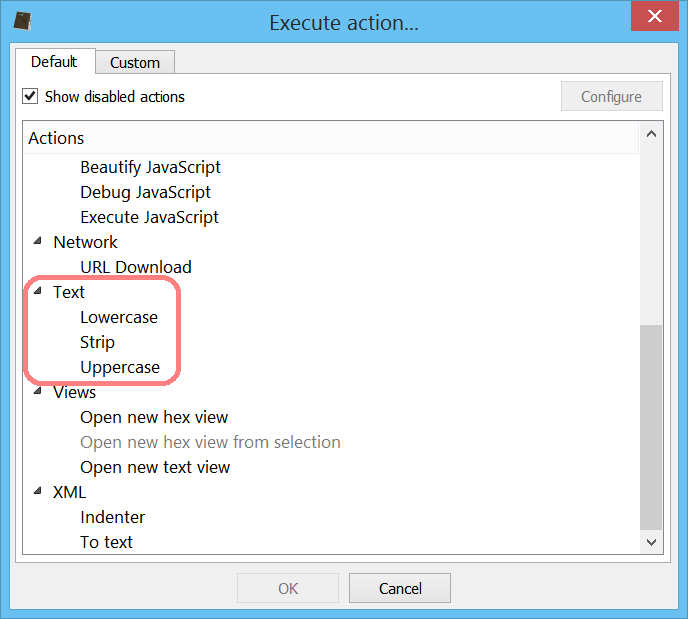
Text modification actions
When being in the context of a text editor, we can now use text actions to do some basic text operations like converting text to lowercase or uppercase or removing spaces.
Enjoy!