Profiler 2.4

Profiler 2.4 is out with the following news:

added initial support for PDB files (including export of types)
added support for Windows Encoded Scripts (VBE, JSE)
– introduced fixed xml structures
added automatic string decoding in struct tables
added Python string command line execution
– remember the last selected logic group
– fixed missing support for wchar_t in C types
– updated Qt to 5.4.1
– various bug fixes

While the most important newly introduced feature is the support for PDB files, here are some interesting new features:

Support for Windows Encoded Scripts (VBE, JSE)

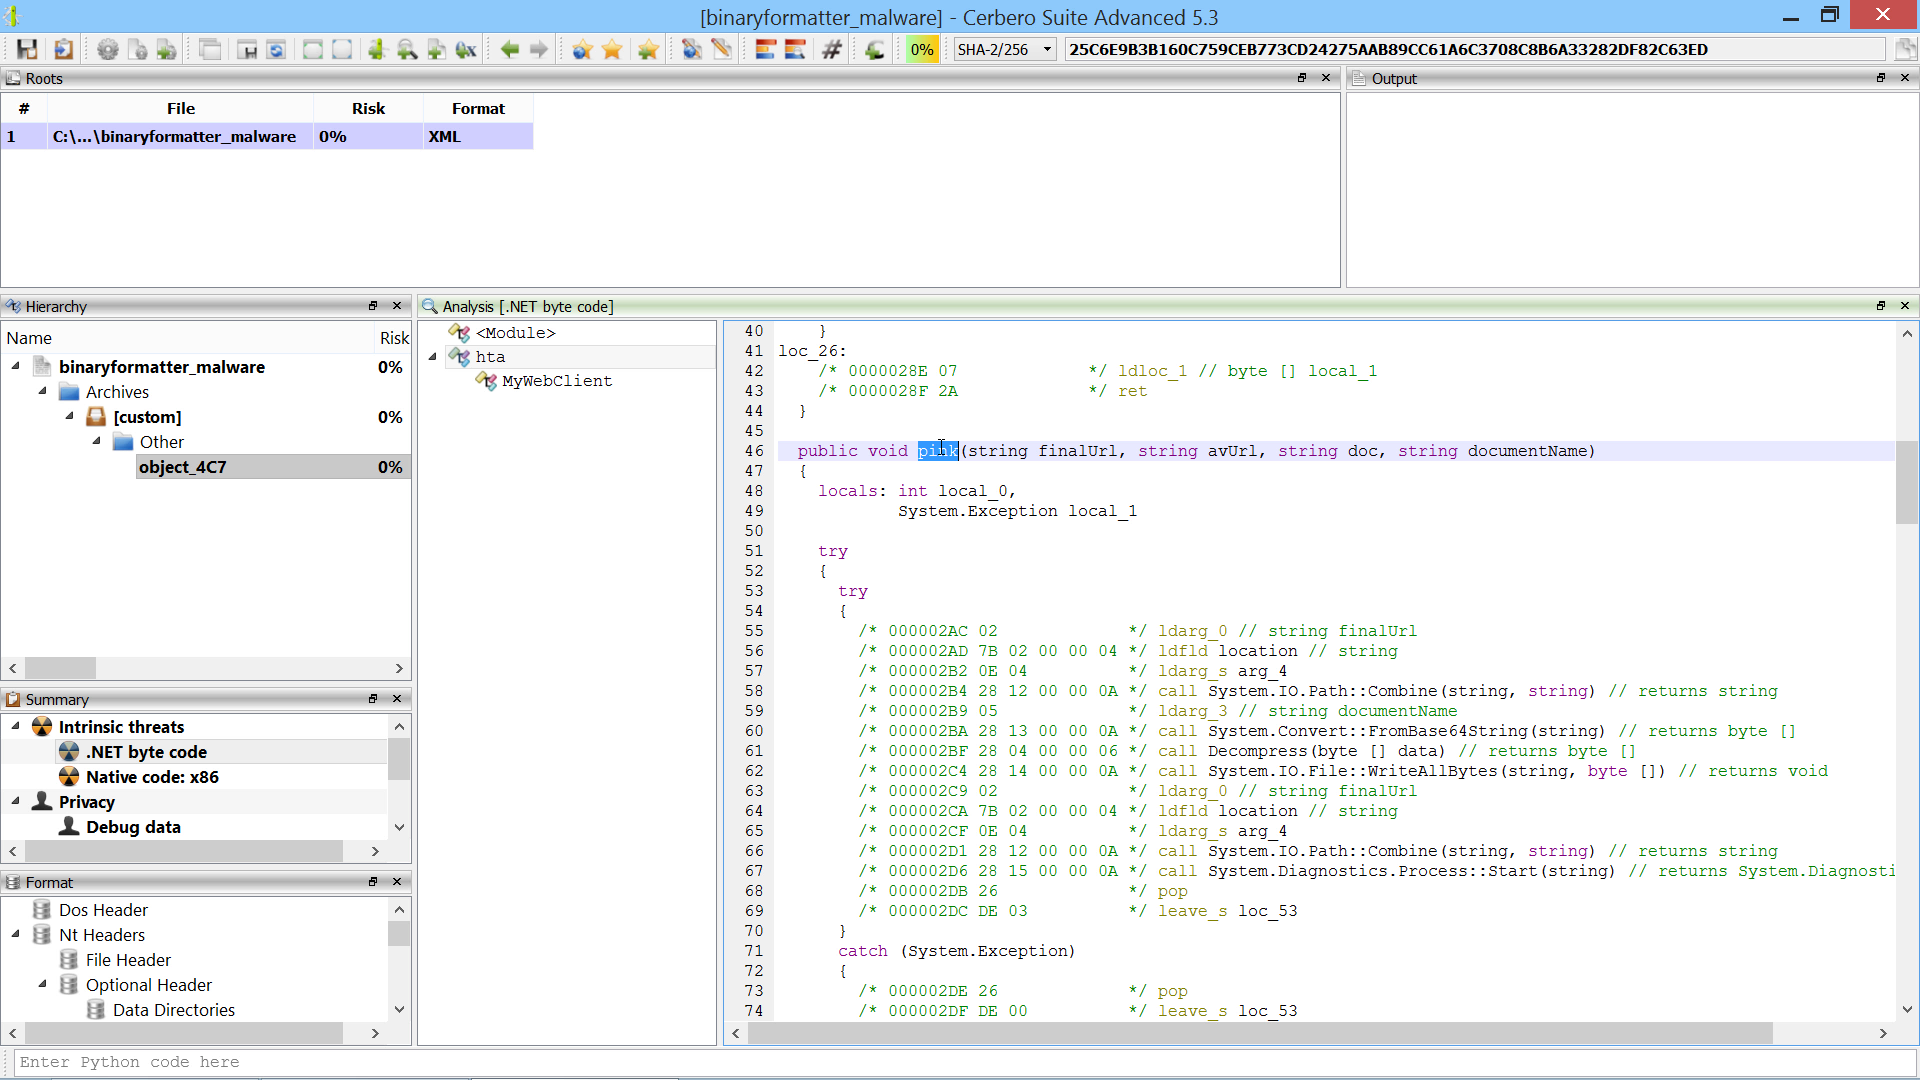
Windows encoded scripts like VBE and JSE files (the encoded variants of VBS and JS script files) are now supported and automatically decoded.

In the screen-shot you can see the decoded output of an encoded file (showed at the bottom).

Automatic string decoding in struct tables

A very basic feature: byte-arrays in structures are automatically checked for strings and in case decoded.

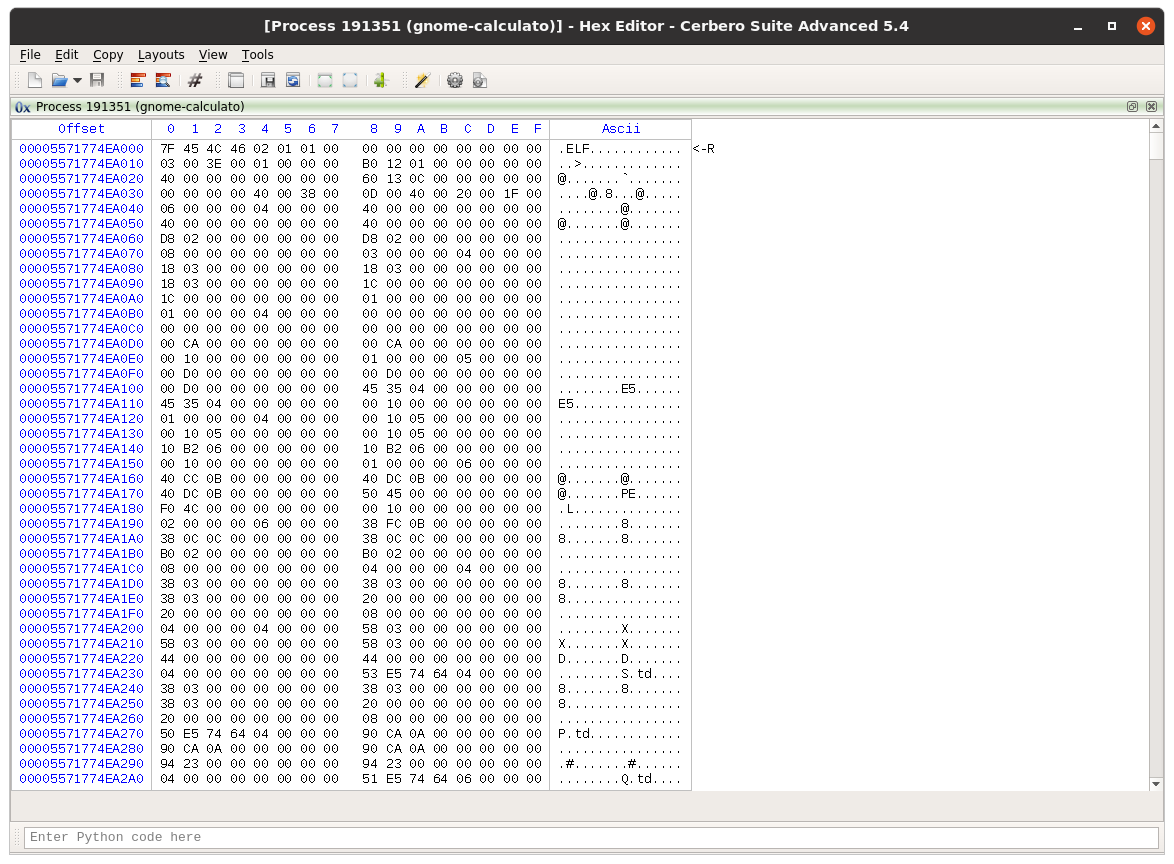
(notice the section name automatically displayed as ascii string)

Python string command line execution

Apart from executing script files passed as command line arguments, now it is also possible to execute Python statements directly passed as argument.

For instance:

cerpro -c -e "from Pro.Core import *;proCoreContext().msgBox(0, \"Hello world!\")"

The optional argument ‘-c’ specifies to not display the UI.

Enjoy!

PDB support (including export of types)

The main feature of the upcoming 2.4 version of Profiler is the initial support for the PDB format. Our code doesn’t rely on the Microsoft DIA SDK and thus works also on OS X and Linux.

Since the PDB format is undocumented, this task would’ve been extremely difficult without the fantastic work on PDBs of the never too much revered Sven B. Schreiber.

Let’s open a PDB file.

As you can see the streams in the PDB can be explored. The TPI stream (the one describing types) offers further inspection.

All the types contained in the PDB can be exported to a Profiler header by pressing Ctrl+R and executing the ‘Dump types to header’ action.

Now the types can be used from both the hex editor and the Python SDK.

We can explore the dumped header by using, as usual, the Header Manager tool.

The type showed above in the hex editor is simple. So let’s look what a more complex PDB type may look like.


The PDB code is also exposed to the SDK. This is a small snippet of code, which dumps all the types to a text buffer and then displays them in a text view.

from Pro.Core import *
from Pro.UI import *
from Pro.PDB import *

def showPDBTypes():
    ctx = proContext()
    out = proTextStream()
    out.setIndentSize(4)

    obj = ctx.currentScanProvider().getObject()
    tpi = obj.GetStreamObject(PDB_STREAM_ID_TPI)
    tpihdr = obj.TPIHeader(tpi)
    tiMin = tpihdr.Num("tiMin")
    tiMax = tpihdr.Num("tiMax")
    tctx = obj.CreateTypeContext(tpi)
    for ti in range(tiMin, tiMax):
        tctx.DumpType(out, ti)

    view = ctx.createView(ProView.Type_Text, "PDB Test")
    view.setLanguage("XML")
    view.setText(out.buffer)
    ctx.addView(view)

showPDBTypes()

In order to dump all types to a single header, you can use the DumpAllToHeader method.

Profiler 2.3

Profiler 2.3 is out with the following news:

introduced YARA 3.2 support
added groups for logic providers
added Python action to encode/decode text
added Python action to strip XML down to text
added the possibility to choose the fixed font
added color randomization for structs and intervals
added close report and quit APIs
exposed more methods of the Report class (including save)
– improved indentation handling in the script editor
synchronized main and workspace output views
– improved output view
– updated libmagic to 5.21
– updated Capstone to 3.0
– many small improvements
– fixed libmagic on Linux
– removed the tray icon
– minor bug fixes

Logic provider groups

Logic providers can now be grouped in order to avoid clutter in the main window. Adding the following line to an existing logic provider will result in a new group being created:

group = Extra

Encode/decode text action

A handy Python action to convert from hex to text and vice-versa using all of Python’s supported encodings. Place yourself in a hex or text view and run the encoding/decoding action ‘Bytes to text’ or ‘Text to bytes’.

The operation will open a new text or hex view depending if it was an encoding or a decoding.

XML to text action

Strips tags from an XML and displays only the text. The action can be performed both on a hex and text view.

And it will open a new text view. This is useful to view the text of a DOCX or ODT document. In the future the preview for these documents will be made available automatically, but in the meantime this action is helpful.

Fixed font preferences

The fixed font used in most views can now be chosen from the ‘General’ settings.

Struct/intervals color randomization

When adding a structure or interval to the hex view the chosen color is now being randomized every time the dialog shows up. This behaviour can be disabled from the dialog itself and it’s also possible to randomize again the color by clicking on the specific refresh button.

Manually picking a different color for every interval is time consuming and so this feature should speed up raw data analysis.

Report APIs

Most of the report APIs have been exposed (check out the SDK documentation). This combined with the newly introduced ‘quit’ SDK method can be used to perform custom scans programmatically and save the resulting report.

Here’s a small example which can be launched from the command line:

from Pro.Core import *
import sys
 
ctx = proCoreContext()
 
def init():
    ctx.getSystem().addFile(sys.argv[1])
    return True
 
def rload():
    ctx.unregisterLogicProvider("test_logic")
    ctx.getReport().saveAs("auto.cpro")
    ctx.quit()
 
ctx.registerLogicProvider("test_logic", init, None, None, None, rload)
ctx.startScan("test_logic")

The command line syntax to run this script would be:

cerpro -r scan.py [file to scan]

The UI will show up and close automatically once the ‘quit’ method is called. Running this script in console mode using the ‘-c’ parameter is not yet possible, because of the differences in message handling on different platforms, but it will be in the future.

Synchronized output views

The output view of the main window and of the workspace are now synchronized, thus avoiding missing important log messages being printed in one or the other context.

Enjoy!

YARA 3.2.0 support

The upcoming 2.3 version of Profiler includes support for the latest YARA engine. This new release is scheduled for the first week of January and it will include YARA on all supported platforms.

One inherent technical advantage of having YARA support in Profiler is that it will be possible to scan for YARA rules inside embedded files/objects, like files in a Zip archive, in a CHM file, in an OLEStream, streams in a PDF, etc.

The YARA engine itself has been compiled with all standard modules (except for cuckoo). Even the magic module is available, since libmagic is also supported by Profiler.

The initial YARA integration comes as a hook extension, an action and Python SDK support. The YARA Python support is the official one and differs from it only in the import statement. You can run existing YARA Python code without modification by using the following import syntax:

import Pro.yara as yara

So let’s start a YARA scan. To do that, we need to enable the YARA hook extension. On Windows remember to configure Python in case you haven’t yet, since all extensions have been written in it.

When a scan is started, a YARA settings dialog will show up.

This dialog lets us choose various settings including the type of rules to load.

There are four possibilities. A simple text field containing YARA rules, a plain text rules file, a compiled rules file or a custom expression which must eval to a valid Rules object.

The report settings specify how we will be alerted of matches. The ‘only matches’ option makes sure that only files (or their sub-files) with a match will be included in the final report. The ‘add to meta-data” option causes the matches to be visible as meta-data strings of a file. The ‘as threats’ option reports every match as a 100% risk threat. The ‘print to output’ option prints the matches to the output view.

Since we had the ‘only matches’ option enabled, we will find only matching files in our final report.

And since we had also the ‘to meta-data’ option enabled, we will see the matches when opening a file in the workspace.

The YARA scan functionality comes also as an action when we find ourselves in a hex view. You can either scan the whole hex data or select a range. Then press Ctrl+R to run an action and select ‘YARA scan’.

In this case we won’t be given report options, since the only thing which can be performed is to print out matches in the output view.

Like this:

Of course, all supported platforms come also with the official YARA command line utility.

Since this has been a customer request for quite some time, I think it will be appreciated by some of our users.

Stripping symbols from an ELF

Just as the previous post about stripping symbols from a Mach-O binary, here’s one about stripping them from an ELF binary.

The syntax to execute the script is the same as in the previous post, only the called function changes:

cerpro -c -r path/to/strip.py:stripELF source destination

Here’s the code:

from Pro.Core import *
from Pro.ELF import *

def stripELF(srcname, dstname):
    oldc = createContainerFromFile(srcname)
    if oldc.isNull():
        print("error: couldn't open '%s'" % (srcname,))
        return
    obj = ELFObject()
    if not obj.Load(oldc):
        print("error: could't load ELF")
        return
    newc = oldc.copyToNewContainer()

    sects = obj.Sections()

    count = 0
    it = obj.SymbolTableSections().iterator()
    it.next()
    while it.hasNext():
        s = sects.At(it.next())
        # only the .symtab section
        if s.Num("sh_type") != 2:
            continue
        strtaboffs = sects.At(s.Num("sh_link")).Num("sh_offset")
        sit = obj.Symbols(s).iterator()
        while sit.hasNext():
            sym = sit.next()
            # only local symbols
            if sym.Num("st_shndx") == 0:
                continue
            nameoffs = sym.Num("st_name") + strtaboffs
            name, ret = obj.ReadUInt8String(nameoffs, 0x10000)
            newc.fill(nameoffs, 0, len(name))
            count += 1

    if newc.save(dstname):
        print("successfully stripped all %d local symbols!" % (count,))
    else:
        print("error: couldn't save stripped binary to '%s'" % (dstname,))

That’s it!

And here again the complete script which you can use to strip both a Mach-O and an ELF binary.

# strip.py

from Pro.Core import *
from Pro.MachO import *
from Pro.ELF import *

def stripMachO(srcname, dstname):
    oldc = createContainerFromFile(srcname)
    if oldc.isNull():
        print("error: couldn't open '%s'" % (srcname,))
        return
    obj = MachObject()
    if not obj.Load(oldc):
        print("error: could't load Mach-O")
        return
    obj.ProcessLoadCommands()
    newc = oldc.copyToNewContainer()

    symlc = obj.SymTableLC()
    stroffs = symlc.Num("stroff")

    count = 0
    it = obj.SymbolNList(symlc).iterator()
    while it.hasNext():
        syms = it.next()
        # only local symbols
        if syms.Num("sect") == 0:
            continue
        nameoffs = obj.AddressToOffset(syms.Num("strx") + stroffs)
        name, ret = obj.ReadUInt8String(nameoffs, 0x10000)
        newc.fill(nameoffs, 0, len(name))
        count += 1

    if newc.save(dstname):
        print("successfully stripped all %d local symbols!" % (count,))
    else:
        print("error: couldn't save stripped binary to '%s'" % (dstname,))

def stripELF(srcname, dstname):
    oldc = createContainerFromFile(srcname)
    if oldc.isNull():
        print("error: couldn't open '%s'" % (srcname,))
        return
    obj = ELFObject()
    if not obj.Load(oldc):
        print("error: could't load ELF")
        return
    newc = oldc.copyToNewContainer()

    sects = obj.Sections()

    count = 0
    it = obj.SymbolTableSections().iterator()
    it.next()
    while it.hasNext():
        s = sects.At(it.next())
        # only the .symtab section
        if s.Num("sh_type") != 2:
            continue
        strtaboffs = sects.At(s.Num("sh_link")).Num("sh_offset")
        sit = obj.Symbols(s).iterator()
        while sit.hasNext():
            sym = sit.next()
            # only local symbols
            if sym.Num("st_shndx") == 0:
                continue
            nameoffs = sym.Num("st_name") + strtaboffs
            name, ret = obj.ReadUInt8String(nameoffs, 0x10000)
            newc.fill(nameoffs, 0, len(name))
            count += 1

    if newc.save(dstname):
        print("successfully stripped all %d local symbols!" % (count,))
    else:
        print("error: couldn't save stripped binary to '%s'" % (dstname,))

The Linux x64 version of Profiler should be released soon. So stay tuned!

Stripping symbols from a Mach-O

A common mistake many developers do is to leave names of local symbols inside applications built on OS X. Using the strip utility combined with the compiler visibility flags is, unfortunately, not enough.

So I wrote a small script for Profiler to be run from the command line and I integrated it in the build process.

The syntax to execute the script is:

cerpro -c -r path/to/strip.py:stripMachO source destination

Here’s the whole code:

# name: strip.py

from Pro.Core import *
from Pro.MachO import *

def stripMachO(srcname, dstname):
    oldc = createContainerFromFile(srcname)
    if oldc.isNull():
        print("error: couldn't open '%s'" % (srcname,))
        return
    obj = MachObject()
    if not obj.Load(oldc):
        print("error: could't load Mach-o")
        return
    obj.ProcessLoadCommands()
    newc = oldc.copyToNewContainer()

    symlc = obj.SymTableLC()
    stroffs = symlc.Num("stroff")

    it = obj.SymbolNList(symlc).iterator()
    while it.hasNext():
        syms = it.next()
        # only local symbols
        if syms.Num("sect") == 0:
            continue
        nameoffs = obj.AddressToOffset(syms.Num("strx") + stroffs)
        name, ret = obj.ReadUInt8String(nameoffs, 0x10000)
        newc.fill(nameoffs, 0, len(name))

    if newc.save(dstname):
        print("successfully stripped all local symbols!")
    else:
        print("error: couldn't save stripped binary to '%s'" % (dstname,))

The code zeroes names of symbols which are not associated to any section in the binary.

Easy. 🙂

Profiler 2.1 (Mac OS X support)

The new version of Profiler is out and it includes support for Mac OS X!

Here’s the change-list for the current version:

– ported Cerbero Profiler to MacOSX
– added command-line scripting support
– updated Header Manager to Clang 3.5
– improved parsing of PE Delay Import Descriptors
– fixed some small issues

Enjoy!

Command-line scripting

The upcoming 2.1 version of Profiler adds support for command-line scripting. This is extremely useful as it enables users to create small (or big) utilities using the SDK and also to integrate those utilities in their existing tool-chain.

The syntax to run a script from command-line is the following:

cerpro.exe -r foo.py

If we want to run a specific function inside a script, the syntax is:

cerpro.exe -r foo.py:bar

This calls the function ‘bar’ inside the script ‘foo.py’.

Everything following the script/function is passed on as argument to the script/function itself.

cerpro.exe -r foo.py these "are arguments" for the script

When no function is specified, the arguments can be retrieved from sys.argv.

import sys

print(sys.argv)

For the command-line above the output would be:

['script/path/foo.py', 'these', 'are arguments', 'for', 'the', 'script']

When a function is specified, the number of arguments are passed on to the function directly:

# cerpro.exe -r foo.py:sum 1 2

def sum(a, b):
    print(int(a) + int(b))

If you actually try one of these examples, you’ll notice that Profiler will open its main window, focus the output view and you’ll see the output of the Python print functions in there. The reason for this behaviour is that the command-line support also allows us to instrument the UI from command-line. If we want to have a real console behaviour, we must also specify the ‘-c’ parameter. Remember we must specify it before the ‘-r’ one as otherwise it will be consumed as an argument for the script.

cerpro.exe -c -r foo.py:sum 1 2

However, on Windows you won’t get any output in the console. The reason for that is that on Windows applications can be either console or graphical ones. The type is specified statically in the PE format and the system acts accordingly. There are some dirty tricks which allow to attach to the parent’s console or to allocate a new one, but neither of those are free of glitches. We might come up with a solution for this in the future, but as for now if you need output in console mode on Windows, you’ll have to use another way (e.g. write to file). Of course, you can also use a message box.

from Pro.Core improt *

proCoreContext().msgBox(MBIconInfo, "hello world!")

But a message box in a console application usually defies the purpose of a console application. Again, this issue affects only Windows.

So, let’s write a small sample utility. Let’s say we want to print out all the import descriptor module names in a PE. Here’s the code:

from Pro.Core import *
from Pro.PE import *

def printImports(fname):
    c = createContainerFromFile(fname)
    pe = PEObject()
    if not pe.Load(c):
        return
    it = pe.ImportDescriptors().iterator()
    while it.hasNext():
        descr = it.next()
        offs = pe.RvaToOffset(descr.Num("Name"))
        name, ret = pe.ReadUInt8String(offs, 200)
        if ret:
            print(name.decode("ascii"))

Running the code above with the following command line:

cerpro.exe -r pestuff.py:printImports C:\Windows\regedit.exe

Produces the following output:

ADVAPI32.dll
KERNEL32.dll
GDI32.dll
USER32.dll
msvcrt.dll
api-ms-win-core-path-l1-1-0.dll
SHLWAPI.dll
COMCTL32.dll
COMDLG32.dll
SHELL32.dll
AUTHZ.dll
ACLUI.dll
ole32.dll
ulib.dll
clb.dll
ntdll.dll
UxTheme.dll

Of course, this is not a very useful utility. But it’s just an example. It’s also possible to create utilities which modify files. There are countless utilities which can be easily written.

Another important part of the command-line support is the capability to register logic providers on the fly. Which means we can force a custom scan logic from the command-line.

from Pro.Core import *
import sys

ctx = proCoreContext()

def init():
    ctx.getSystem().addFile(sys.argv[1])
    return True

def end(ud):
    pass
    
def scanning(sp, ud):
    pass

def scanned(sp, ud):
    pass
    
def rload():
    ctx.unregisterLogicProvider("test_logic")

ctx.registerLogicProvider("test_logic", init, end, scanning, scanned, rload)
ctx.startScan("test_logic")

This script scans a single file given to it as argument. All callbacks, aside from init, are optional (they default to None).

That’s all! Expect the new release soon along with an additional supported platform. 🙂

Profiler 2.0

The new version 2.0 is out! The most important news is that we have a new online store, which allows orders from individuals and not only from organizations. If you’re not yet one of our customers, make sure to test out our trial. 🙂

We now offer 2 type of licenses Home/Academic and Commercial. Also, the price of the commercial license has been reduced. The reason for this is that we stripped active support from the license cost (we now offer support only in the advanced version). After 2 years on the road we had very few support requests and so it made sense to make licenses cheaper by removing the costs of support.

We’re currently finishing to port Profiler to Linux and OSX, so these platforms will be available soon. The current change-list reflects the changes in licensing and our cross-platform effort:

– switched to Visual Studio 2013
– updated Qt to 5.2.1
– updated Python to 3.4
– updated SQLite3
– updated OpenSSL
– switched from the XED2 to the Capstone disasm engine
– added disasm filters for ARM, Thumb, ARM64, MIPS, PowerPC and 8086
– implemented some custom view notifications in Python
– added UI controls to custom views
– made layouts available in the context of the main window
– improved Python SDK
– fixed many small issues

We switched to Qt 5, so PySide is unfortunately no longer supported. On the other hand the SDK now allows to build complex UIs. In fact, we fixed lots of minor issues in the SDK. The reason for that is that in the last months we had to offer a lot of SDK support and so we had to postpone many new features. The upside is that our SDK has become much more robust.

We also changed our licensing schema, which is no longer year-based, but version based. To compensate current customers for the lack of updates in the last months, we have renewed for free their license for the 2.x series. If you’re an active customer and you haven’t received your new license, please contact us!