The new 1.0 version of the Profiler is out with the following news:
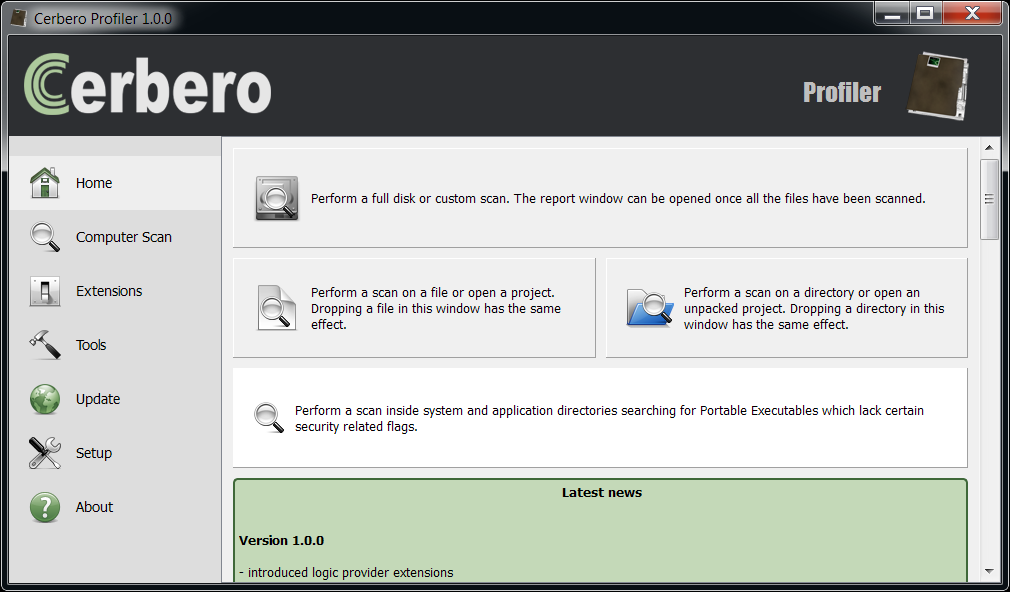
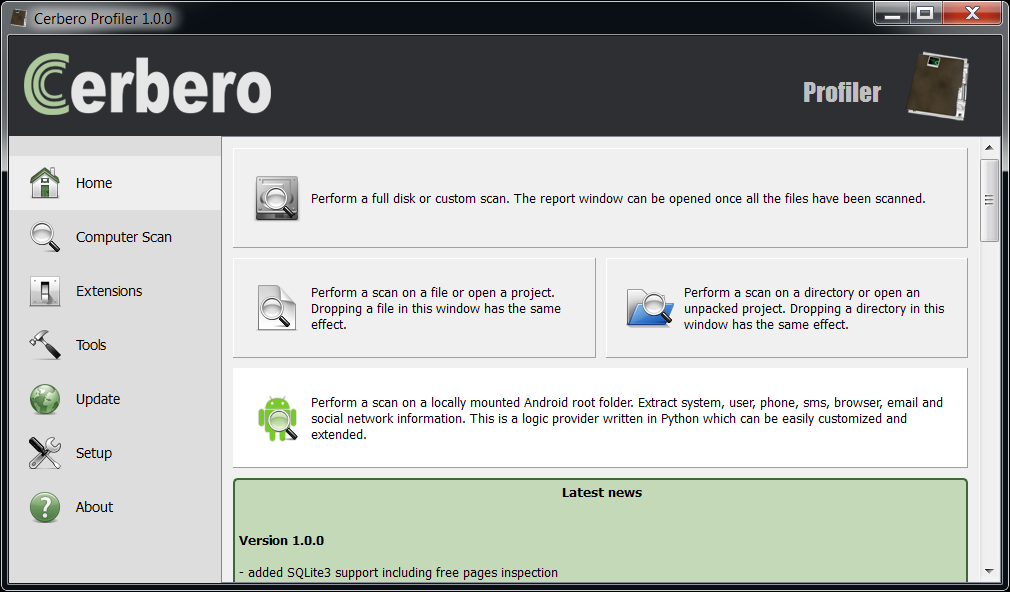
– introduced logic provider extensions
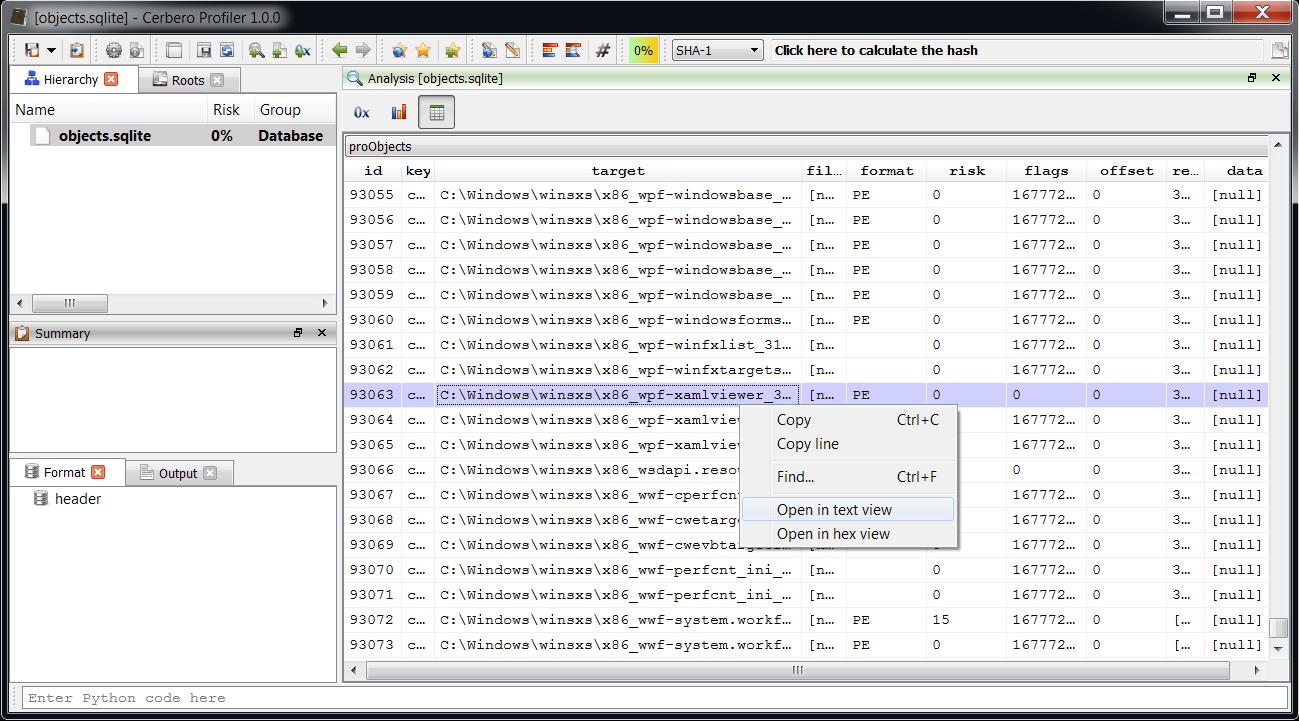
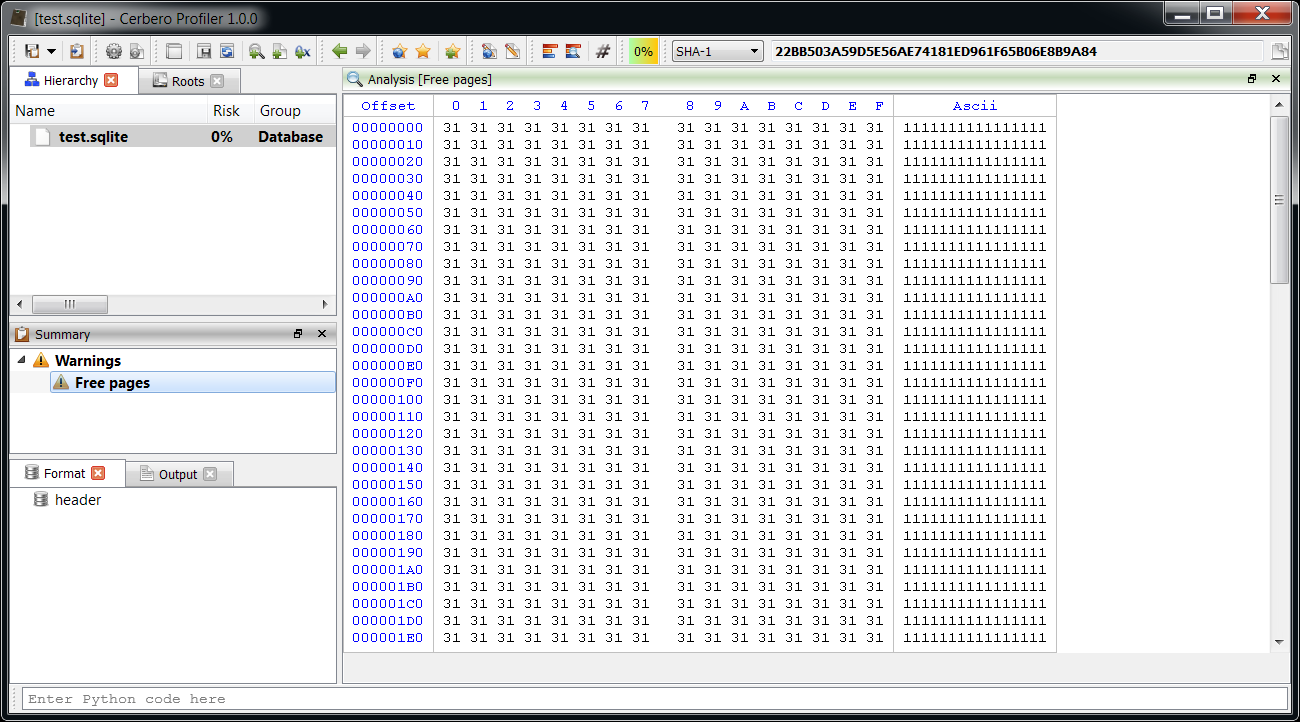
– added SQLite3 support including free pages inspection
– exposed internal database access to extensions
– fixed some issues when executing Python code from other threads
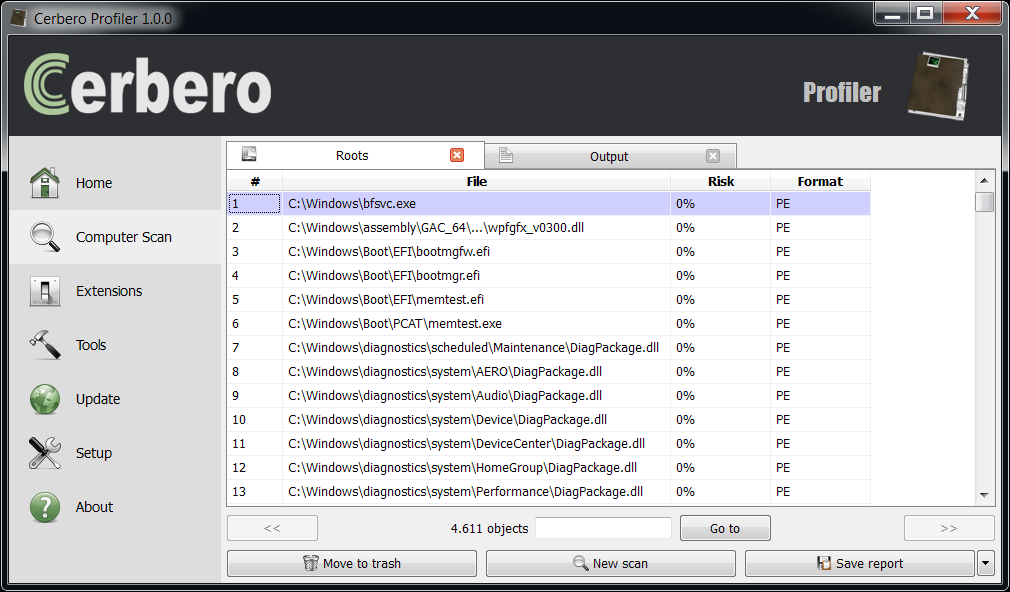
– made actions available in the context of the main window
The 1.0 version represents for its round number and intrinsic meaning a milestone in the development road-map. So how does the actual development stage compare to the original road-map envisioned for 1.0?
Many features we’d like to have included are not there yet. On the other hand an even bigger number of features not originally considered for this version have been added, like complete support for C/C++ types, a JavaScript debugger, an incredibly powerful Python SDK, Lua filters etc.
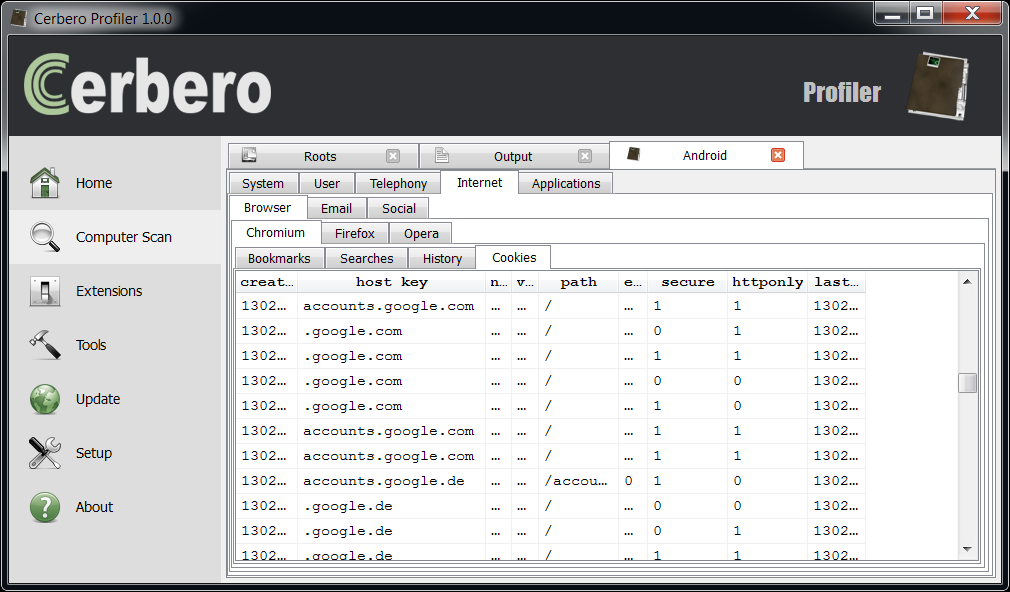
Talking about file formats, few important ones are still missing. For instance ELF support is yet to be added. The reason for this lies behind the original idea to add support first for Windows file types. That’s why there’s support for esoteric file types like LNK and not for ELF. This strategy has been abandoned already some time ago and as you can see in 0.9.6 we added support for Mach-O executables. Also the overall support for Android (APKs, DEX, Binary XML) is very good and that only makes the support for ELF more important. Apart from that we’re happy with the number of formats currently supported and hope to significantly increase the number next year.
Another important aspect is documentation and tutorials. While we take good care of the blog, we’re certainly guilty in this regard. Unfortunately all time spent documenting is time subtracted from creating new features. We tried to give some practical examples this year (including reversing of malware):
- BlueBox Android Challenge
- CVE-2010-0188: PDF/Form/TIFF
- CVE-2012-0158: RTF/OLE/CFBF/PE
- Dissecting an ELF with C++ Types
But even there we certainly could do more. The already existing feature set of the standard version would already need half a book to be covered, not counting explanations regarding file formats. Sooner or later an entire book will become necessary, I guess. Early adopters have the advantage of gradually following the development and easily keeping up-to-date with new features. But the term ‘early adopter’ is relative. Become one of our customers today and you’ll become an ‘early adopter’ in a year! 😉
Sorry for the sales pitch, I was saying… Yes, our product offer has increased. Few months ago we have released PE Insider, a free Portable Executable viewer for the community, based on the same code base as Profiler.
Also, we have recently announced an advanced (forensic oriented) edition of Profiler. While this does subtract some time from the standard version, it also drives development a lot and the standard version will greatly benefit from it. For instance, the newly introduced logic providers could’ve been added later were it not for the advanced version. And the benefits won’t come only as extensions to the core and internal components, but also as additional file support as we’re going to show soon.
To mark the current milestone, starting from this version we’ll change the progression of versions. Every new release will increase the minor version (rather than the last number which will be reserved for bug fixes).
We hope you will accompany us in our journey towards 2.0!