In this post we’re going to explore the SDK part of the Profiler associated to imported structures and also all the C++ internals connected to the layout creation of structures/classes.
At first I thought about subdividing the material into several posts, but at the end it’s probably better to have it all together for future reference.
Layouts
In the SDK a Layout is the class to be used when we need to create a graphical analysis of raw data. While we can create and handle headers from the UI, it is also possible to do it programmatically.
class LayoutInterval

    end
    start

class LayoutData

    arraySize() -> UInt32
    getColor() -> NTRgb
    getDescription() -> NTUTF8String
    getHeader() -> NTUTF8String
    getType() -> NTUTF8String
    setArraySize(UInt32 n)
    setColor(NTRgb rgba)
    setDescription(NTUTF8String const & description)
    setStruct(NTUTF8String const & hdr, NTUTF8String const & type)
    setTypeOptions(UInt32 opt)
    typeOptions() -> UInt32

class LayoutPair

    first
    second

class Layout

    add(MaxUInt offset, MaxUInt size, LayoutData data)
    add(LayoutInterval interval, LayoutData data)
    at(UInt32 i) -> LayoutPair
    at(LayoutPair const & lp) -> UInt32
    at(LayoutInterval interval) -> UInt32
    count() -> UInt32
    fromXml(NTUTF8String const & xstr) -> bool
    getMatches(MaxUInt offset, MaxUInt size) -> LayoutPairList
    getOverlappingWith(MaxUInt offset, MaxUInt size) -> LayoutPairList
    isModified() -> bool
    isNull() -> bool
    isValid() -> bool
    layoutName() -> NTString
    remove(MaxUInt offset, MaxUInt size)
    remove(LayoutInterval interval)
    renameLayout(NTString const & name) -> bool
    saveIfModified()
    setModified(bool b)
    toXml() -> NTUTF8String
Creating a layout is straightforward:
from Pro.Core import *

# create a new layout or retrieve an existing one from the project
layout = proCoreContext().getLayout("LAYOUT_NAME")
# create data
data = LayoutData()
data.setDescription("text")
data.setColor(ntRgba(0xFF, 0, 0, 0x70))
# add interval
layout.add(70, 30, data)
The data can be associated to a structure (or array of structures) as well. Please remember that the name of a header is always relative to header sub-directory of the user directory. Saving the layout is not necessary: it’s automatically saved in the project.
Attaching a layout to a hex view is also very easy:
from Pro.UI import *

hv = proContext().getCurrentView()
if hv.type() == ProView.Type_Hex:
    hv.setLayoutName("LAYOUT_NAME")
Of course, layouts can be used for operations not related to graphical analysis as well.
Headers
Headers are part of the CFF Core and as such the naming convention of the CFFHeader class isn’t camel-case.
class CFFHeaderAliasData

    category
    name
    type
    value
    vtype

class CFFHeaderStructData

    name
    schema
    type

class CFFHeaderTypeDefData

    name
    type

class CFFHeader

    AC_Define
    AC_Enum
    AC_Last
    AVT_Integer
    AVT_Last
    AVT_Real
    AVT_String

    BeginEdit()
    Close()
    EndEdit()
    Equals(CFFHeader s) -> bool
    static GetACName(int category) -> char const *
    static GetAVTName(int vtype) -> char const *
    GetAliasCount() -> UInt32
    GetAliasData(UInt32 i) -> CFFHeaderAliasData
    GetStructBaseData(UInt32 i) -> CFFHeaderStructData
    GetStructCount() -> UInt32
    GetStructData(UInt32 i) -> CFFHeaderStructData
    GetStructData(char const * name) -> CFFHeaderStructData
    GetTypeDefCount() -> UInt32
    GetTypeDefData(UInt32 i) -> CFFHeaderTypeDefData
    InsertAlias(char const * name, int category, char const * type, int vtype, char const * value)
    InsertStruct(char const * name, char const * type, char const * schema)
    InsertTypeDef(char const * name, char const * type)
    IsModified() -> bool
    IsNull() -> bool
    IsValid() -> bool
    LoadFromFile(NTString const & name) -> bool
    LoadFromXml(NTXml xml) -> bool
    LoadFromXml(NTUTF8String const & xml) -> bool
    SetModified(bool b)
A CFFHeader represents an abstract database in which structures/classes and other things are stored. While we won’t use most of its methods, some of them are very useful for common operations.
Let’s say we want to retrieve a specific structure from a header and use it.
from Pro.Core import *
def output(s):
out = proTextStream()
s.Dump(out)
print(out.buffer)
obj = proCoreContext().currentScanProvider().getObject()
hdr = CFFHeader()
if hdr.LoadFromFile("WinNT"):
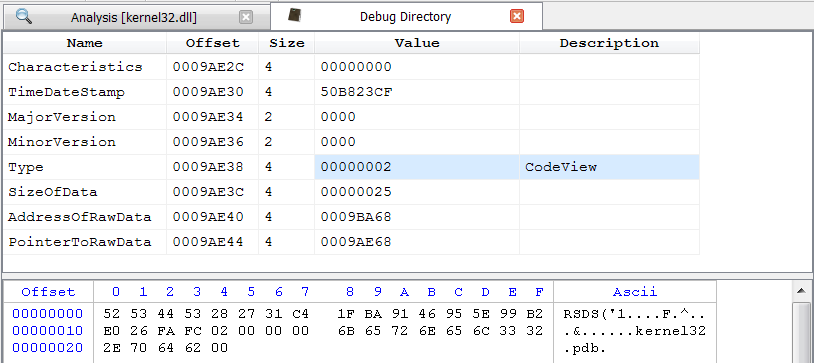
s = obj.MakeStruct(hdr, "_IMAGE_DOS_HEADER", 0, CFFSO_Pack1)
output(s) The output of this snippet is:
e_magic   : 5A4D
e_cblp    : 0090
e_cp      : 0003
e_crlc    : 0000
e_cparhdr : 0004
e_minalloc: 0000
e_maxalloc: FFFF
e_ss      : 0000
e_sp      : 00B8
e_csum    : 0000
e_ip      : 0000
e_cs      : 0000
e_lfarlc  : 0040
e_ovno    : 0000
e_res.0   : 0000
e_res.1   : 0000
e_res.2   : 0000
e_res.3   : 0000
e_oemid   : 0000
e_oeminfo : 0000
e_res2.0  : 0000
e_res2.1  : 0000
e_res2.2  : 0000
e_res2.3  : 0000
e_res2.4  : 0000
e_res2.5  : 0000
e_res2.6  : 0000
e_res2.7  : 0000
e_res2.8  : 0000
e_res2.9  : 0000
e_lfanew  : 000000F8
We can specify the following options when retrieving a structure:
CFFSO_EndianDefault
CFFSO_EndianLittle
CFFSO_EndianBig
CFFSO_EndiannessDefault
CFFSO_EndiannessLittle
CFFSO_EndiannessBig

CFFSO_PointerDefault
CFFSO_Pointer16
CFFSO_Pointer32
CFFSO_Pointer64

CFFSO_PackNone
CFFSO_Pack1
CFFSO_Pack2
CFFSO_Pack4
CFFSO_Pack8
CFFSO_Pack16

CFFSO_NoCompiler
CFFSO_VC
CFFSO_GCC
CFFSO_Clang
These are the same options which are available from the UI when adding a structure to a layout.
When options are not specified, they default to the default structure options of the object. It’s possible to specify the default structure options with this method:
SetDefaultStructOptions(UInt32 options)
We’ll see later the implications of the various flags.
When I said that a CFFHeader represents an abstract database, I meant that it is not really bound to a specific format internally. All it cares about is that data is retrieved or set. The standard format used by headers is SQLite and you’ll need to use that format when creating layouts associated to structures. However, when using structures from Python it can be handy to avoid an associated header file. When the number of structures is very limited and you don’t need write or other complex operations, structures can be stored into an XML string. In fact, the internal format of structures is XML. Let’s take a look at one:
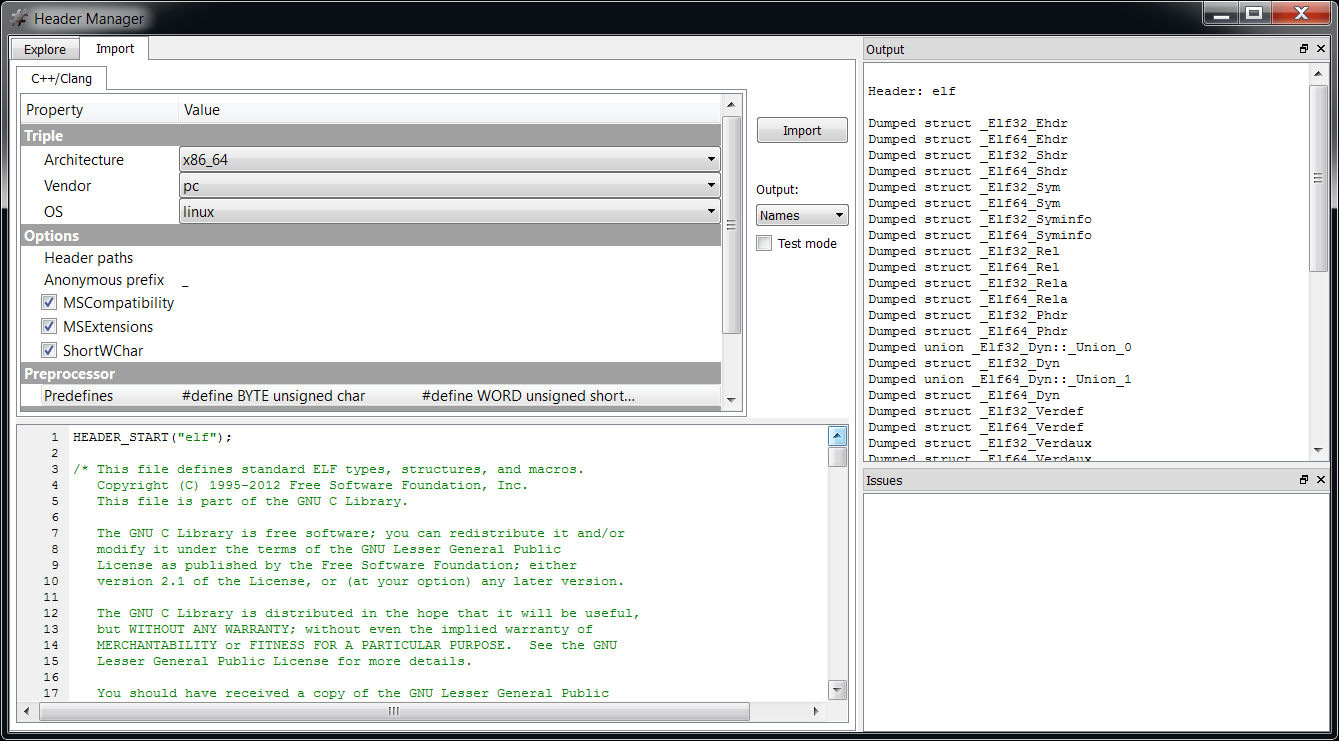
We can inspect the format of a structure stored in a header from the Header Manager in the Explore tab by double clicking on it. But we can also avoid creating a header altogether and output the schema of parsed structures directly when importing them from C++. Just check ‘Test mode’ and as ‘Output’ select ‘schemas’.
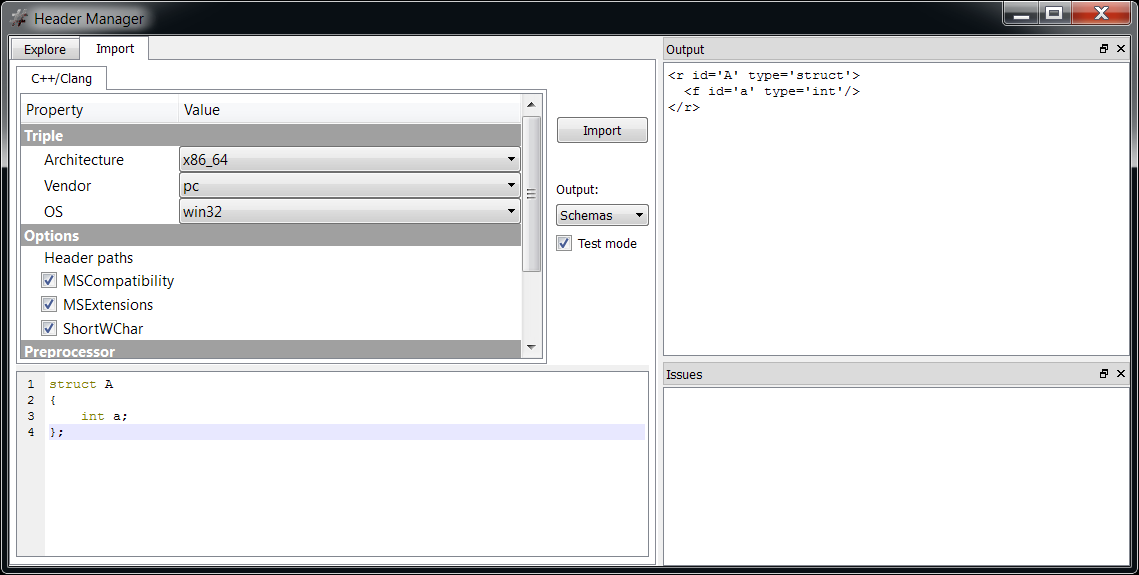
Let’s import a simple structure such as:
struct A
{
    int a;
};
The output will be:
To use this structure from Python we can write the following code:
schema = """


"""

hdr = CFFHeader()
if hdr.LoadFromXml(schema):
    s = obj.MakeStruct(hdr, "A", 0)
    output(s)
As you can see it’s very simple. I’ll use this method for the examples in the rest of the post, because they’re just examples and there’s no point in creating a header file for them.
Pointers
CFFSO_Pointer16
CFFSO_Pointer32
CFFSO_Pointer64
As a rule of thumb if a structure contains a pointer (or a vtable pointer) it is always a good idea to specify the desired size. When the size is omitted both in the explicit options and in the default structure options, the size will be set to the default pointer size of an object, which apart for PEObjects and MachObjects will always be 32bits.
Endianness
CFFSO_EndianLittle
CFFSO_EndianBig
# or
CFFSO_EndiannessLittle
CFFSO_EndiannessBig
When endianness is not specified it will be set to the default of the object. While internally it’s already possible to have individual fields with different endianness, an extra XML field attribute to specify it will be added in the future.
Arrays
The first thing to say is that there’s a difference between an array of top level structures and an array of fields. Creating a top level array of structures is easy:
s = obj.MakeStructArray(hdr, "A", 0, 10)
The support of arrays is somewhat limited. Multidimensional arrays are only partially supported, in the sense that they will be converted to a single dimension. For instance:
struct A
{
    int a[10][10];
};
Or in XML:
Will be convrted to:
a.0 : 00905A4D
a.1 : 00000003
a.2 : 00000004
a.3 : 0000FFFF
a.4 : 000000B8
a.5 : 00000000
a.6 : 00000040
a.7 : 00000000
a.8 : 00000000
a.9 : 00000000
a.10: 00000000
a.11: 00000000
a.12: 00000000

; etc.
Also notice that to access an array element in a CFFStruct the syntax to use is not “a[15]” but “a.15”, e.g.:
print(s.Str("a.15"))
Sub-structures
The only thing to mention about Sub-structures is that complex sub-types are always dumped separately, e.g.:
struct A
{
    int a;
    struct SUB
    {
        int sub;
    } b;
};
In XML:
In Python:
schema = """


"""
hdr = CFFHeader()
if hdr.LoadFromXml(schema):
    s = obj.MakeStruct(hdr, "A", 0)
    output(s)
The output:
a    : 00905A4D
b.sub: 00000003
Being a separate type, we can also use ‘A::Sub’ without its parent.
A new thing we’ve just seen is the presence of multiple structures in a single XML header. I’ve pasted the whole Python code once again just for clarity, in the next examples I won’t repeat it, since the Python code never changes, only the header string does.
Unions
Unions just like sub-structures are fully supported. The only thing to keep in mind is that when we have a top level union, meaning not contained in another structure, such as:
union A
{
    int a;
    short b;
};
Then to access its members it is necessary to add a ‘u.’ prefix. The reason for this is that CFFStructs support unions only as members, so the union above will result in a CFFStruct with a union member called ‘u’.
u.a: 00905A4D
u.b: 5A4D
Anonymous types
Anonymous types are only partially supported in the sense that they are given a name when imported. A type such as the following:
struct A
{
    union
    {
        int a;
        int b;
    } u;
};
Results in the following xml:
As you can see a ‘_Type_’ + number naming convention has been used to rename anonymous types. The first character (‘_’) in the name represents the default anonymous prefix. This prefix is customizable. If a typedef is found for an anonymous type, then the new name for that type will created by using the anonymous prefix + the typedef name.
Bit-fields
Bit-fields are fully supported.
struct A
{
    int a : 1;
    int b : 4;
};
Output:
a: 01
b: 06
 : 0482D2
The unnamed field at the end represents the unused bits given the field size, in this case we have an ‘int’ type and we’ve used only 5 bits of it.
There are significant differences in how compilers handle bit-fields. Visual C++ behaves differently than GCC/Clang. Some of the differences are summarized in this message by Richard W.M. Jones.
Another important difference I noticed is how bit fields are coalesced when the type changes, e.g.:
struct A
{
    int a : 1;
    short b : 1;
    int c : 1;
};
Without going now into how they are coalesced, the thing to remember is that the Profiler handles all these cases, but you need to specify the compiler to obtain the correct result.
Namespaces
Namespaces are fully supported.
namespace N
{

struct A
{
    int a;
};

}
Results in:
Moreover, just as in C++ we can use namespaces to encapsulate #include directives.
namespace N
{

#include

}
This will cause all the types declared in ‘Something’ to be prefixed by the namespace (‘N::’). This can be very handy when we want to include types with the same name into the same header file.
Inheritance
Inheritance is fully supported.
struct A
{
    int a;
};

struct B : public A
{
    int b;
};
XML:
Output:
a: 00905A4D
b: 00000003
Same with multiple inheritance:
Output:
a: 00905A4D
b: 00000003
c: 00000004
VTables
The presence of virtual table pointers in structures which require them is fully supported. Let’s take for instance:
struct A
{
    virtual void v() { }
    int a;
};
XML:
Output:
__vtable_ptr_0: 00905A4D
a             : 00000003
Let’s see an example with multiple inheritance:
struct A
{
    virtual void va() { }
    int a;
};

struct B
{
    virtual void vb() { }
    int b;
};

struct C : public A, public B
{
    int c;
};
Output:
__vtable_ptr_0: 00905A4D
__vtable_ptr_1: 00000003
a             : 00000004
b             : 0000FFFF
c             : 000000B8
When virtual tables are involved it is very important to specify the compiler, because things can vary a great deal between VC++ and GCC/Clang.
Virtual Inheritance
Virtual inheritance is fully supported. Virtual inheritance is a C++ feature to be used in scenarios which involve multiple inheritance with a common base class.
Let’s take the complex case of:
struct A
{
    int a;
    virtual void va() {}
};

struct B : public virtual A
{
    virtual void vb() {}
};

struct B2
{
    virtual void vb2() {}
};

struct C : public virtual A, public B
{
    int b;
    virtual void vc() {}
};

struct TOP
{
    int top;
    C c;
    virtual void vtop() {}
};
Output (Visual C++):
__vtable_ptr_0  : 00905A4D
top             : 00000003
c.__vtable_ptr_0: 00000004
c.__vtable_ptr_1: 0000FFFF
c.__vtable_ptr_2: 000000B8
c.b             : 00000000
c.a             : 00000040
Output (GCC):
__vtable_ptr_0  : 00905A4D
top             : 00000003
c.__vtable_ptr_0: 00000004
c.b             : 0000FFFF
c.a             : 000000B8
As you can see the layout differs from Visual C++ to GCC. Another thing to notice is that members of virtual base classes are appended at the end. There’s a very good presentation by Igor Skochinsky on C++ decompilation you can watch for more information.
Field alignment
Field alignment is an important factor. Structures which are not subject to packing constraints are aligned up to their biggest native member. It’s more complex than this, because sub-structures influence parent structures but not vice versa. Suffice it to say that there are some internal gotchas, but the Profiler should handle all cases correctly.
Packing
CFFSO_Pack1
CFFSO_Pack2
CFFSO_Pack4
CFFSO_Pack8
CFFSO_Pack16
When a packing constraint is applied, fields are aligned to either the field size or the packing whichever is less. A packing constraint of 1 is essential if we want to read raw data without any kind of padding between fields. For instance, PE structures in WinNT.h are all pragma packed to 1, so we must specify the same packing when using them.
Templates
And for the end a little treat: C++ templates. Let’s take for instance:
template
struct A
{
    T a;
};

template
struct B
{
    T b;
};
XML:
We can specify template parameters following the C++ syntax:
s = obj.MakeStruct(hdr, "B>", 0)
Output:
b.a: 00905A4D
So, even nested templates are supported. 😉