The new version 2.0 is out! The most important news is that we have a new online store, which allows orders from individuals and not only from organizations. If you’re not yet one of our customers, make sure to test out our trial. 🙂
We now offer 2 type of licenses Home/Academic and Commercial. Also, the price of the commercial license has been reduced. The reason for this is that we stripped active support from the license cost (we now offer support only in the advanced version). After 2 years on the road we had very few support requests and so it made sense to make licenses cheaper by removing the costs of support.
We’re currently finishing to port Profiler to Linux and OSX, so these platforms will be available soon. The current change-list reflects the changes in licensing and our cross-platform effort:
– switched to Visual Studio 2013
– updated Qt to 5.2.1
– updated Python to 3.4
– updated SQLite3
– updated OpenSSL
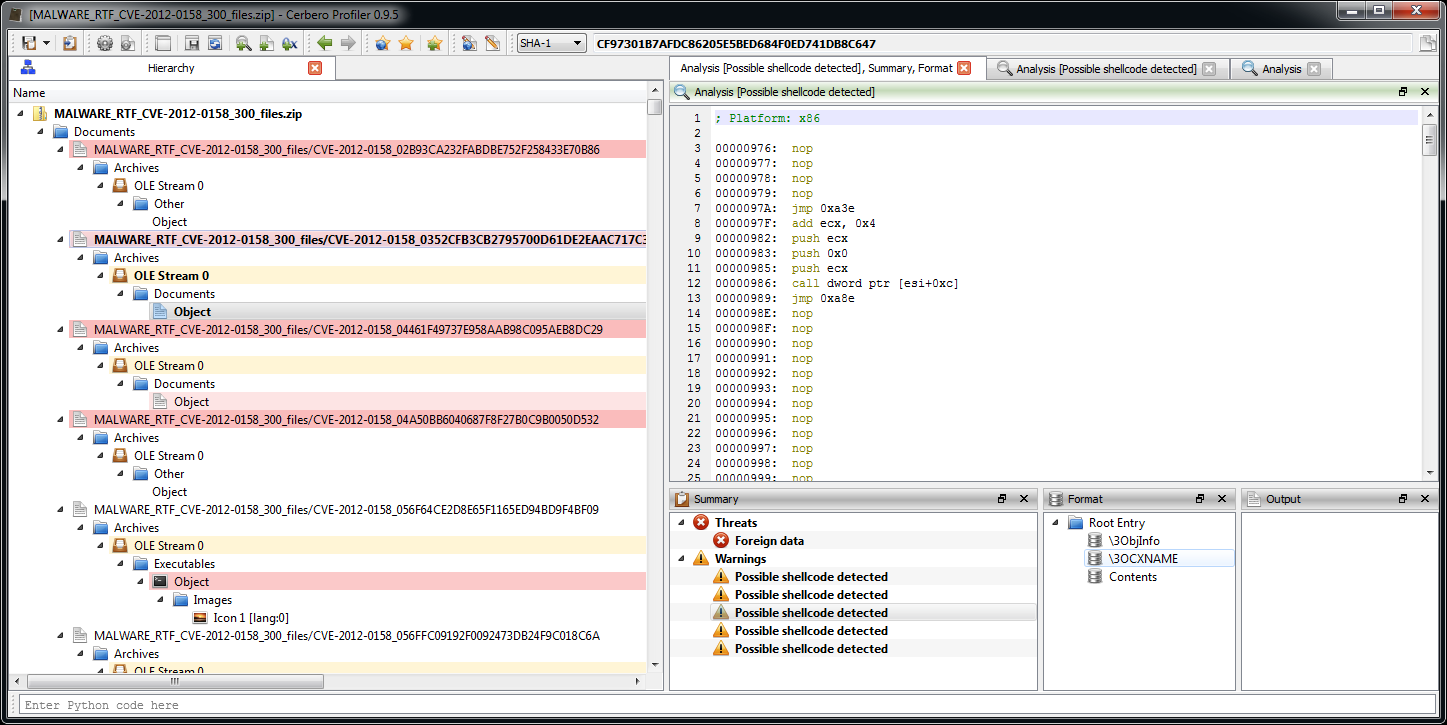
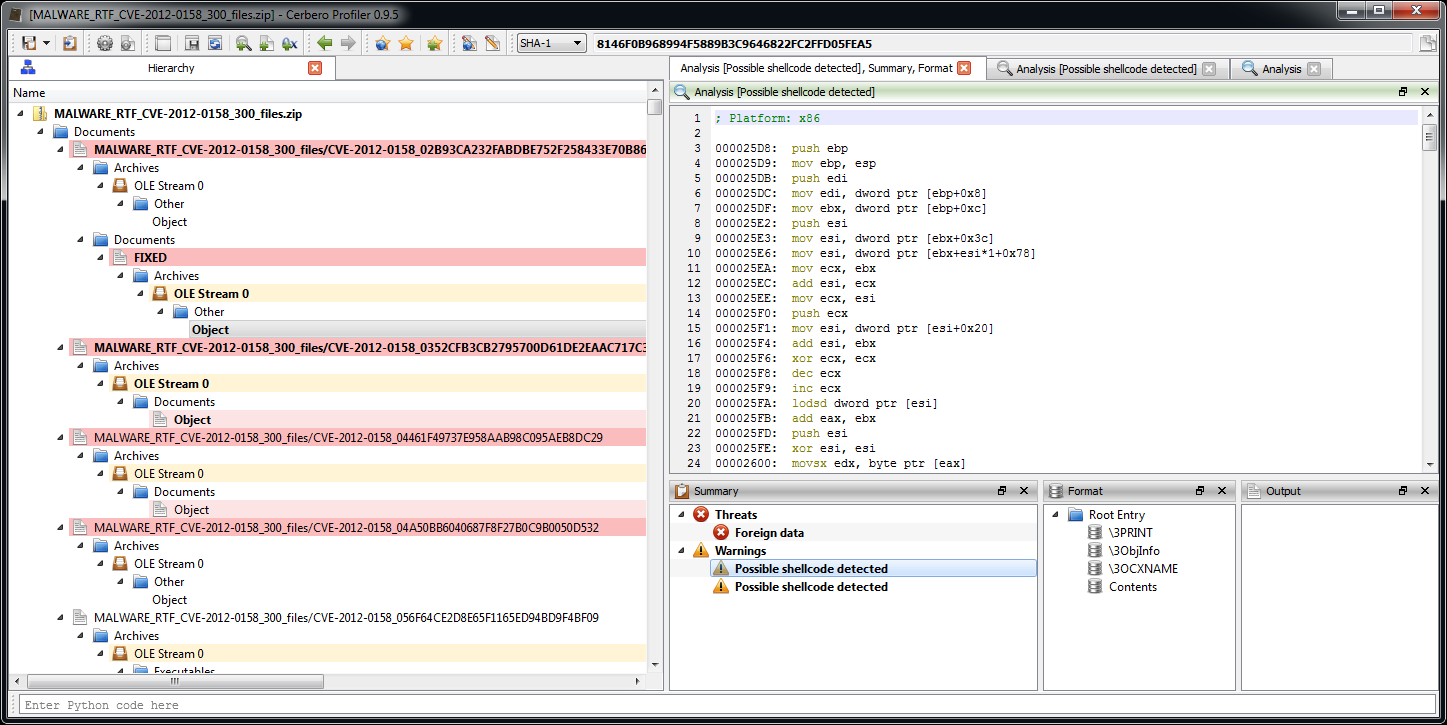
– switched from the XED2 to the Capstone disasm engine
– added disasm filters for ARM, Thumb, ARM64, MIPS, PowerPC and 8086
– implemented some custom view notifications in Python
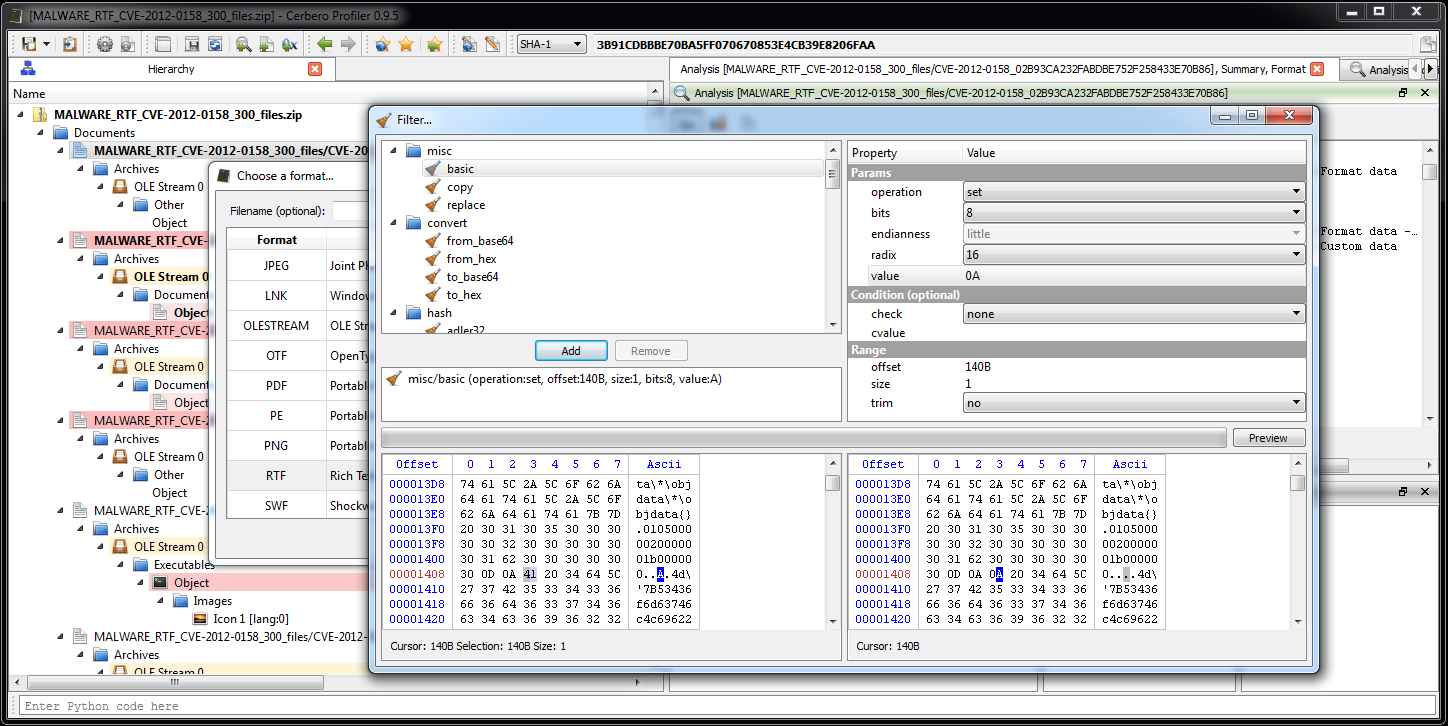
– added UI controls to custom views
– made layouts available in the context of the main window
– improved Python SDK
– fixed many small issues
We switched to Qt 5, so PySide is unfortunately no longer supported. On the other hand the SDK now allows to build complex UIs. In fact, we fixed lots of minor issues in the SDK. The reason for that is that in the last months we had to offer a lot of SDK support and so we had to postpone many new features. The upside is that our SDK has become much more robust.
We also changed our licensing schema, which is no longer year-based, but version based. To compensate current customers for the lack of updates in the last months, we have renewed for free their license for the 2.x series. If you’re an active customer and you haven’t received your new license, please contact us!